. 2021 Feb 4:10:e59775.
doi: 10.7554/eLife.59775.

Cell-density independent increased lymphocyte production and loss rates post-autologous HSCT

Affiliations

Cell-density independent increased lymphocyte production and loss rates post-autologous HSCT

Mariona Baliu-Piqué et al. Elife. .

Abstract

Lymphocyte numbers need to be quite tightly regulated. It is generally assumed that lymphocyte production and lifespan increase homeostatically when lymphocyte numbers are low and, vice versa, return to normal once cell numbers have normalized. This widely accepted concept is largely based on experiments in mice, but is hardly investigated in vivo in humans. Here we quantified lymphocyte production and loss rates in vivo in patients 0.5-1 year after their autologous hematopoietic stem cell transplantation (autoHSCT). We indeed found that the production rates of most T- and B-cell subsets in autoHSCT-patients were two to eight times higher than in healthy controls, but went hand in hand with a threefold to ninefold increase in cell loss rates. Both rates also did not normalize when cell numbers did. This shows that increased lymphocyte production and loss rates occur even long after autoHSCT and can persist in the face of apparently normal cell numbers.

Keywords: autologous hematopoietic; deuterium labeling; human; immunology; inflammation; lymphocyte dynamics; lymphopenia; mathematical modeling; stem cell transplantation.


Conflict of interest statement

MB, Vv, JD, Lv, AJ, SO, Mv, Rd, JB, KT No competing interests declared, JK reports grants from Novartis, Miltenyi Biotech, and Gadeta. Is inventor on multiple patents dealing with γδ T-cell research, ligands, and isolation techniques, and is scientific co-founder and shareholder of Gadeta. (Patent number: 9546998, 9891211, 10324083, 10578609. Publication number: 20200368278, 20200363397, 20190271688, 2019020961, 201901692603, 20180188234, 20170319674, 20170174741, 20150050670).

Figures

Figure 1.
Figure 1.. Study protocol timeline and patient characteristics.
(A) Summary figure depicting the study time line of every patient. Patients are centered by start of 2H2O labeling. The left bar indicates the time between the autologous hematopoietic stem cell transplantation (autoHSCT) and the start of the labeling period, the gray area indicates the 6 weeks 2H2O labeling period, the right bar provides the follow-up period, and the vertical bars indicate the blood sampling time points. (B) Patient characteristics. Age=age at start 2H2O labeling; M=male; F=female; Time post-HSCT=reconstitution period at start 2H2O labeling; Medication usage=medication during the study; HOVON 132 arm A (Idarubicin, Ara-C (Cytarabine), Daunorubicin); VCD (Bortezomib, Cyclophosphamide, Dexamethason); VMP (Bortezomib, Melphalan, Prednisone); VRD (Bortezomib, lenalidomide, dexamethasone); R-CHOP (Rituximab, Cyclophosphamide, Adriamycin, Vincristin, Prednisone); Ara-C (Cytarabine), TAD (Thalidomide, Adriamycin, Dexamethasone); CTD (Carfilzomib, Thalidomide, Dexamethasone); BEAM (Carmustine, Etoposide, Ara-C [Cytarabine], Melphalan). Figure 1—figure supplement 1 shows the absolute leukocytes, neutrophils, lymphocytes, and monocytes numbers over time after autoHSCT.
Figure 1—figure supplement 1.
Figure 1—figure supplement 1.. Absolute numbers (cells × 109 per liter of blood) of leukocytes, neutrophils, lymphocytes, and monocytes in peripheral blood of autologous hematopoietic stem cell transplantation (autoHSCT) patients (patients A–F) over time after autoHSCT obtained by automated blood leukocyte differential count (leukodiff).
Gray areas show the range of healthy individuals’ values.
Figure 2.
Figure 2.. Plasma levels of CRP, APRIL, FAS-L, IL-7, IL-15, and IL-8 post-autologous hematopoietic stem cell transplantation (autoHSCT).
Plasma concentration (picogram per milliliter) of CRP (C-reactive protein), APRIL (A proliferation-inducing ligand), FAS-L (FAS ligand), IL-7 (Interleukin 7), IL-15 (Interleukin 15), and IL-8 (Interleukin 8) in patients A–F at different time points after autoHSCT. Box plots represent the distribution of values for healthy controls (n = 29, box = 25th to 75th percentile, black line=median, whiskers=min and max values). IL-7 levels which were below the level of detection (1.3 pg/ml) were set at 1. Figure 2—source data 1 shows the individual values of the different plasma markers.
Figure 3.
Figure 3.. T-cell reconstitution following autologous hematopoietic stem cell transplantation (autoHSCT).
Absolute numbers (cells per milliliter) of (A) total CD3+ T-cells, (B) total, naive (CD27+CD45RO-) and memory (CD45RO+) CD3+CD4+ T-cells, (D) total, naive (CD27+CD45RO-) and memory (CD45RO+) CD3+CD8+ T-cells, and (C) the CD4:CD8 ratio over time for the duration of the study are depicted. Box plots represent the distribution of values for healthy controls (HCs) (N = 17 for CD3+, CD4+, CD8+, and CD4:CD8 ratio, other N = 27, box = 25th to 75th percentile, black line=median, whiskers=min and max values). Absolute numbers shown in the graph are not normalized. (E) Bar graphs show the median percentage of naive (CD27+CD45RO-), central memory (CM, CD27-CD45RO+), effector memory (EM, CD27+CD45RO+), and effector (CD27-CD45RO-) CD4+ and CD8+ T-cells of autoHSCT patients (A–F) and HCs (n = 6) in the indicated colors. For the T-cell subset distribution per patient over time, see Figure 3—figure supplement 1 and Figure 3—source data 1. For the gating strategy, see Figure 3—figure supplement 2.
Figure 3—figure supplement 1.
Figure 3—figure supplement 1.. T-cell subset distribution per autologous hematopoietic stem cell transplantation (autoHSCT) patient over time.
Percentage of naive T-cells (blue), central memory T-cells (CM, orange), effector memory T-cells (EM, green), and effector T-cells (effector gray) within (A) CD4+ or (B) CD8+ T-cells at the study times after autoHSCT (patients A–F). Bar graphs for healthy controls (N = 6) show the median percentage of naive, CM, EM, and effector T-cells within CD4+ or CD8+ T-cells.
Figure 3—figure supplement 2.
Figure 3—figure supplement 2.. Gating strategy for TruCount analysis and cell sorting.
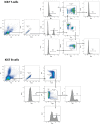
(A) Trucount gating strategy for naive (CD27+CD45RO-), central memory (CM, CD27-CD45RO+), effector memory (EM, CD27+CD45RO+), and effector (CD27-CD45RO-) CD4+ and CD8+ T-cells and B-cells. (B) Gating strategy for sorting for naive (CD27+CD45RO-) and memory (CD45RO+) CD4+ and CD8+ T-cells and for naive (IgM+CD27-), Ig class-switched memory (IgM-CD27+), and IgM+ memory (IgM+CD27+) B-cells.
Figure 3—figure supplement 3.
Figure 3—figure supplement 3.. Total daily production of T- and B-cell subsets, calculated as average production rate (σN +pN )× (absolute number of cells per liter of blood) × (five liter blood) × 50, assuming that 2% of lymphocytes reside in the blood (Ponchel et al., 2011).
Horizontal lines represent median values. p-values of differences between groups are shown (Mann–Whitney test).
Figure 4.
Figure 4.. T-cell dynamics after autologous hematopoietic stem cell transplantation (autoHSCT).
(A) Deuterium enrichment in the DNA of naive and memory CD4+ and CD8+ T-cells in autoHSCT patients (A–F, color symbols) and healthy controls (HCs, gray symbols) (Westera et al., 2015). Dotted lines correspond to the end of the labeling period (black for autoHSCT patients and gray for HCs). Label enrichment was scaled between 0% and 100% by normalizing for the maximum enrichment in granulocytes (see Figure 4—figure supplement 1 and Figure 4—source data 1). (B) Estimates of the per cell production rate of naive and memory CD4+ and CD8+ T-cells in autoHSCT patients and HCs (Westera et al., 2015) (for individual fits and parameters estimates, see Figure 4—figure supplement 2 and Figure 4—source data 2). Different symbols indicate different individuals, autoHSCT patients (A–F) in color, and HCs in gray. Horizontal lines represent median values. p-values between groups are shown (Mann–Whitney test). For information on modeling in R, see Figure 4—source data 1.
Figure 4—figure supplement 1.
Figure 4—figure supplement 1.. Best fits of 2H enrichment in (A) body water (urine) and (B) granulocytes from the six autologous hematopoietic stem cell transplantation (autoHSCT) patients (A–F).
The estimated parameters for urine and granulocytes can be found in Figure 4—source data 1.
Figure 4—figure supplement 2.
Figure 4—figure supplement 2.. Best fits of 2H enrichment in T-cell subsets in autologous hematopoietic stem cell transplantation (autoHSCT) patients.
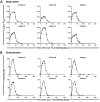
Best fits of the model (see Materials and methods) to the enrichment data in naive and memory CD4+ and CD8+ T-cells in the six autoHSCT patients (A–F). Measured enrichments are shown by black dots. Label enrichment in the DNA was scaled between 0% and 100% by normalizing for the maximum enrichment in granulocytes (see Materials and methods). The end of 2H2O administration is marked by a dashed vertical line. Best fits of 2H enrichment of the corresponding subsets in healthy individuals were previously published by Westera et al., 2015.
Figure 5.
Figure 5.. Contribution of peripheral proliferation and thymic output to T-cell production after autologous hematopoietic stem cell transplantation (autoHSCT).
(A) Ki-67 expression was measured within naive and memory CD4+ (left panel) and CD8+ (right panel) T-cell in autoHSCT patients and healthy controls (HCs) (Westera et al., 2015) (for gating strategy, see Figure 5—figure supplement 1). (B) Average number of T-cell receptor excision circles (TRECs) per naive CD4+ (left panel) and CD8+ (right panel) T-cell in autoHSCT patients, cord blood (CB), and HCs (Westera et al., 2015). For Patient A and Patient E, TREC content was measured the first day of the study (t0) as well as the last study visit (tend). For Patient D, TREC content was not successfully measured due to limited material. (C) CD31 expression was measured within naive CD4+ T-cells in autoHSCT patients, CB, and HCs (Westera et al., 2015). For changes in CD31 expression and absolute numbers of CD31+ cells over time, see Figure 5—figure supplement 2. Different symbols indicate different individuals, autoHSCT patients (A–F) in color, CB in dark gray, and young (median age of 23 years) and old (median age of 68 years) HCs in light gray. Horizontal lines represent median values. p-values of differences between groups are shown (Mann–Whitney test [A] and Kruskal–Wallis with Dunn’s correction [B], comparison with CB, HC [23], and HC [68]).
Figure 5—figure supplement 1.
Figure 5—figure supplement 1.. Gating strategy for Ki-67 expression of T- and B-cell subsets.
Gating strategy for Ki-67 expression of naive (CD27+CD45RO-) and memory (CD45RO+) CD4+ and CD8+ T-cells and naive (IgM+CD27-), Ig class-switched memory (IgM-CD27+) and IgM+ memory (IgM+CD27+) B-cells.
Figure 5—figure supplement 2.
Figure 5—figure supplement 2.. CD31CD4+ T cell numbers and percentage over time.
Absolute numbers of CD31+ naive CD4+ T-cells per milliliter of blood over time (left panel) and percentage CD31+ cells within naive CD4+ T-cells (right panel). Graphs show the absolute cell counts per milliliter or the percentage CD31+ cells in autologous hematopoietic stem cell transplantation (autoHSCT) patients (patients A–F, in color) over time for the duration of the study. Box plots represent the distribution of values for healthy controls (N = 23, box = 25th to 75th percentile, black line=median, whiskers=min and max values). Absolute numbers shown in the graph are not normalized.
Figure 6.
Figure 6.. B-cell reconstitution following autologous hematopoietic stem cell transplantation (autoHSCT).
(A) Absolute numbers (cells per milliliter) of total CD19+ B-cells, naive (CD19+IgM+CD27-), Ig class-switched memory (CD19+IgM-CD27+), and IgM+ memory (CD19+IgM+CD27+) B-cells in peripheral blood over time. Graphs show the absolute cell counts per milliliter in autoHSCT patients (patients A–F) over the duration of the study. Box plots represent the distribution of values for healthy controls (HCs) (N = 10, box = 25th to 75th percentile, black line=median, whiskers=min and max values). Absolute numbers shown in the graph are not normalized. (B) Bar graphs show the median percentage of naive, Ig class-switched memory, and IgM+ memory B-cells within total CD19+ B-cells of autoHSCT patients (patients A–F) and HCs (N = 10). For the B-cell subset distribution per patient over time, see Figure 6—figure supplement 1 and Figure 6—source data 1. Note the different y-axes in panel A.
Figure 6—figure supplement 1.
Figure 6—figure supplement 1.. B-cell subset distribution per autologous hematopoietic stem cell transplantation (autoHSCT) patient over time.
Percentage of naive B-cells (blue), IgM+ memory B-cells (orange), and Ig class-switched memory B-cells (green) within total CD19+ B-cells per patient (patients A–F) at the study times after autoHSCT. Bar graphs for healthy controls show the median percentage of naive, memory, and natural effector B-cells within total CD19+ B-cells. For the gating strategy, see Figure 3—figure supplement 1.
Figure 7.
Figure 7.. B-cell dynamics after autologous hematopoietic stem cell transplantation (autoHSCT).
(A) Deuterium enrichment in the DNA of B-cell subsets in autoHSCT patients (A–F, color symbols) and healthy controls (HCs) (gray symbols) (Westera et al., 2015). Dotted lines correspond to the end of the labeling period (black for autoHSCT patients and gray for HCs). Label enrichment was scaled between 0% and 100% by normalizing for the maximum enrichment in granulocytes (Figure 4—source data 1). (B) Estimates of the per cell production rates of naive, Ig class-switched memory, and IgM+ memory B-cells in autoHSCT patients and HCs (Westera et al., 2015). For individual fits and estimates, see Figure 7—figure supplement 1 and Figure 7—source data 1. (C) Ki-67 expression was measured within naive, Ig class-switched memory, and IgM+ memory B-cells in autoHSCT patients and HCs (Westera et al., 2015) (for gating strategy, see Figure 5—figure supplement 1). (D) Percentage of naive B-cells containing a KREC and naive B-cell division history for autoHSCT patients and HCs (Westera et al., 2015). Different symbols indicate different individuals, autoHSCT patients (A–F) in color and HCs in gray. Horizontal lines represent median values. p-values of differences between groups are shown (Mann–Whitney test). For information on modeling in R, see Figure 4—source code 1.
Figure 7—figure supplement 1.
Figure 7—figure supplement 1.. Best fits of 2H enrichment in B-cell subsets in autologous hematopoietic stem cell transplantation (autoHSCT) patients.
Best fits of the model (see Materials and methods) to the enrichment data in naive, Ig class-switched memory and IgM+ memory B-cells in the six autoHSCT patients (A–F). Measured enrichments are shown by black dots. Label enrichment in the DNA was scaled between 0% and 100% by normalizing for the maximum enrichment in granulocytes (see Materials and methods). The end of 2H2O administration is marked by a dashed vertical line. Best fits of 2H enrichment of the corresponding subsets in healthy individuals were previously published by Westera et al., 2015.
Figure 8.
Figure 8.. Average T- and B-cell loss rates following autologous hematopoietic stem cell transplantation (autoHSCT).
(A) Estimates of the average loss rates of naive and memory CD4+ and CD8+ T-cells and of (B) naive, Ig class-switched memory and IgM+ memory B-cells in autoHSCT patients (A–F, color symbols) and healthy controls (HCs; gray symbols) (Westera et al., 2015). Average loss rates were calculated (see Figure 8—source data 1) using the estimated average production rates and the corrected cell numbers (Figure 8—figure supplements 1 and 2) as described in Materials and methods. Horizontal lines represent median values. p-values of differences between groups are shown (Mann–Whitney test).
Figure 8—figure supplement 1.
Figure 8—figure supplement 1.. Best fits of T-cell numbers in autologous hematopoietic stem cell transplantation (autoHSCT) patients.
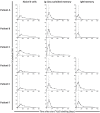
Best fits (black lines) to the normalized cell numbers data (black dots). Absolute numbers (cells per milliliter of blood) of naive (CD27+CD45RO-) and memory (CD45RO+) CD4+ and CD8+ T-cells were corrected for noise as described in Materials and methods. The median cell numbers (dotted gray line) and the corresponding IQR (interquartile range, gray area) for healthy controls are shown.
Figure 8—figure supplement 2.
Figure 8—figure supplement 2.. Best fits of B-cell numbers in autologous hematopoietic stem cell transplantation (autoHSCT) patients.
Best fits (black lines) to the normalized cell number data (black dots). Absolute numbers (cells per milliliter of blood) of naive (CD19+IgM+CD27-), Ig class-switched memory (CD19+IgM-CD27+), and IgM+ memory (CD19+IgM+CD27+) B-cells were corrected for noise as described in Materials and methods. The median cell numbers (dotted gray line) and the corresponding IQR (interquartile range, gray area) for healthy controls are shown.
Author response image 1.

Similar articles

Cited by

References

    1. Alho AC, Kim HT, Chammas MJ, Reynolds CG, Matos TR, Forcade E, Whangbo J, Nikiforow S, Cutler CS, Koreth J, Ho VT, Armand P, Antin JH, Alyea EP, Lacerda JF, Soiffer RJ, Ritz J. Unbalanced recovery of regulatory and effector T cells after allogeneic stem cell transplantation contributes to chronic GVHD. Blood. 2016;127:646–657. doi: 10.1182/blood-2015-10-672345. - DOI - PMC - PubMed
    1. Avanzini MA, Locatelli F, Dos Santos C, Maccario R, Lenta E, Oliveri M, Giebel S, De Stefano P, Rossi F, Giorgiani G, Amendola G, Telli S, Marconi M. B lymphocyte reconstitution after hematopoietic stem cell transplantation: functional immaturity and slow recovery of memory CD27+ B cells. Experimental Hematology. 2005;33:480–486. doi: 10.1016/j.exphem.2005.01.005. - DOI - PubMed
    1. Barata JT, Durum SK, Seddon B. Flip the coin: il-7 and IL-7R in health and disease. Nature Immunology. 2019;20:1584–1593. doi: 10.1038/s41590-019-0479-x. - DOI - PubMed
    1. Bell EB, Sparshott SM, Drayson MT, Ford WL. The stable and permanent expansion of functional T lymphocytes in athymic nude rats after a single injection of mature T cells. The Journal of Immunology. 1987;139:1379–1384. - PubMed
    1. Bemark M, Holmqvist J, Abrahamsson J, Mellgren K. Translational Mini-Review series on B cell subsets in disease reconstitution after haematopoietic stem cell transplantation - revelation of B cell developmental pathways and lineage phenotypes. Clinical & Experimental Immunology. 2012;167:15–25. doi: 10.1111/j.1365-2249.2011.04469.x. - DOI - PMC - PubMed

Publication types

Grants and funding

The funders had no role in study design, data collection and interpretation, or the decision to submit the work for publication.

LinkOut - more resources