. 2021 Jul 1;29(7):664-678.e6.
doi: 10.1016/j.str.2021.01.003. Epub 2021 Feb 2.

Interplay between hevin, SPARC, and MDGAs: Modulators of neurexin-neuroligin transsynaptic bridges

Affiliations

Interplay between hevin, SPARC, and MDGAs: Modulators of neurexin-neuroligin transsynaptic bridges

Shanghua Fan et al. Structure. .

Abstract

Hevin is secreted by astrocytes and its synaptogenic effects are antagonized by the related protein, SPARC. Hevin stabilizes neurexin-neuroligin transsynaptic bridges in vivo. A third protein, membrane-tethered MDGA, blocks these bridges. Here, we reveal the molecular underpinnings of a regulatory network formed by this trio of proteins. The hevin FS-EC structure differs from SPARC, in that the EC domain appears rearranged around a conserved core. The FS domain is structurally conserved and it houses nanomolar affinity binding sites for neurexin and neuroligin. SPARC also binds neurexin and neuroligin, competing with hevin, so its antagonist action is rooted in its shortened N-terminal region. Strikingly, the hevin FS domain competes with MDGA for an overlapping binding site on neuroligin, while the hevin EC domain binds the extracellular matrix protein collagen (like SPARC), so that this trio of proteins can regulate neurexin-neuroligin transsynaptic bridges and also extracellular matrix interactions, impacting synapse formation and ultimately neural circuits.

Keywords: MDGAs; SPARC; adhesion molecule; hevin; matricellular protein; neurexins; neuroligins; neuropsychiatric disease; protein structure; synaptic organizer.


Conflict of interest statement

Declaration of interests The authors declare no competing interests.

Figures

Figure 1.
Figure 1.. 3D structure of hevin FS-EC.
(A) Domain structure of hevin constructs used in this study. SP, signal peptide; FS, follistatin-like domain; EC, extracellular calcium binding domain. (B) Hevin FS-EC structure. Disulfide bonds are shown as yellow sticks, calcium ions as dark grey balls, and glycan moieties (NAG-NAG) in stick representation. The N- and C- termini are indicated. Dashes indicate a disordered region. (C) Ca2+-binding sites in the EF hands (EF1, left and EF2, right) reveal pentagonal bipyramidal coordination spheres. Ca2+ ions are shown as dark gray spheres and Ca2+-coordinating residues are labeled. The Ca2+-binding site in EF1 is composed of D600, D605 and E612, P603, V607, and a water molecule. The Ca2+-binding site in EF2 is composed of D635, N637, D639, E646, H641, and a water molecule. (D) The interface between the FS (coral) and EC (pink) domains in mol A is stabilized by insertion of the EC domain (pale green) of mol B, in particular Tyr539. (E) Analysis of hevin domains (HV_C2 through HV_C6) by analytical size exclusion chromatography (SEC). Samples were run in duplicate, and the average elution volume (EVs) with standard deviation is listed. Calibration standards, also run in duplo, deviated <0.02 ml between runs. Apparent molecular weights (MWexp) estimated from the elution volumes assuming a globular shape, and the predicted molecular weights based on amino acid composition (MWpredict) are shown. *, sum of the predicted molecular weights for the isolated FS and EC domains. See also Figures S1 and S2.
Figure 2.
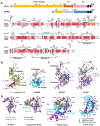
Figure 2.. Hevin and SPARC FS-EC tandems are structurally different.
(A) Domain structure of hevin and SPARC (top). EF-hands are indicated with black rectangles, N-linked glycosylation sites with ‘Y’, and signal peptides with SP. Sequence alignment of the human hevin and human SPARC FS-EC tandems with secondary structure elements indicated (below). Conserved residues are highlighted in red, Ca2+-binding residues are indicated by black triangles, and a conserved N-linked glycosylation site is indicated with a blue triangle. Cysteines participating in disulfide bonds are indicated with numbers 1-7 in green. The hinge between the FS and EC domains is highlighted in yellow. Hevin residues at the FS-EC interface are marked by an asterisk. The region between αA and αBC is disordered in hevin and shown as a dashed green line. In human hevin, the EGF domain spans V430-Q457, and the Kazal domain D458-K510; in mouse hevin, the EGF domain spans A416-Q443, and the Kazal domain D444-K496. (B) Comparison of hevin and SPARC 3D structures. Superposition of hevin mol A (pink/magenta) and mol B (olive/light green) comprising the asymmetric unit (FS in pink or olive, the rest in magenta or light green) (left). Ca2+-ions in hevin mol A and mol B are shown as dark gray and white spheres, respectively. SPARC (PDB: 1BMO) with FS domain in lavender, EF hands in skyblue, and the remainder in cyan (right). Ca2+-ions in SPARC are shown as dark gray spheres. (C) Superposition of hevin (pink) and SPARC (slate blue). Superposition using the FS domain (left) and using the EF-hands (right) of the EC domains. Ca2+-ions are shown as dark gray and light gray spheres in hevin and SPARC, respectively. (D) Comparison of the hevin and SPARC EC subdomain elements. From left to right: EF-hands; EF-hands and their connecting segments (orange or cyan); the EC domains with the ‘variable helices’ in hevin (magenta) and SPARC (cyan); and superposition of the ‘variable helices’ in hevin and SPARC. See also Figures S3 and S4.
Figure 3.
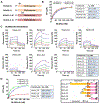
Figure 3.. Hevin interacts with NLGNs.
(A) Extracellular domains of NLGN1 and NLGN2 splice forms used in this study. NLGN2 can accommodate splice insert SSA, while NLGN1 can accommodate SSA and/or SSB. SP, signal peptide. (B) TMR-hevin_C2 (FS-EC tandem) binding to different NLGN splice forms in an FP-assay. Data points represent triplicate measurements with the error bars showing the standard deviations. KD values were averaged over two independent experiments and the standard deviations given (mean ± SD). (C) Binding of soluble hevin fragments to an NLGN2(+A)-coupled sensor by SPR using a concentration series of 0, 250, 500, 1000, 2000 and 4000 nM. Binding curves of hevin_C2, hevin_C3, hevin_C4, hevin_C5, and hevin_C6 were fit to a 1:1 binding model (grey). N1α L1L6 (0–30 nM) was used as a positive control for binding, and n1α L2 (0-50 nM) as a negative control. The KD values were calculated by averaging KD values from two independent experiments (mean ± SD). (D) Comparison of the binding of TMR-hevin_C5 (FS), TMR-hevin_C6 (EC) or TMR-hevin_C2 (FS-EC) to NLGN2(+A) in an FP-assay. Data points represent triplicate measurements with the error bars showing the standard deviations. KD values were averaged over two independent experiments and the standard deviations given. Legend (bottom right): hevin constructs used for the binding studies. See also Figures S1.
Figure 4.
Figure 4.. Hevin interacts with neurexin 1α.
(A) Domain structure of neurexin 1α (n1α) and neurexin 1β (n1β). Signal peptides (SP), transmembrane segments (tms), and splice inserts (SS1-SS6) are indicated. (B) Binding of TMR-hevin_C5(FS) to n1α L1L6 and fragments (n1α L1L5, n1α L5L6, and n1α L2L3) in presence of Ca2+ (solid symbols, solid lines) or 10 mM EGTA (open symbols, dotted lines) in an FP-assay. The change in fluorescence polarization is shown on the left, and the total fluorescence intensity to monitor any general increase is shown on the right. (C) Binding of NLGN2(+A) to TMR-hevin_C5 pre-incubated with n1α L5L6 or n1α L2L3 in presence and absence of Ca2+ in an FP-assay. (D) Binding of NLGN1(−A, +B) to TMR-hevin_C5 pre-incubated with n1α L5L6 or n1α L2L3 in presence and absence of Ca2+ in an FP-assay. Data points in B, C and D represent triplicate measurements with the error bars representing their standard deviations. FP signal shown left, the total fluorescent intensity as a control for spurious increases is shown right. Data presented in B, C and D are representative of at least two independent experiments. See also Figures S1.
Figure 5.
Figure 5.. SPARC interacts with NLGNs and neurexin 1α.
(A) Human SPARC constructs used in this study. (B) Binding of TMR-SPARC_C1, TMR-SPARC_C2, and TMR-hevin_C2 bind to NLGN2(+A) in an FP-assay. The KD values averaged over two independent experiments with standard deviations are listed. Note: differences in the shape and size between the three proteins, impacting their tumbling properties, likely result in differences in the efficiency of the FP signal. (C) Binding of SPARC_C1 and SPARC_C2 to an NLGN2(+A)-coupled sensor by SPR using a concentration series of 0, 31.25, 62.5, 125, 250, 500, 1000, 2000, and 4000 nM. Binding curves of SPARC_C1 and SPARC_C2 were fit to a 1:1 binding model (grey). The calculated KD values averaged over two independent experiments with standard deviations are listed. (D) Disruption of the TMR-hevin_C5(FS):NLGN2(+A) complex by increasing amounts of unlabeled hevin_C2 (red), SPARC_C1 (green) or SPARC_C2 (blue) in an FP-assay. (E) TMR-SPARC_C1 binding to n1α L1L6 and fragments (n1α L1L5, n1α L5L6 and n1α L2L3) in presence of Ca2+ (solid symbols, solid lines) or 10 mM EGTA (open symbols, dotted lines) in an FP-assay. Data points in B, D and E represent triplicate measurements with the error bars representing their standard deviations. Data presented here is representative of at least two independent experiments. See also Figures S1.
Figure 6.
Figure 6.. Hevin FS domain and MDGA1 Ig1 share overlapping binding sites on NLGN2
(A) Solvent-accessible surface of the NLGN2 dimer (monomers in slate blue and light green; PDB: 5v5v). The MDGA1 Ig1-Ig2 binding site on NLGN2 is shown with dark blue dotted perimeter, the neurexin 1β (n1β) binding site of NLGN1 mapped onto NLGN2 is shown with a dark green dotted perimeter (PDB: 5OJ6). The surface region of NLGN2 that binds both MDGA1 Ig1 and n1β is shown in cyan, while that binding only MDGA1 is shown in dark blue and that binding only n1β is shown in green. Binding sites are defined as residues located within 5 Å of the contacting partner. Domain schematics for MDGAs are shown upper right side, and NLGN2 mutants used in this study are mapped onto the surface in yellow, see table lower right side. (B) TMR-hevin_C5 (FS) binding to a panel of NLGN2 mutants in an FP-assay. (C) Disruption of the TMR-hevin_C5(FS):NLGN2 complex by increasing amounts of MDGA1 Ig1-Ig2 (MDGA1_C8; green) or mutant MDGA1 Ig1-Ig2 (MDGA1_C8_Mut4; R105A, Y107A, R123A, F154A, R156A, Y187A; blue) in an FP-based competition study. Data points in B and C represent triplicates, and error bars indicate their standard deviations. Data presented here is representative of at least two independent experiments. See also Figures S1.
Figure 7.
Figure 7.. Hevin binds collagen V.
(A) Residues in SPARC that bind a collagen III tri-peptide (interaction distances < 5 Å; PDB: 2v53) are indicated with cyan triangles in a sequence alignment of human hevin and human SPARC; those forming a pocket for collagen III F23 (see B) are further underlined in red. A deletion in SPARC activates collagen binding, shown in green (used for PDB: 2v53 and 1nub). (B) Binding site in SPARC (green/cyan) for a collagen III tri-peptide (red) (PDB: 2v53). A zoom-in shows key residues that form a pocket around F23 from the trailing chain of the collagen III tri-peptide, including F163, R166, M167, W170, L259 and E263 (numbered F146, R149, M150, W153, L242 and E246 in PDB: 2v53). (C) Hevin counterpart of the SPARC/collagen-interaction site with corresponding zoom-in. (D) Superposition of the FS-EC tandem from hevin (pink), the collagen-bound form (green, PDB: 2v53), and the collagen-free form of SPARC (slate blue, PDB: 1nub) using the EC domain. (E) Interaction of the hevin FS domain (TMR-hevin_C5) or EC domain (TMR-hevin_C6) to human collagen V in presence of 2 mM Ca2+ (solid lines) or 10 mM EGTA (dotted lines) in a FP assay. Data points represent triplicates, and error bars indicate their standard deviations. Data presented here is representative of at least two independent experiments. (F) Binding of the hevin EC domain (hevin_C6) to a human collagen V-coupled sensor by SPR using a concentration series of 0, 1, 2, 4, 8, and 16 μM. Binding curves were fit to a 1:1 binding model (grey). Data presented here is representative of at least two independent experiments. (G) Comparison of the FS domain from hevin (pink) and SPARC (light green) (PDB: 1nub) with an integrin binding site in SPARC shown in dark blue. See also Figures S3.
Figure 8.
Figure 8.. Network of proteins regulating the trans-synaptic neurexin-neuroligin bridge.
(A) Positive and negative regulators of neurexin-neuroligin trans-synaptic bridges. (B) Regulators of the neurexin-neuroligin trans-synaptic bridge compete for overlapping binding sites. (ECM, extracellular matrix).

Comment in

Similar articles

Cited by

References

    1. Albrecht D, López-Murcia FJ, Pérez-González AP, Lichtner G, Solsona C, and Llobet A (2012). SPARC prevents maturation of cholinergic presynaptic terminals. Mol. Cell. Neurosci 49, 364–374. - PubMed
    1. Allen NJ, and Eroglu C (2017). Cell Biology of Astrocyte-Synapse Interactions. Neuron 96, 697–708. - PMC - PubMed
    1. Bemben MA, Shipman SL, Nicoll RA, and Roche KW (2015). The cellular and molecular landscape of neuroligins. Trends Neurosci. 38, 496–505. - PMC - PubMed
    1. Bradshaw AD (2009). The role of SPARC in extracellular matrix assembly. Journal of Cell Communication and Signaling 3, 239–246. - PMC - PubMed
    1. Bradshaw AD (2012). Diverse biological functions of the SPARC family of proteins. Int. J. Biochem. Cell Biol 44, 480–488. - PMC - PubMed

Publication types

MeSH terms

LinkOut - more resources