. 2021 Apr;70(4):903-916.
doi: 10.2337/db20-0599. Epub 2021 Feb 1.

Cell Cycle Regulation of the Pdx1 Transcription Factor in Developing Pancreas and Insulin-Producing β-Cells

Affiliations

Cell Cycle Regulation of the Pdx1 Transcription Factor in Developing Pancreas and Insulin-Producing β-Cells

Xiaodong Zhu et al. Diabetes. 2021 Apr.

Abstract

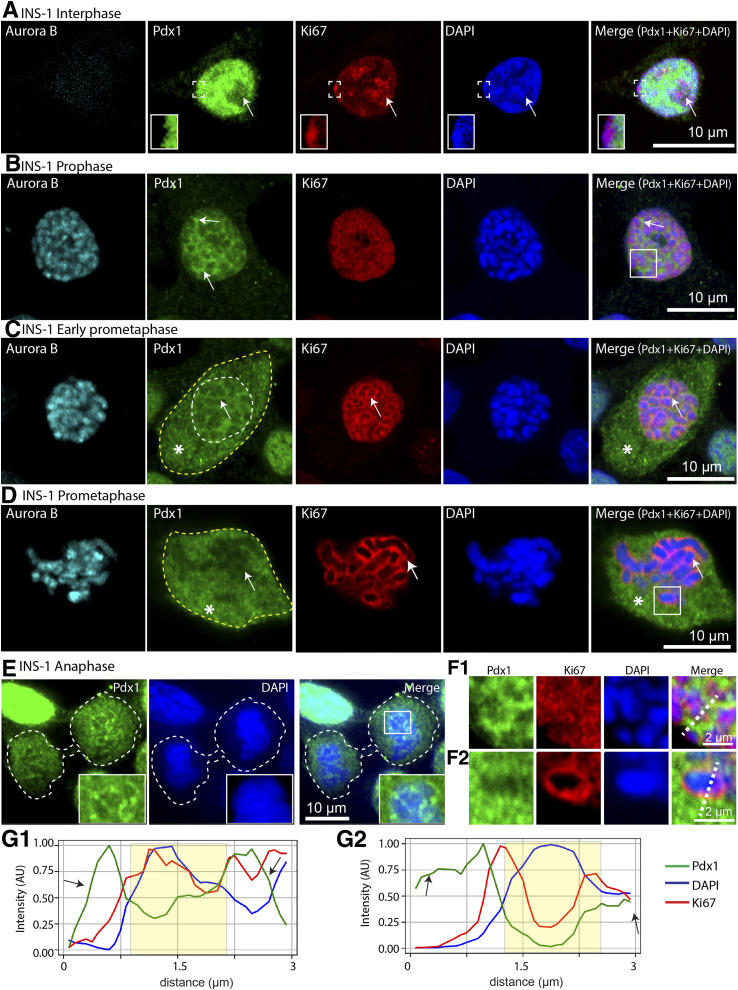
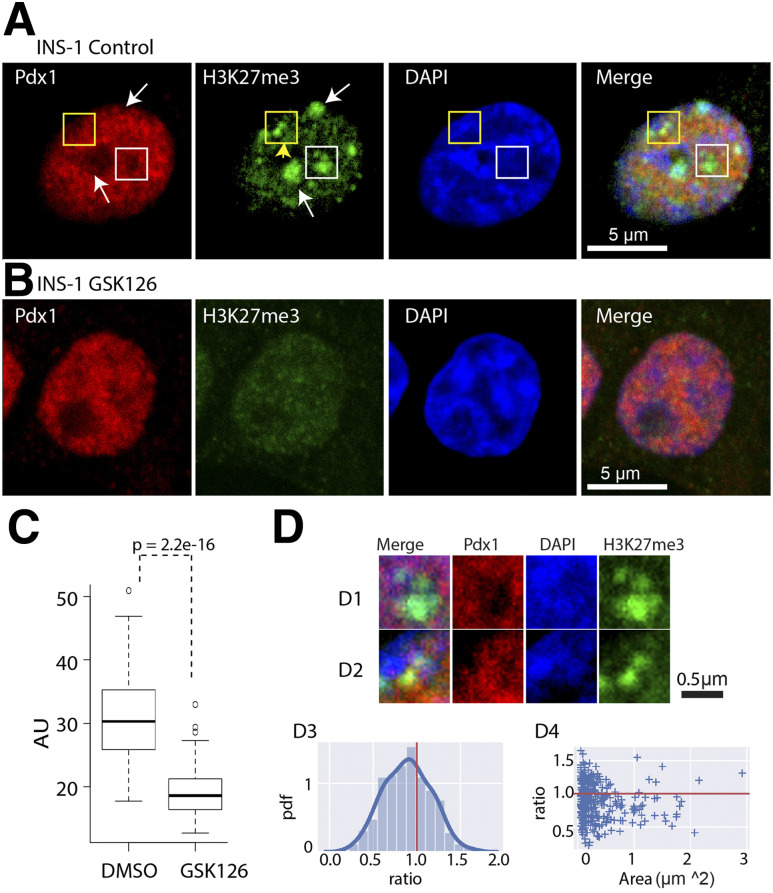
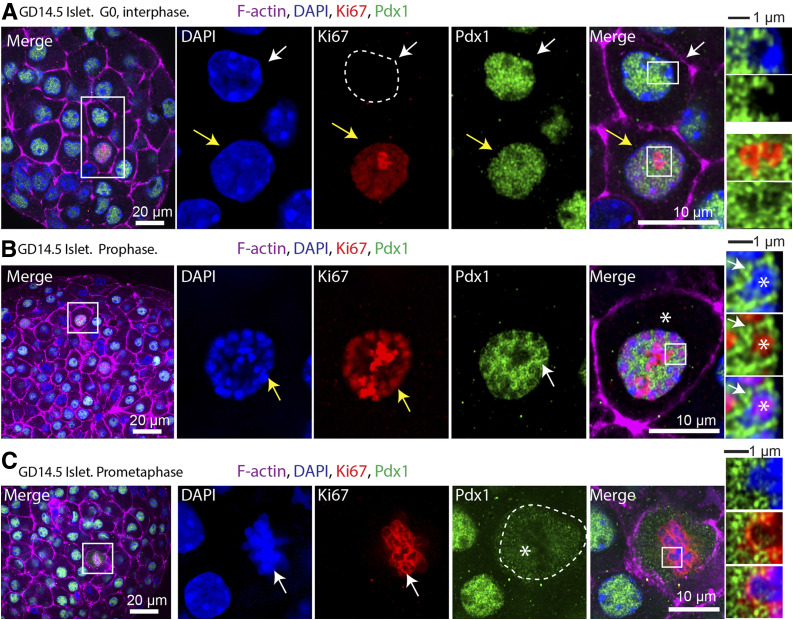
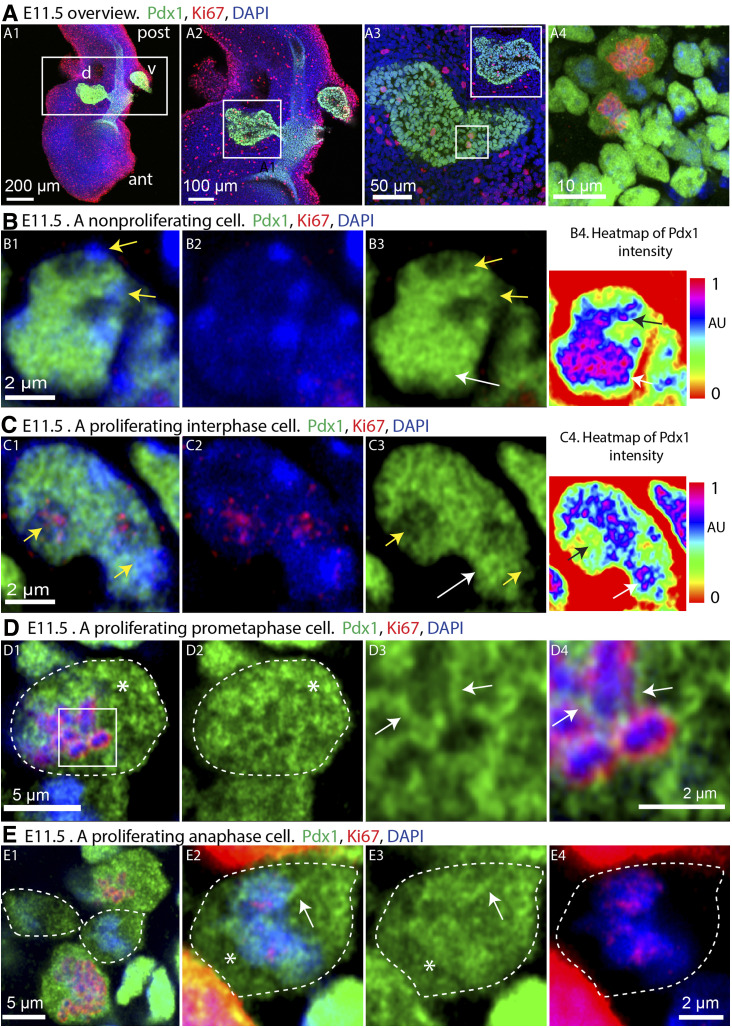
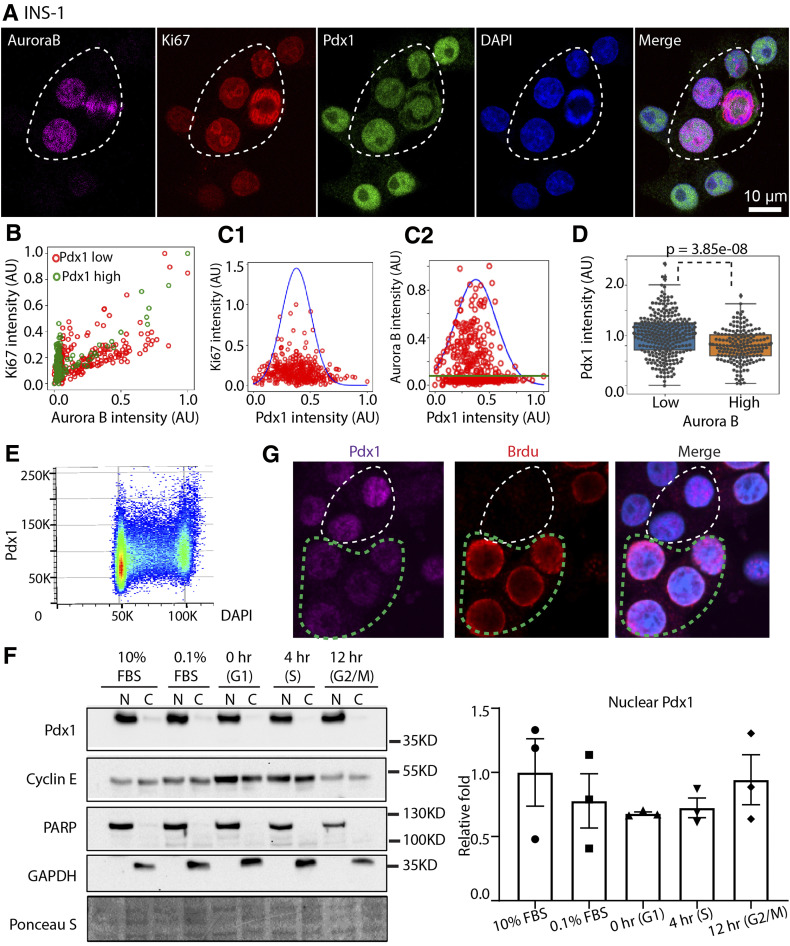
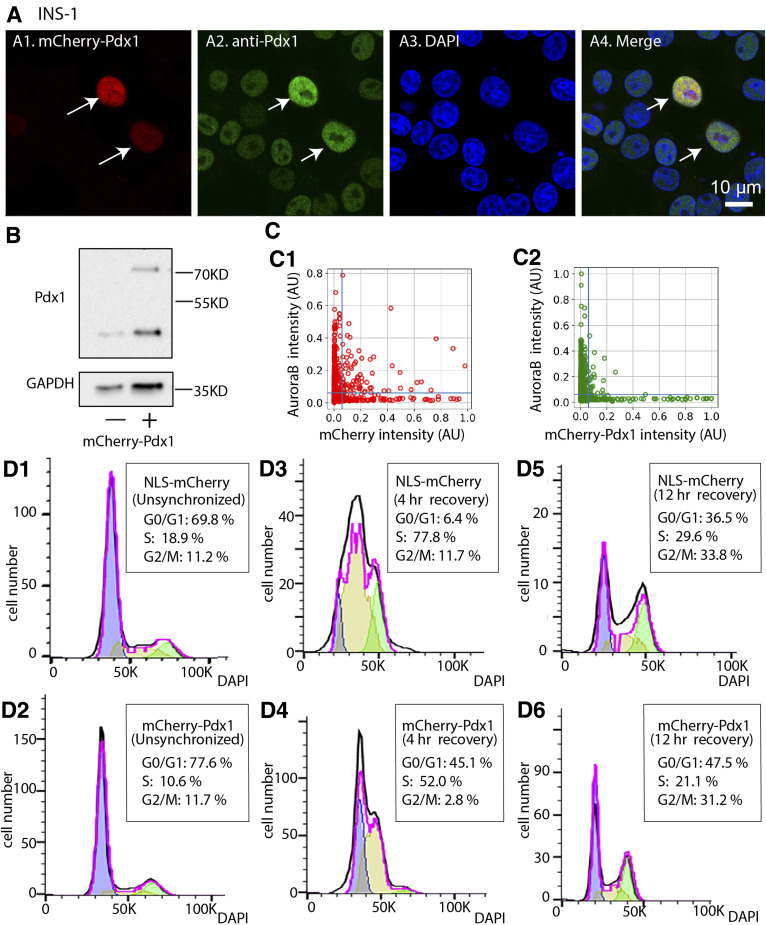
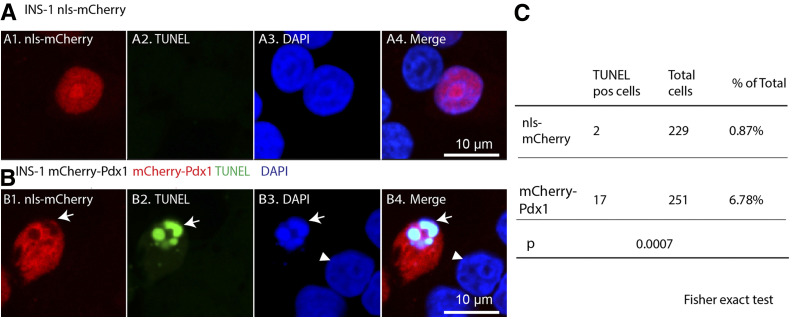
Current evidence indicates that proliferating β-cells express lower levels of some functional cell identity genes, suggesting that proliferating cells are not optimally functional. Pdx1 is important for β-cell specification, function, and proliferation and is mutated in monogenic forms of diabetes. However, its regulation during the cell cycle is unknown. Here we examined Pdx1 protein expression in immortalized β-cells, maternal mouse islets during pregnancy, and mouse embryonic pancreas. We demonstrate that Pdx1 localization and protein levels are highly dynamic. In nonmitotic cells, Pdx1 is not observed in constitutive heterochromatin, nucleoli, or most areas containing repressive epigenetic marks. At prophase, Pdx1 is enriched around the chromosomes before Ki67 coating of the chromosome surface. Pdx1 uniformly localizes in the cytoplasm at prometaphase and becomes enriched around the chromosomes again at the end of cell division, before nuclear envelope formation. Cells in S phase have lower Pdx1 levels than cells at earlier cell cycle stages, and overexpression of Pdx1 in INS-1 cells prevents progression toward G2, suggesting that cell cycle-dependent regulation of Pdx1 is required for completion of mitosis. Together, we find that Pdx1 localization and protein levels are tightly regulated throughout the cell cycle. This dynamic regulation has implications for the dichotomous role of Pdx1 in β-cell function and proliferation.


Figures

Figure 1
Figure 1
Pdx1 exhibits specific localization at different cell cycle stages in INS-1 cells. Confocal images of immunolabeled INS-1 cells showing Pdx1 (green), Ki67 (red), Aurora B (cyan), and DAPI (blue) at different stages of the cell cycle. A: At interphase, Pdx1 is excluded from regions containing nucleoli (dark Ki67 labeling, arrow) and heterochromatin. This is better appreciated in the enlarged region indicated by the white box in each image. Aurora B kinase expression is not expressed at this stage. B: At prophase, Pdx1 is enriched around chromosomes (arrow). Ki67 is associated with the chromosomes. Aurora B is expressed at this stage and also remains associated with the chromosomes. The region in the white box is enlarged in F1. C: At early prometaphase, Pdx1 still surrounds the chromosomes (arrow) despite the nuclear envelope having broken down (white dashed line, outlining the former nucleus border within which the chromosomes are still localized). Pdx1 is also found in the cytoplasm beginning at this stage (asterisk). Ki67 localizes to the chromosome periphery compartments. The yellow dashed line outlines the cell boundary. D: At later prometaphase, Pdx1 is localized throughout the cytoplasm (asterisk), and is no longer observed surrounding the chromosomes. Ki67 encapsulates the chromosomes (arrow). The yellow dashed line outlines the cell boundary. The region in the white box is enlarged in F2. E: At anaphase, Pdx1 can once again be detected adjacent to the decondensed chromosomes. The region in the white box is enlarged in the inset. F: Enlarged images from B (F1) and D (F2). White dashed lines indicate region used for intensity line scans. F1: Pdx1 intensity peaks flank the intensity peaks of Ki67 and DAPI. F2: The local minima of both Pdx1 and Ki67 intensity is at the maxima of the DAPI intensity. However, there is no strong peak of Pdx1 intensity when compared with Ki67. G: Intensity line scans from dashed regions in F1 (G1) and F2 (G2). The yellow shaded region indicates the localization of the DNA/chromosomes.
Figure 2
Figure 2
Lower levels of Pdx1 are observed at a majority of transcriptionally repressed regions. Immunolabeling of INS-1 cells treated with DMSO (control) (A) or a histone methyltransferase inhibitor (GSK126) (B). Cells are labeled for Pdx1 (red), H3K27me3 (green), and DAPI (blue). A: Pdx1 is excluded from most of the regions with strong H3K27me3 signal (white arrows, white box). In some regions with strong H3K27me3 signal, there is still Pdx1 signal (yellow box). The regions in the white and yellow boxes are enlarged in D. B: As expected, GSK126 treatment significantly decreased the labeling of intensity of H3K27me3. C: H3K27me3 intensity in cells treated with DMSO and GSK126 is plotted. Corresponding images are shown in A. For DMSO treatment, n = 85 cells; for GSK126 treatment, n = 108 cells; P = 2.2e−16. D1: Higher magnification image from the white box in A. Pdx1 is not at the H3K27me3+ region. D2: Higher magnification image from the yellow box in A. Pdx1 can be detected at the H3K27me3+ region. D3: Normalized histogram of the ratio of Pdx1 intensity at H3K27me3+ regions to the Pdx1 intensity at other areas within the nucleus. Blue curve shows the estimated probability density function; red vertical line is at the position where ratio = 1, indicating Pdx1 intensity at H3K27me3+ regions is similar to that at H3K27me3 regions. D4: Scattered plot shows Pdx1 intensity at H3K27me3+ regions vs. the area. Each + indicates one region positive for the H3K27me3 label.
Figure 3
Figure 3
Pdx1 exhibits cell cycle stage–dependent localization in proliferating cells from GD14.5 maternal mouse β-cells. Confocal images of whole-mount immunofluorescence-labeled islets isolated from pregnant female mice at GD14.5, the peak of maternal β-cell proliferation. Pdx1 (green), Ki67 (red), DAPI (blue), and F-actin (magenta). A: The white box in the far-left panel highlights two β-cells, one proliferating and one not. The nonproliferating β-cell is Ki67 (top, white arrow), and the proliferating β-cell is Ki67+ (bottom, yellow arrow). Pdx1 is excluded from the regions of heterochromatin (strong DAPI signal). This is better appreciated in the enlarged region indicated by the upper white box in the merged image and shown in the two panels to the far upper right. Likewise, Pdx1 is excluded from nucleoli (strong Ki67 signal). This is better appreciated in the enlarged region indicated by the lower white box in the merged image and shown in the two panels to the far lower right. B: A β-cell in prophase is highlighted in the white box in the far left panel. At this stage, Pdx1 is enriched around the DNA (white arrow). Ki67 is at the chromosomes (yellow arrows). The region in the white box in the merged image is enlarged in the panels at the far right. Ki67 colocalizes with the DNA, whereas Pdx1 surrounds the Ki67-coated chromosomes. C: A β-cell in prometaphase is highlighted in the white box in the far-left panel. Pdx1 is localized throughout the cytoplasm at this stage. K67 localizes to the surfaces of the chromosomes, forming the chromosome periphery compartments (white arrows). The region in the white box in the merged image is enlarged in the panels at the far right. Pdx1 is enriched along the chromosomes. Instead, Ki67 coats the surface of the chromosomes.
Figure 4
Figure 4
Pdx1 exhibits different localization patterns at different cell cycle stages in E 11.5 pancreatic progenitors. Confocal images of whole-mount immunofluorescence-labeled posterior foregut isolated from mouse embryo at E 11.5. Pdx1 (green) labels the multipotent pancreatic progenitors in the dorsal (d) and ventral pancreatic buds (v), Ki67 (red), DAPI (blue). A1–4: Images of the E 11.5 embryonic tissue at increasing resolution (ant, anterior; post, posterior). The region in the white box in A1 is enlarged in A2. The dorsal bud region in the white box in A2 is enlarged in A3. A3: Maxi-projection of two successive images of the dorsal pancreatic bud 50 μm above the image in A2. The inserted image is at the same focal plane as the one in A2. A4: Maxi-projection of 25 successive Airyscan images from the region in the white box in A3. BE: Airyscan images from cells enlarged in A4. Yellow arrows show regions of low Pdx1 intensity. White arrows show region of high Pdx1 intensity. B: A Ki67 nonproliferating cell (B1–3). B4: Intensity-based heatmap of Pdx1 protein levels. Pdx1 does not localize to regions of heterochromatin. C1–3: A proliferating interphase cell. C4: The intensity-based heatmap of Pdx1. Pdx1 does not localize to the Ki67-enriched regions (yellow arrows). D1–4: A proliferating prometaphase cell (upper Ki67+ cell in A4 and E1). The boundaries of the cell are outlined in a dotted white line. Pdx1 is distributed in the cytoplasm at this cytoplasm (asterisks). The region in the white box in D1 is enlarged in D3 and D4. Pdx1 (white arrows) can be observed enriched in regions close to the condensed chromosomes, which are encapsulated by Ki67. E1: Enlarged image of the two Ki67+ cells in anaphase stage in A4. The boundary of the anaphase cell is outlined in the dotted white line. E2–4: A daughter cell in E1 is enlarged. The boundaries of one daughter cell are outlined in the dotted white lines. Pdx1 is localized throughout the cytoplasm (asterisk). Pdx1 can be observed enriched around the decondensing chromosomes.
Figure 5
Figure 5
Pdx1 levels converge to a narrow range in S phase INS-1 cells. A: INS-1 cells were immunolabeled for Aurora B (magenta), Ki67 (red), Pdx1 (green), and DAPI (blue). The four cells within the dashed circle have higher Ki67 and/or Aurora B levels than cells outside this region. Thus, these cells are more advanced in the cell cycle. These four cells also have lower Pdx1 levels. B: Scatter plot of Aurora B protein intensity vs. Ki67 intensity. Each circle represents one cell. Green indicates cells with high Pdx1 intensity; red indicates cells with low Pdx1 intensity. Among cells with high Ki67 and Aurora B, few cells have high Pdx1 levels. C1: Scatter plot of Pdx1 intensity vs. Ki67 intensity. C2: Scatter plot of Pdx1 intensity vs. Aurora B intensity. Each circle represents one cell. Cells with intermediate Pdx1 levels have the highest Aurora B levels. D: Box plot of Pdx1 intensity in cells with two different Aurora B protein intensities. Aurora B high-level cells have lower Pdx1 intensity. E: INS-1 cells immunolabeled for Pdx1 and counterstained with DAPI were evaluated by FACS. Pdx1 levels converge at S phase. F: Western blot analysis of nuclear and cytoplasmic proteins isolated from INS-1 cells synchronized at the G1/S boundary by serum starvation and then released into growth medium for the indicated times (left panel). Proteins were separated by SDS-PAGE and immunoblotted with anti-Pdx1, anti-PARP, anti–cyclin E, and anti-GAPDH antisera. Ponceau S was used to visualize total protein. Pdx1 protein level was normalized to total Ponceau S signal with the level in 10% FBS set to 1 (right panel; n = 3 replicates). G: INS-1 cells synchronized at the G1/S boundary were released into growth medium containing BrdU for 12 h. Cells within the white dashed circle are BrdU and have higher Pdx1 levels than BrdU+ cells within the green dashed circle.
Figure 6
Figure 6
Pdx1 overexpression prevents cell cycle progression. A1–4: INS-1 cells expressing mCherry-Pdx1 (A1, white arrows) were labeled for Pdx1 (A2, green) and DAPI (A3, blue). mCherry-Pdx1 is recognized by the Pdx1 antibody and localized specifically inside the nucleus (A4). B: Western blot analysis of INS-1 cells expressing mCherry-Pdx1, probed for Pdx1 and GAPDH as loading control. C: Scatterplot of Aurora B intensity vs. mCherry intensity in cells expressing the empty mCherry vector (C1) or mCherry-Pdx1 (C2). Few cells expressing mCherry-Pdx1 have high Aurora B levels (area within the blue dashed line). D: FACS analysis of cell cycle progression in NLS-mCherry–expressing cells (D1, D3, and D5) and mCherry-Pdx1–expressing cells (D2, D4, and D5). D1 and D2 are unsynchronized cells, D3 and D4 are 4 h after releasing into growth medium, and D5 and D6 are 12 h after releasing into growth medium. Black lines represent the original experimental data. Purple lines and colored areas are results from Flow Jo cell cycle analysis; light blue areas represent G0/G1, yellow areas represent S, and green areas represent G2/M. Purple lines represent the overall fitted curve. The percentages shown in each plot are the ratio out of G0/G1 + S + G2/M.
Figure 7
Figure 7
β-cells overexpressing Pdx1 show aberrant nuclear morphology. INS-1 cells expressing NLS-mCherry (A) or mCherry-Pdx1 (BD) are labeled with DAPI (blue) and TUNEL (green). A: Normal nuclear morphology in a control cell expressing NLS-mCherry. Both transfected and nontransfected cells are TUNEL. B: A cell expressing mCherry-Pdx1 is TUNEL+, with the condensed and fragmented nuclear morphology (arrow). The neighboring nontransfected cell is TUNEL (arrowhead).

Similar articles

Cited by

References

    1. Dor Y, Brown J, Martinez OI, Melton DA. Adult pancreatic beta-cells are formed by self-duplication rather than stem-cell differentiation. Nature 2004;429:41–46 - PubMed
    1. Ruijtenberg S, van den Heuvel S. Coordinating cell proliferation and differentiation: antagonism between cell cycle regulators and cell type-specific gene expression. Cell Cycle 2016;15:196–212 - PMC - PubMed
    1. Fischer M, Müller GA. Cell cycle transcription control: DREAM/MuvB and RB-E2F complexes. Crit Rev Biochem Mol Biol 2017;52:638–662 - PubMed
    1. Puri S, Roy N, Russ HA, et al. . Replication confers β cell immaturity. Nat Commun 2018;9:485. - PMC - PubMed
    1. Tatsuoka H, Sakamoto S, Yabe D, et al. . Single-cell transcriptome analysis dissects the replicating process of pancreatic beta cells in partial pancreatectomy model. iScience 2020;23:101774. - PMC - PubMed

Publication types