. 2021 Jan 15:11:600254.
doi: 10.3389/fmicb.2020.600254. eCollection 2020.

Addressing Non-linear System Dynamics of Single-Strand RNA Virus-Host Interaction

Affiliations

Addressing Non-linear System Dynamics of Single-Strand RNA Virus-Host Interaction

Alessandra Romano et al. Front Microbiol. .

Abstract

Positive single-strand ribonucleic acid [(+)ssRNA] viruses can cause multiple outbreaks, for which comprehensive tailored therapeutic strategies are still missing. Virus and host cell dynamics are tightly connected, generating a complex dynamics that conveys in virion assembly to ensure virus spread in the body. Starting from the knowledge of relevant processes in (+ss)RNA virus replication, transcription, translation, virions budding and shedding, and their respective energy costs, we built up a systems thinking (ST)-based diagram of the virus-host interaction, comprehensive of stocks, flows, and processes as well-described in literature. In ST approach, stocks and flows are expressed by a proxy of the energy embedded and transmitted, respectively, whereas processes are referred to the energy required for the system functioning. In this perspective, healthiness is just a particular configuration, in which stocks relevant for the system (equivalent but not limited to proteins, RNA, DNA, and all metabolites required for the survival) are constant, and the system behavior is stationary. At time of infection, the presence of additional stocks (e.g., viral protein and RNA and all metabolites required for virion assembly and spread) confers a complex network of feedbacks leading to new configurations, which can evolve to maximize the virions stock, thus changing the system structure, output, and purpose. The dynamic trajectories will evolve to achieve a new stationary status, a phenomenon described in microbiology as integration and symbiosis when the system is resilient enough to the changes, or the system may stop functioning and die. Application of external driving forces, acting on processes, can affect the dynamic trajectories adding a further degree of complexity, which can be captured by ST approach, used to address these new configurations. Investigation of system configurations in response to external driving forces acting is developed by computational analysis based on ST diagrams, with the aim at designing novel therapeutic approaches.

Keywords: RNA-virus; dynamics; evolution trajectories; modeling; simulation – computers; systems thinking (ST); virus–host interaction.


Conflict of interest statement

The authors declare that the research was conducted in the absence of any commercial or financial relationships that could be construed as a potential conflict of interest.

Figures

FIGURE 1
FIGURE 1
The energy systemic diagram of a cell infected by ss+ RNA virus. Stock-flow diagram of the virus–host interaction system. In the upper right box are the meaning of symbols. The color code is as follows: blue for host cell energy stocks and relative inflows and outflows; red for virus energy stocks and relative inflows and outflows; green for external energy inputs and external driving forces F corresponding to different therapeutic strategies. The lower box lists the biological contents of the stocks, all expressed in terms of energy (ATP-equivalent units).
FIGURE 2
FIGURE 2
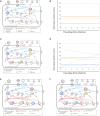
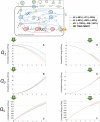
Systems configurations based on initial conditions and effects of external driver forces. In the configuration of initial null viral load (A), the value of stocks Q1, Q2A, and Q2B were constant, and the system behavior was stationary (B), with constant values of all stocks overtime. At time of infection, the network of flows and feedbacks identified a new configuration (C), to generate a not stationary pattern (D), in which stock values change overtime in response to the other elements of the system, which can evolve to maximize the virions’ stock (E). Application of external driving forces, acting on processes (identified by red cross on J5), can reduce the flows and address new configurations (F), identifying leverage points that can be explored at different magnitude and timepoints with a computational simulator.
FIGURE 3
FIGURE 3
Effects of initial viral load on the energy dynamics of a cell infected by a (+)ssRNA virus. Stock values, expressed in ATP-eq (arbitrary units chosen as proxy), are shown from Day 0 though Day 7 as a function of different initial viral loads (indicated at the bottom with different color codes). Evolutionary pattern for each stock was not linear.
FIGURE 4
FIGURE 4
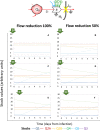
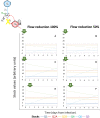
System dynamics of (+)ssRNA virus–host interaction in response to external driving forces applied to reduce virions outflow. Changes over time of the values of each stock of the system diagrammed in Figure 1 (for the color code, see bottom), expressed in ATP-eq, in response to reduction of J50 (flow of energy required for virions budding). Several scenarios are shown: initial viral load 5k and application of full (100%, A) or partial (50%, B) J50 reduction at Day 0; initial viral load 10k and application of full (100%, C) or partial (50%, D) J50 reduction at Day 0; initial viral load 10k and application of full (100%, E) or partial (50%, F) J50 reduction at Day 1.
FIGURE 5
FIGURE 5
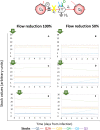
System dynamics of (+)ssRNA virus–host interaction in response to external driving forces applied to reduce virions assembly. Changes over time of the values of each stock of the system diagrammed in Figure 1 (for the color code, see bottom), expressed in ATP-eq, in response to reduction of J5 (flow of energy required for virions assembly). Several scenarios are shown: initial viral load 5k and application of full (100%, A) or partial (50%, B) J5 reduction at Day 0; initial viral load 10k and application of full (100%, C) or partial (50%, D) J5 reduction at Day 0; initial viral load 10k and application of full (100%, E) or partial (50%, F) J5 reduction at Day 1.
FIGURE 6
FIGURE 6
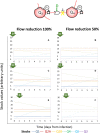
System dynamics of (+)ssRNA virus–host interaction in response to external driving forces applied to reduce viral protein synthesis. Changes over time of the values of each stock of the system diagrammed in Figure 1 (for the color code, see bottom), expressed in ATP-eq, in response to reduction of J4 (flow of energy required for viral RNA translation and viral protein synthesis). Several scenarios are shown: initial viral load 5k and application of full (100%, A) or partial (50%, B) J4 reduction at Day 0; initial viral load 10k and application of full (100%, C) or partial (50%, D) J4 reduction at Day 0; initial viral load 10k and application of full (100%, E) or partial (50%, F) J4 reduction at Day 1.
FIGURE 7
FIGURE 7
System dynamics of (+)ssRNA virus–host interaction in response to external driving forces applied to reduce viral RNA replication. Changes over time of the values of each stock of the system diagrammed in Figure 1 (for the color code, see bottom), expressed in ATP-eq, in response to reduction of J3 (flow of energy required for RNA replication). Several scenarios are shown: initial viral load 5k and application of full (100%, A) or partial (50%, B) J3 reduction at Day 0; initial viral load 10k and application of full (100%, C) or partial (50%, D) J3 reduction at Day 0; initial viral load 10k and application of full (100%, E) or partial (50%, F) J3 reduction at Day 1.
FIGURE 8
FIGURE 8
System configurations dynamics in response to multiple external driving forces applied at different timepoints from infection. Changes over time of Q1 stocks, expressed in ATP-eq, in response to partial (50%) reduction of J5 and J21 (blue line), J5 and J50 (orange line), J21 and J50 (yellow line), or no application of external driving forces applied at Day 0 (A) or at Day 5 (D) of infection. Changes over time of Q3 stocks, expressed in ATP-eq, in response to partial (50%) reduction of J5 and J21 (blue line), J5 and J50 (orange line), J21 and J50 (yellow line), or no application of external driving forces applied at Day 0 (B) or at Day 5 (E) of infection. Changes over time of Q5 stocks, expressed in ATP-eq, in response to partial (50%) reduction of J5 and J21 (blue line), J5 and J50 (orange line), J21 and J50 (yellow line), or no application of external driving forces applied at Day 0 (C) or at Day 5 (F) of infection.

Similar articles

Cited by

References

    1. Acevedo A., Brodsky L., Andino R. (2014). Mutational and fitness landscapes of an RNA virus revealed through population sequencing. Nature 505 686–690. 10.1038/nature12861 - DOI - PMC - PubMed
    1. Adelman K., La Porta A., Santangelo T. I. J. I., Lis J. T., Roberts J. W., Wang M. D. (2002). Single molecule analysis of RNA polymerase elongation reveals uniform kinetic behavior. Proc. Natl. Acad. Sci. U S A 99 13538–13543. 10.1073/pnas.212358999 - DOI - PMC - PubMed
    1. Ahlquist P., Noueiry A. O., Lee W.-M., Kushner D. B., Dye B. T. (2003). Host Factors in Positive-Strand RNA Virus Genome Replication. J. Virol. 77 8181–8186. 10.1128/jvi.77.15.8181-8186.2003 - DOI - PMC - PubMed
    1. Aoki F. Y., Macleod M. D., Paggiaro P., Carewicz O., El Sawy A., Wat C., et al. (2003). Early administration of oral oseltamivir increases the benefits of influenza treatment. J. Antimicrob. Chemother. 51 123–129. 10.1093/jac/dkg007 - DOI - PubMed
    1. Apweiler R., Beissbarth T., Berthold M. R., Blüthgen N., Burmeister Y., Dammann O., et al. (2018). Whither systems medicine? Exp. Mole. Med. 50 e453–e453. - PMC - PubMed

LinkOut - more resources