. 2021 Jan 28;11(1):2410.
doi: 10.1038/s41598-021-81610-z.

Arabidopsis REI-LIKE proteins activate ribosome biogenesis during cold acclimation

Affiliations

Arabidopsis REI-LIKE proteins activate ribosome biogenesis during cold acclimation

Bo Eng Cheong et al. Sci Rep. .

Abstract

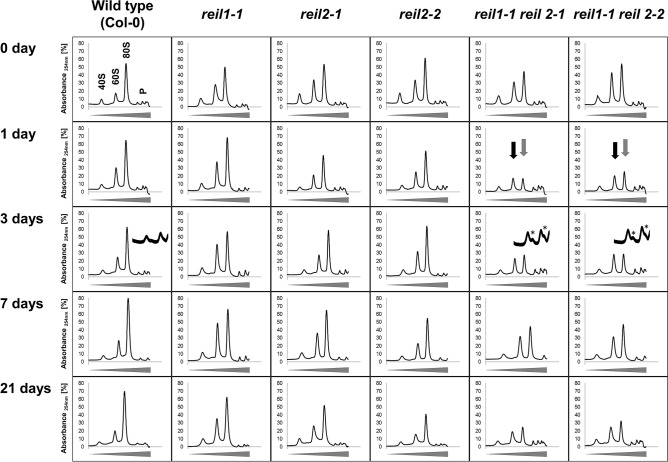
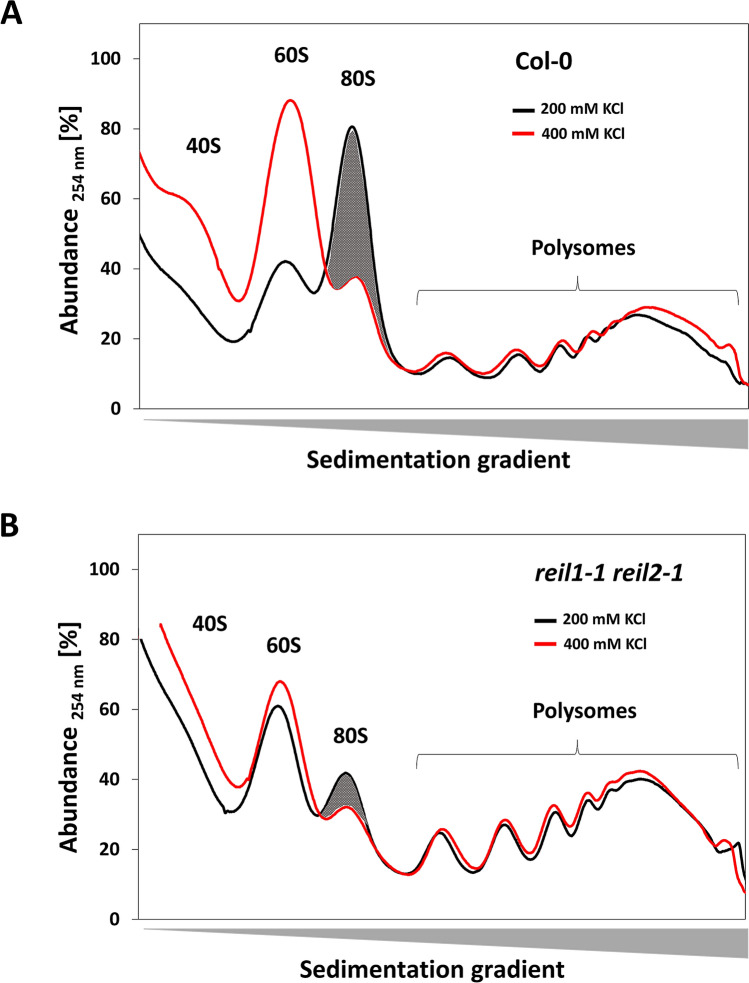
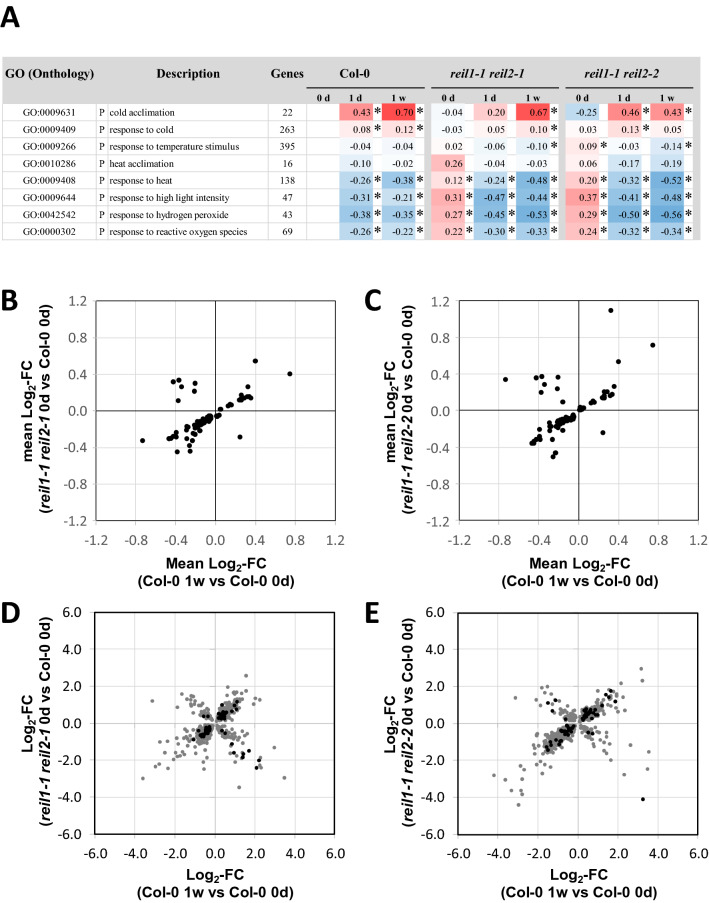
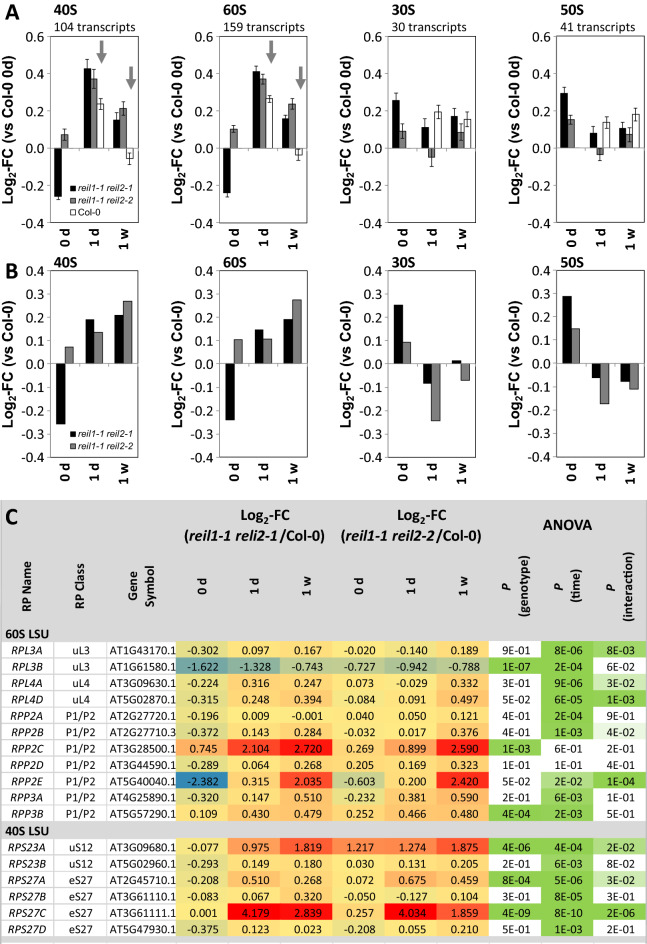
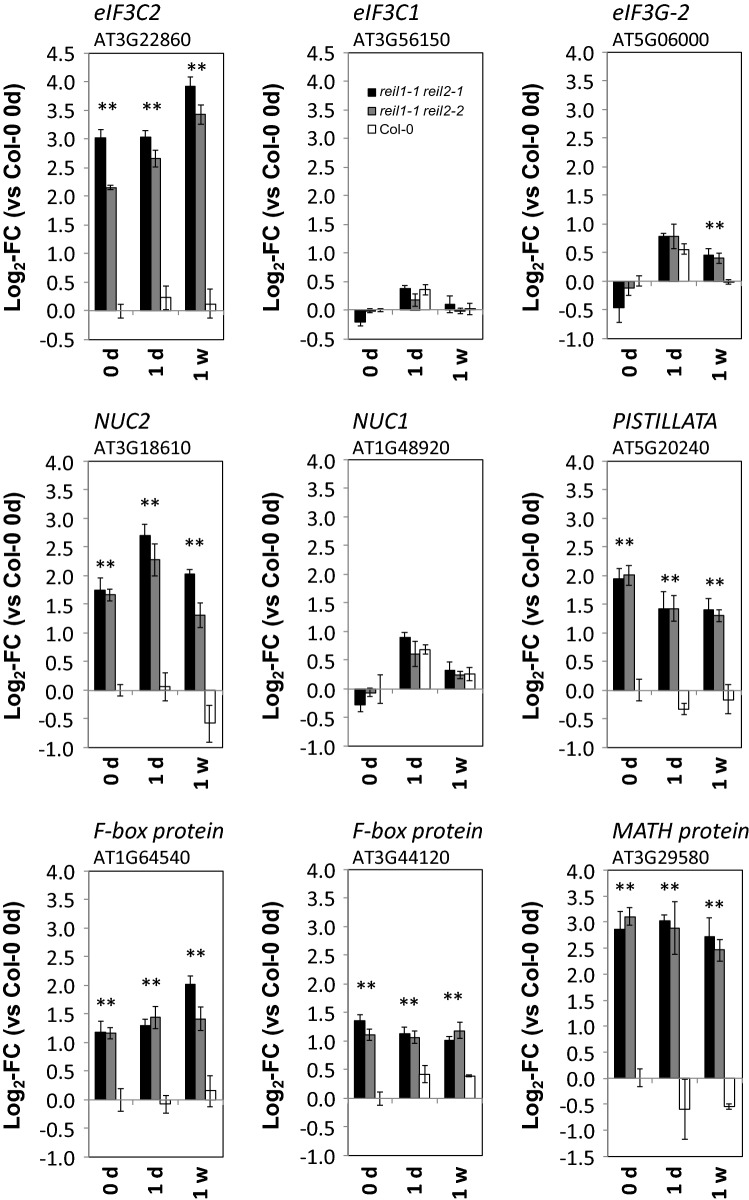
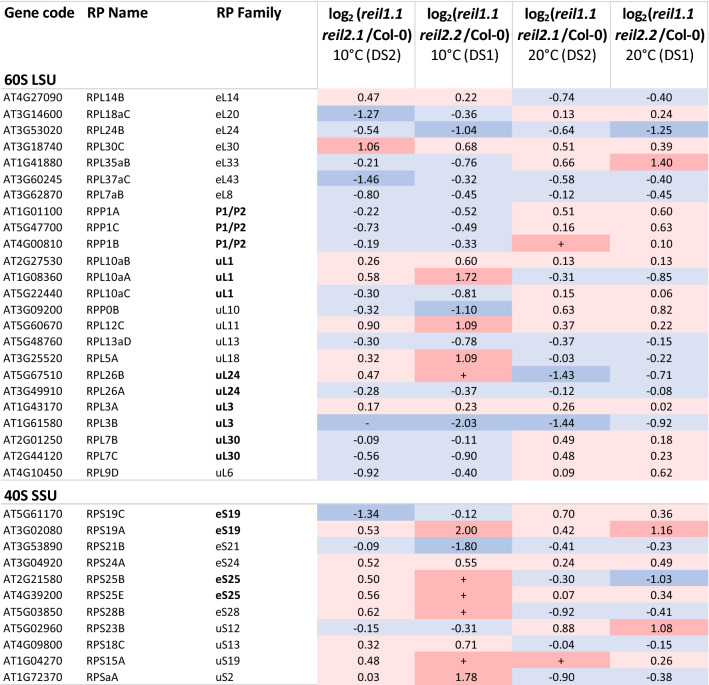
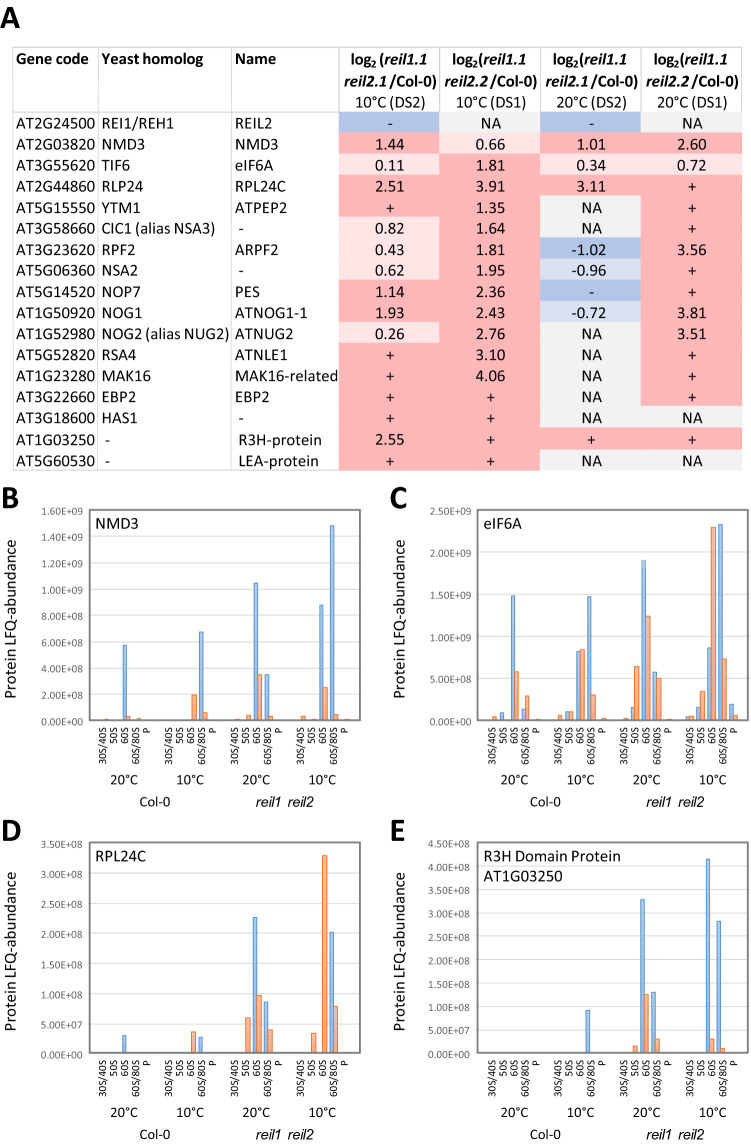
Arabidopsis REIL proteins are cytosolic ribosomal 60S-biogenesis factors. After shift to 10 °C, reil mutants deplete and slowly replenish non-translating eukaryotic ribosome complexes of root tissue, while controlling the balance of non-translating 40S- and 60S-subunits. Reil mutations respond by hyper-accumulation of non-translating subunits at steady-state temperature; after cold-shift, a KCl-sensitive 80S sub-fraction remains depleted. We infer that Arabidopsis may buffer fluctuating translation by pre-existing non-translating ribosomes before de novo synthesis meets temperature-induced demands. Reil1 reil2 double mutants accumulate 43S-preinitiation and pre-60S-maturation complexes and alter paralog composition of ribosomal proteins in non-translating complexes. With few exceptions, e.g. RPL3B and RPL24C, these changes are not under transcriptional control. Our study suggests requirement of de novo synthesis of eukaryotic ribosomes for long-term cold acclimation, feedback control of NUC2 and eIF3C2 transcription and links new proteins, AT1G03250, AT5G60530, to plant ribosome biogenesis. We propose that Arabidopsis requires biosynthesis of specialized ribosomes for cold acclimation.


Conflict of interest statement

The authors declare no competing interests.

Figures

Figure 1
Figure 1
Sucrose density gradient analyses of ribosome complexes from equal amounts (fresh weight) of hydroponically grown total root material before (0 day) and at 1, 3, 7, or 21 days after shift from 20 °C (day)/ 18 °C (night) to 10 °C (day) and 8 °C (night). The Arabidopsis thaliana wild type (Col-0) was compared to the single-paralog mutants, reil1-1, reil2-1, reil2-2, and to the double mutants, reil1-1 reil2-1 and reil1-1 reil2-2. Absorbance at wavelength 254 nm was recorded continuously during fractionation of 15–60% sucrose density gradients (tapered bars) and background corrected by a non-sample control. This is a composite figure of multiple centrifugation runs that each contained a non-sample control. Gradients varied slightly with each centrifugation run. Note the altered abundance pattern of ribosome complexes from the reil1-1 reil2-1 and reil1-1 reil2-2 double mutants in non-acclimated and acclimating states and the delay relative to Col-0 of 60S LSU (black arrows) and 80S monosome (grey arrows) accumulation after cold shift. Inserts into the day 3 analyses magnify the low-oligomer polysome region and demonstrate accumulation of half-mer polysomes (*) in the double mutants early after cold shift. Half-mer polysomes are polysome complexes with a stalled 40S preinitiation complex and one or more fully assembled 80S ribosomes. Positions of 40S, 60S, 80S and low-oligomer polysome complexes (P) are indicated in the top left panel.
Figure 2
Figure 2
Relative quantification of abundances of ribosome complexes from non-acclimated (0 day) and 10 °C cold acclimating reil mutants at 1, 3, 7, or 21 days after shift (cf. Figure 1). Baseline corrected peak areas of ribosome complexes were integrated and log2-transformed ratios calculated relative to the wild type fractions at each time point, i.e. Log2-fold change (FC). The 60S LSU (A), 40S SSU (B), 80S monosomes (C) and the sum (“total”) of all detected ribosome complexes (D), were analyzed (dark grey: reil1-1, light grey: reil2-1 and reil2-2, white: double mutants, reil1-1 reil2-1 and reil1-1 reil2-2).
Figure 3
Figure 3
Correlation analyses of log2-transformed ratios of ribosome complex abundances comparing the cold induced changes of abundances relative to wild type of the 40S SSU (A) and of the 80S monosome fractions (B) to the changes of the 60S LSU fraction, respectively, across all analyzed reil mutants (cf. Figure 2). Inserts are the Pearson´s correlation coefficients (r) assuming a linear trend.
Figure 4
Figure 4
In vitro KCl-sensitivity test of monosomes and polysomes that were prepared from roots sampled at 21 days after start of 10 °C cold-acclimation. Arabidopsis Col-0 wild type (A) was compared to the reil1-1 reil2-1 double mutant (B). Initial samples were homogenized and split into equal technical replicates. These replicates were extracted with PEB that either, contained a normal KCl concentration (200 mM, black) or an elevated KCl concentration (400 mM, red). Note that the acclimated wild type accumulated a large fraction of KCl-sensitive monosomes, whereas KCl-sensitive monosomes were almost absent from cold acclimated reil1-1 reil2-1 preparations.
Figure 5
Figure 5
Functional enrichment and transcript correlation analyses of differential gene expression in the roots of Col-0, and the reil1-1 reil2-1 and reil1-1 reil2-2 double mutants in the non-acclimated state (0 day, 20 °C) and shifted to 10 °C cold for 1 day or 7 days. Differential gene expression is determined relative to non-acclimated Col-0 at optimized temperature 20 °C. (A) Mean log2-fold changes (FC) of temperature related GO terms. Significant positive or negative functional enrichments, i.e. FDR-adjusted P-values < 0.05, are indicated by asterisks. The heat map color scale ranges from log2-FC + 1.5 (red) to − 1.5 (blue). Mean log2-FC, z-scores, and FDR-adjusted P-values of gene sets from 2145 GO terms are calculated by parametric analysis of gene set enrichment (PAGE) (Supplemental Table S3). (B) Mean log2-FC of shared significantly enriched GO terms from the non-acclimated reil1-1 reil2-1 mutant (0 d) compared to acclimated Col-0 at 7 days after shift. (C) Mean log2-FC of shared significantly enriched GO terms from the non-acclimated reil1-1 reil2-2 mutant (0 d) compared to acclimated Col-0 at 7 days after shift. Note that both double mutants and cold acclimated Col-0 shared 100 GO terms of 2145 (FDR-adjusted P < 0.05). (D) Significantly changed transcripts of non-acclimated reil1-1 reil2-1 relative to non-acclimated Col-0 compared to significant cold-responsive transcripts of Col-0 at 7 days after cold shift (P < 0.05, gray, P < 0.01 black, heteroscedastic T-tests). (E) Significantly changed transcripts of non-acclimated reil1-1 reil2-2 relative to non-acclimated Col-0 compared to significant cold-responsive transcripts of Col-0 at 7 days after cold shift (P < 0.05, gray, P < 0.01 black, heteroscedastic t tests). Note that correlation coefficients are not calculated because assumptions of linear correlation do not apply to the full set of observations.
Figure 6
Figure 6
Functional enrichment analyses of differential gene expression in roots of Col-0, and the reil1-1 reil2-1 and reil1-1 reil2-2 double mutants in the non-acclimated state (0 day, 20 °C) and shifted to 10 °C cold for 1 day or 7 days. Differential gene expression is determined relative to non-acclimated Col-0 at optimized temperature 20 °C. (A) Mean log2-fold changes (FC) of selected ribosome biogenesis and ribosome related GO terms. Note the prolonged and stronger activation of cytosolic ribosome related genes in the mutants. (B) Mean log2-FCs of selected translation related GO terms. (C) Mean log2-FCs of selected ribonucleoprotein related GO terms. (C = cellular component, P = biological process, F = molecular function). Significant positive or negative functional enrichments, i.e. FDR-adjusted P-values < 0.05, are indicated by asterisks. The heat map color scale ranges from log2-FC + 1.5 (red) to − 1.5 (blue). Mean log2-FC, z-scores, and FDR-adjusted P-values of gene sets from 2145 GO terms are calculated by parametric analysis of gene set enrichment (PAGE) (Supplemental Table S3).
Figure 7
Figure 7
Differential expression of cytosolic and plastid ribosomal genes in reil1-1 reil2-1 and reil1-1 reil2-2 double mutant roots in the non-acclimated state (0 day, 20 °C) and shifted to 10 °C cold for 1 day or 7 days. (A) Average log2-fold change (FC, means + / − standard error) relative to non-acclimated Col-0 (0 day) of transcripts coding for ribosome proteins (RPs) from the cytosolic 40S and 60S subunits and from the plastid 30S and 50S subunits. Grey arrows indicate transcript accumulation of the mutants in the cold. (B) Average log2-fold changes relative to Col-0 at each time point calculated from the means of the data from (A). (C) Log2-fold changes relative to Col-0 at each time point of selected cytosolic RP families. Two-factorial analysis of variance (ANOVA) indicates differential effects of the genotype, cold exposure (time) or the interaction of both on the expression of paralogous RPs from the 60S and the 40S subunits in the mutants. The three-color scale of the log2-FC heat map ranges from − 3.0 (blue) to 0.0 (yellow) to ≥  + 3.0 (red). The two-color significance scale ranges from P ≤ 1.0 × 10–10 (1E-10, dark green) to P < 0.05 (5E-2, light green), P ≥ 0.05 (white).
Figure 8
Figure 8
Differential expression of six genes that accumulate constitutively in reil1-1 reil2-1 and reil1-1 reil2-2 double mutant roots (means + / − standard error, n = 3). eIF3C2, eIF3C1 and eIF3G2 code for paralogs of the eukaryotic translation initiation factor 3 multi-protein complex. NUC1 and NUC2 are plant nucleolins. Asterisks indicate P < 0.05 (heteroscedastic Student´s t-test) of comparisons to Col-0 at the same time point. NUC1, eIF3C1 and eIF3G2 are added to this figure to demonstrate the specific mutant effect on paralog transcription.
Figure 9
Figure 9
Changes of RP composition in the non-translating 60S LSU and 40S SSU fractions of the reil1 reil2 double mutants 7 days after shift to 10 °C and prior to cold shift at 20 °C. This selection shows RPs with responses shared between reil1-1 reil2-1 (DS2) and reil1-1 reil2-2 (DS1) at 10 °C and 20°. Log2-fold changes between mutants and Col-0 wild type are calculated after normalization of RP LFQ-abundances by the abundance sums of all detected 60S RPs in the respective fraction and combined across the 60S and 60S/80S fractions (top) or by the abundance sums of all detected 40S RPs in the 30S/40S fractions (bottom). Presence relative to absence in Col-0 and log2-fold increases > 1 are color-coded red, increases < 1 are coded light-red. Absence relative to presence in Col-0 and log2-fold decreases <  − 1 are color-coded blue, decreases >  − 1 are coded light-blue.
Figure 10
Figure 10
Changes of the composition of ribosome associated proteins in the non-translating 60S fractions of the reil1 reil2 double mutants 7 days after shift to 10 °C and prior to cold shift at 20 °C. (A) REIL2 and the shared changes at 10 °C between reil1-1 reil2-1 (DS2) and reil1-1 reil2-2 (DS1). Log2-fold changes between mutants and Col-0 wild type are calculated after normalization of protein LFQ-abundances by abundance sums of all detected 60S RPs and combined across the 60S and 60S/80S fractions. Presence in mutants relative to absence in Col-0 and log2-fold increases > 1 are color-coded red, increases < 1 are light red. Absence relative to presence in Col-0 and log2-fold decreases <  − 1 are color-coded blue, decreases >  − 1 are light-blue. Absence in both mutant and Col-0 is color-coded grey and indicated by NA (not available). (BE) LFQ-abundance distributions of NMD3, eIF6A, RPL24C, and R3H domain Protein AT1G03250 across the sampled ribosome fractions and analyzed conditions (Experiment DS1, orange; experiment DS2, blue). Note the abundance maxima of the proteins in the non-translating 60S and 60/80S fractions.
Figure 11
Figure 11
Changes of the composition of translation initiation factor 3 proteins in the non-translating 40S fraction of the reil1 reil2 double mutants 7 days after shift to 10 °C and prior to cold shift at 20 °C. (A) Shared changes at 10 °C between reil1-1 reil2-1 (DS2) and reil1-1 reil2-2 (DS1). Log2-fold changes between mutants and Col-0 wild type in the 30S/40S fractions are calculated after normalization of protein LFQ-abundances by abundance sums of all detected 40S RPs. Presence in mutants relative to absence in Col-0 and log2-fold increases > 1 are color-coded red, increases < 1 are light red. Absence relative to presence in Col-0 and log2-fold decreases <  − 1 are color-coded blue, decreases >  − 1 are light-blue. (B) Distribution of eIF3A1 LFQ-abundances across the sampled ribosome fractions and analyzed conditions (Experiment DS1, orange; experiment DS2 blue). (C) Distribution of eIF3C1 LFQ-abundances across the sampled ribosome fractions and analyzed conditions (Experiment DS1, orange; experiment DS2, blue). Note the abundance maxima in the 30/40S fractions that may contain 40S subunits and 43S pre-initiation complexes.

Similar articles

Cited by

References

    1. Greber BJ, Boehringer D, Montellese C, Ban N. Cryo-EM structures of Arx1 and maturation factors Rei1 and Jjj1 bound to the 60S ribosomal subunit. Nat. Struct. Mol. Biol. 2012;19:1228–1234. doi: 10.1038/nsmb.2425. - DOI - PubMed
    1. Greber BJ, Gethardy S, Leitner A, et al. Insertion of the biogenesis factor Rei1 probes the ribosomal tunnel during 60S maturation. Cell. 2016;164:91–102. doi: 10.1016/j.cell.2015.11.027. - DOI - PubMed
    1. Iwase M, Toh-e A. Ybr267w is a new cytoplasmic protein belonging to the mitotic signaling network of Saccharomyces cerevisiae. Cell Struct. Funct. 2004;29:1–15. doi: 10.1247/csf.29.1. - DOI - PubMed
    1. Lebreton A, Saveanu C, Decourty L, Rain J-C, Jacquier A, Fromont-Racine M. A functional network involved in the recycling of nucleocytoplasmic pre-60S factors. J. Cell Biol. 2006;173:349–360. doi: 10.1083/jcb.200510080. - DOI - PMC - PubMed
    1. Parnell KM, Bass BL. Functional redundancy of yeast proteins Reh1 and Rei1 in cytoplasmic 60S subunit maturation. Mol. Cell Biol. 2009;29:4014–4023. doi: 10.1128/MCB.01582-08. - DOI - PMC - PubMed

Publication types

Substances