. 2021 Jan 25;14(1):23.
doi: 10.1186/s13041-021-00738-1.

Mice with cleavage-resistant N-cadherin exhibit synapse anomaly in the hippocampus and outperformance in spatial learning tasks

Affiliations

Mice with cleavage-resistant N-cadherin exhibit synapse anomaly in the hippocampus and outperformance in spatial learning tasks

M Asada-Utsugi et al. Mol Brain. .

Abstract

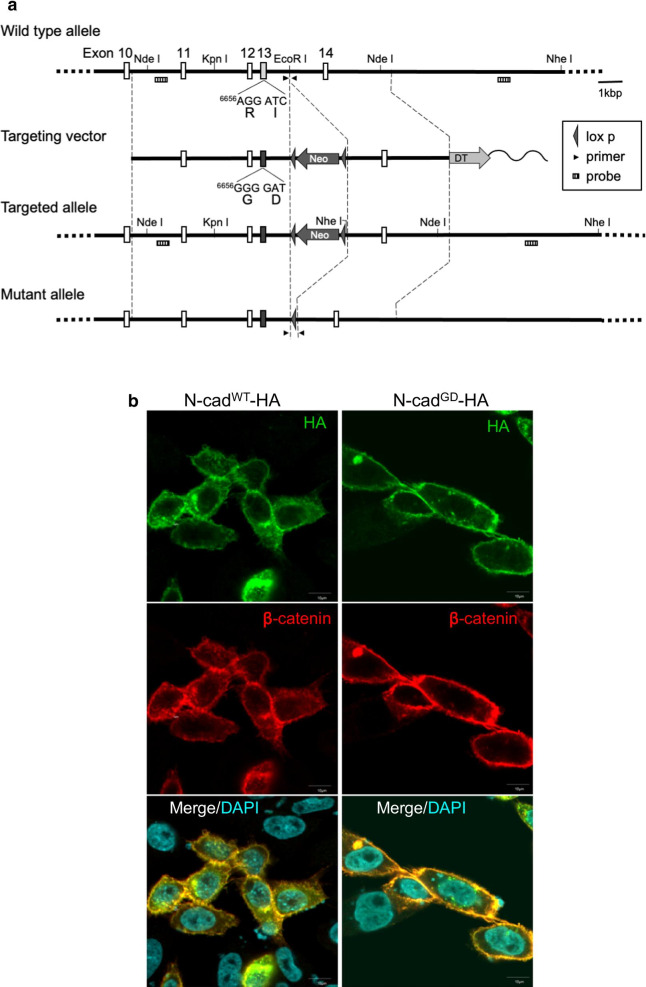
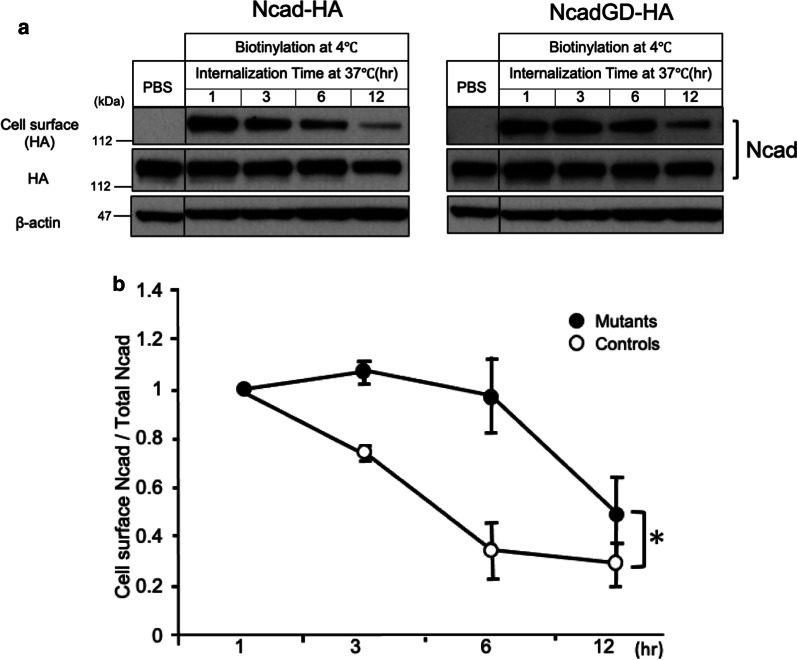
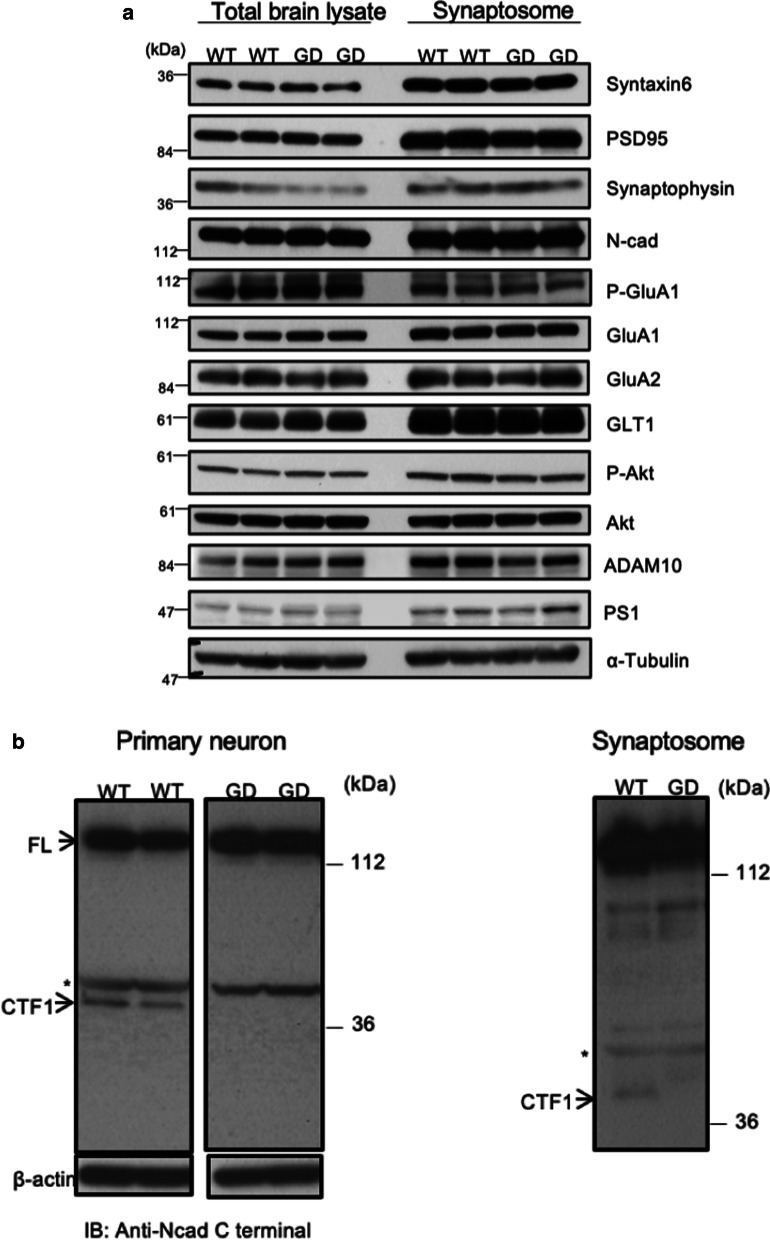
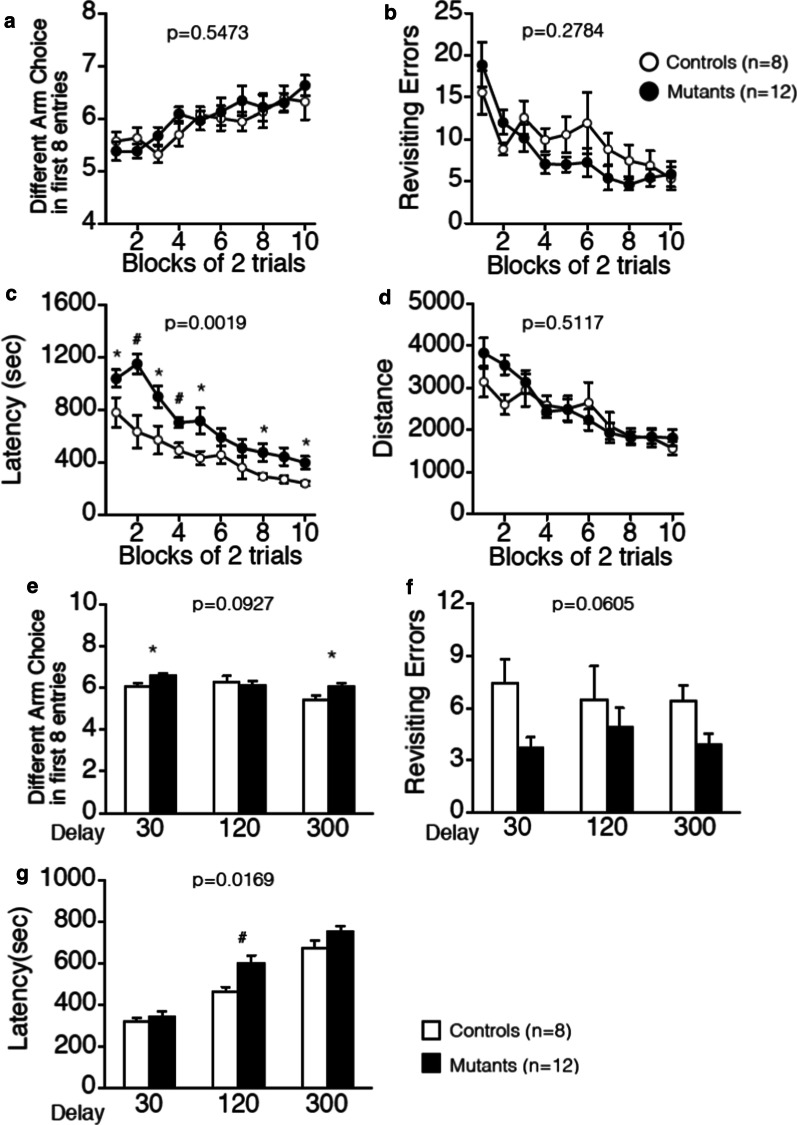
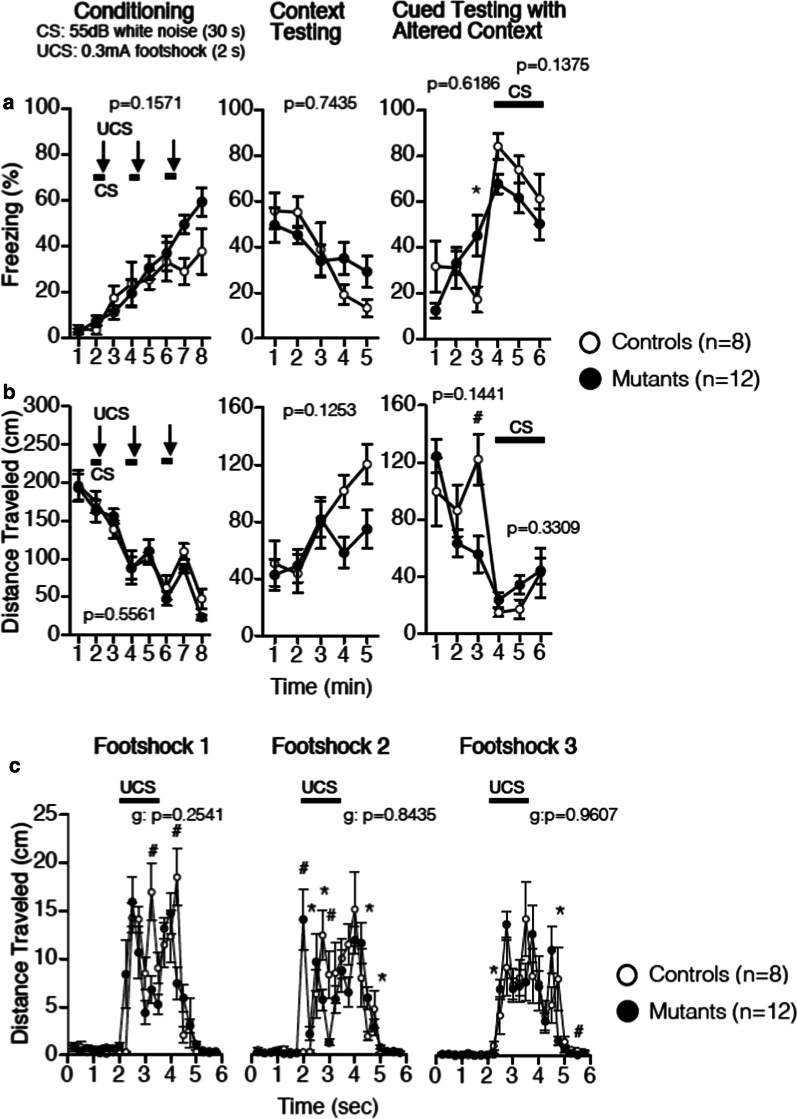
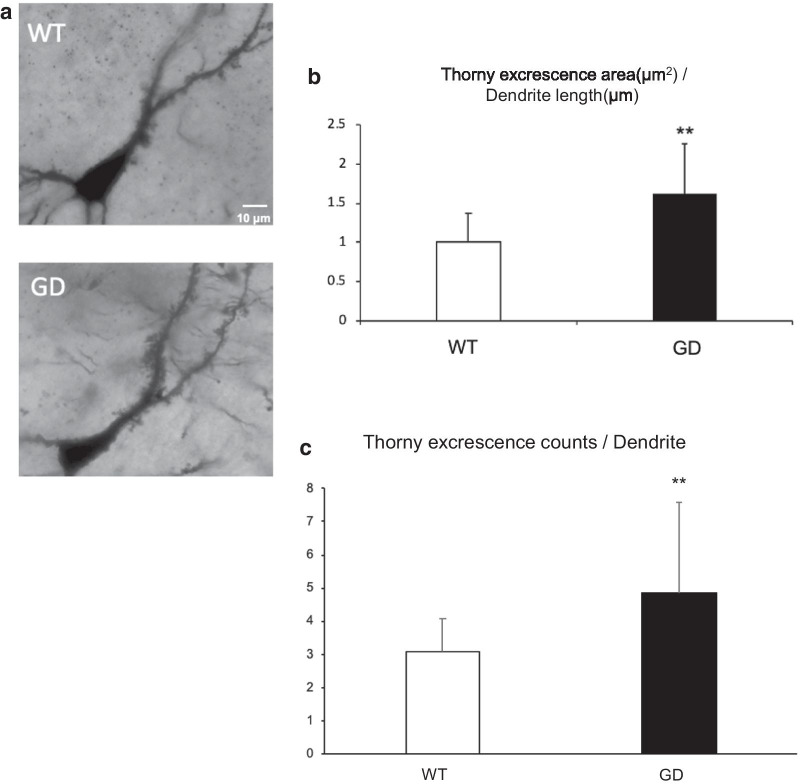
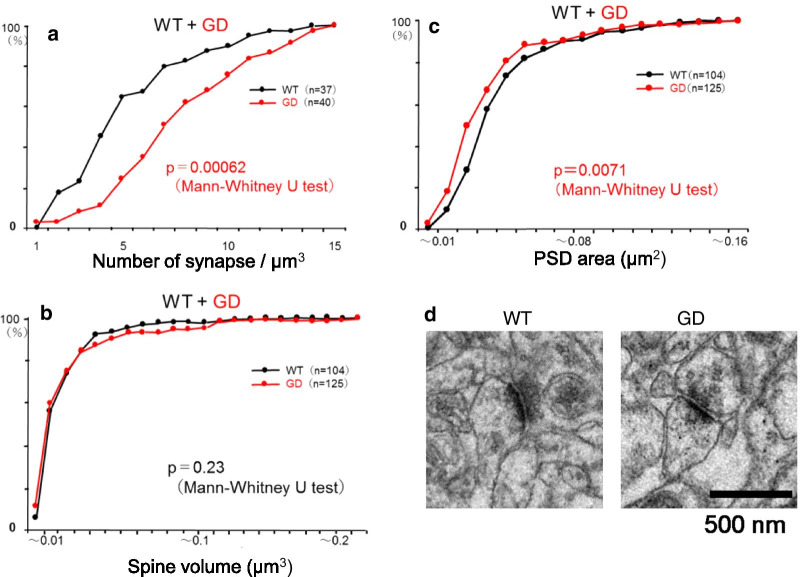
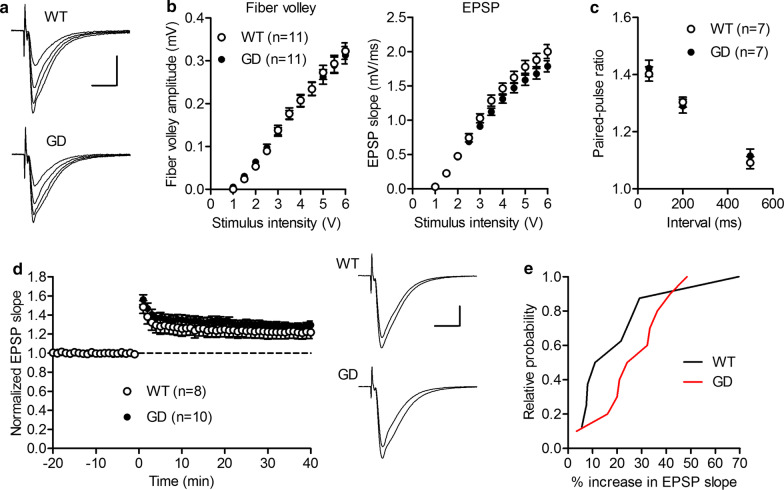
N-cadherin is a homophilic cell adhesion molecule that stabilizes excitatory synapses, by connecting pre- and post-synaptic termini. Upon NMDA receptor (NMDAR) activation by glutamate, membrane-proximal domains of N-cadherin are cleaved serially by a-disintegrin-and-metalloprotease 10 (ADAM10) and then presenilin 1(PS1, catalytic subunit of the γ-secretase complex). To assess the physiological significance of the initial N-cadherin cleavage, we engineer the mouse genome to create a knock-in allele with tandem missense mutations in the mouse N-cadherin/Cadherin-2 gene (Cdh2 R714G, I715D, or GD) that confers resistance on proteolysis by ADAM10 (GD mice). GD mice showed a better performance in the radial maze test, with significantly less revisiting errors after intervals of 30 and 300 s than WT, and a tendency for enhanced freezing in fear conditioning. Interestingly, GD mice reveal higher complexity in the tufts of thorny excrescence in the CA3 region of the hippocampus. Fine morphometry with serial section transmission electron microscopy (ssTEM) and three-dimensional (3D) reconstruction reveals significantly higher synaptic density, significantly smaller PSD area, and normal dendritic spine volume in GD mice. This knock-in mouse has provided in vivo evidence that ADAM10-mediated cleavage is a critical step in N-cadherin shedding and degradation and involved in the structure and function of glutamatergic synapses, which affect the memory function.

Keywords: ADAM10; Hippocampus; N-cadherin; Synapse; Working memory.


Conflict of interest statement

The authors declare that they have no competing interests.

Figures

Fig. 1
Fig. 1
Introducing ADAM10-uncleavable GD mutations into N-cadherin/Cdh2 in the mouse genome, and testing the mutant distribution in cultured cells. a Genomic DNA map of the mouse Cdh2 gene locus, mutant design, and targeting strategy. The gene targeting vector was designed to introduce tandem missense mutations (6656AGG ATC for 714RI → GGG GAT for GD) in the exon 13 of the mouse Cdh2 gene. The targeting vector was introduced into C57BL/6-derived ES cells by electroporation. Neomycin-resistant clones were screened for homologous recombination with genomic Southern blotting using two probes, and one such clone was injected into ICR blastocysts. The resulting chimera mice were intercrossed with C57BL/6 N mice. The floxed neomycin-resistant cassette was removed from the allele by intercrossing the F1 mice with a line of CAG-Cre driver mice of C57BL/6 strain. The mutant and wild type alleles were discriminated routinely by PCR genotyping, using a pair of primers (arrowheads). See “Methods” for details. b Representative immunofluorescence images of FLAG-tagged, WT and GD mutant N-cadherin expressed in CHO cells. Their distribution patterns on ER, Golgi apparatus, and plasma membrane (green), as well as colocalization with endogenous β-catenin (red), were comparable. Nuclear DNA is stained with DAPI (cyan)
Fig. 2
Fig. 2
GD mutant N-cadherin on the plasma membrane is relatively stable. a Representative immunoblot data from cell surface protein bio-tinylation analysis for HA-tagged, WT (left) or GD mutant (right) N-cadherin expressed in CHO cells. Surface bio-tinylation pulse-labeling followed by serial immunoblot assay for the HA epitope shows that cell surface fraction of GD and WT N-cadherins decay within hours, while the levels of total N-cadherins remain unchanged. It is to be noted that the cell surface fraction of GD N-cadherin was significantly more stable than that of WT. (B) (Top) Densitometric quantification of surface biotinylation assay demonstrated that GD mutant (●) on the plasma membrane decayed significantly more slowly than WT (○). (n = 3, 3, p = 0.0241, ANOVA)
Fig. 3
Fig. 3
Protein profiles of GD mouse brain is normal but for the absence of CTF1. a Representative immunoblot of endogenous proteins related to glutamatergic synapse and/or N-cadherin in the total brain lysate and a synaptosomal fraction from GD and WT mice. No recognizable difference was found in syntaxin 6, PSD95, synaptophysin, full-length N-cadherin, phospho-GluA1, GluA1, GluA2, GLT-1, phospho-AKT, AKT, α-tubulin). b Immunoblot detection of endogenous N-cadherin with an antibody against a C-terminal region in the total lysates of primary cultured cerebrocortical neurons from WT and GD mice. While the full-length form (FL, 130 kDa) was detected both in WT and GD samples, the cytoplasmic fragment CTF1 (45 kDa) was detected only in those from WT, but not in those from GD mice (left). Similar results were obtained from the synaptosomal fraction (right). Non-specific bands appeared around 50 kDa (*) and above
Fig. 4
Fig. 4
Improvement of working memory performance of GD mice in the eight-arm radial maze test. Spatial learning was tested in the eight-arm radial maze test on 4 months WT (□; n = 9) and GD (■; n = 12) mice. aThe number of different arm choices in the first eight entries, b the number of revisiting errors, c the latency to acquire eight pellets and d and the distance traveled, are presented. eg Results of the eight-arm radial maze test with delays of 3, 120, 300 s. The number of different arm choices in the first eight entries (e), the number of revisiting errors (f) and latency (g) were presented. One WT mouse died after trials. The p-values indicate genotype effect in two-way repeated measures ANOVA (ag) or one-way ANOVA (eg, for each delay time). Values are means ± SEM
Fig. 5
Fig. 5
Fear conditioning test in GD mice. a Freezing (%) in the conditioning (left panel), context test (middle panel), and cued test (right panel). b Distance traveled (cm) in the conditioning (left panel), context test (middle panel), and cued test (right panel). c Distance traveled immediately after foot-shocks in the conditioning phase. The p-values indicate genotype effect in two-way repeated measures ANOVA (ac). *p < 0.05, **p < 0.01 (one-way ANOVA for each time point). Values are means ± SEM. WT □; n = 8, GD ■; n = 12
Fig. 6
Fig. 6
GD mice exhibit synapse anomalies in CA3. a Bright field micrographs of Golgi stained brain slices from the stratum lucidum of the CA3 region of the hippocampus. Note the complexity in the tufts of thorny excrescence. b The graph shows that the area of thorny excrescence per unit length of dendrite is significantly higher in GD mice. WT; n = 12, GD; n = 15, ** p = 0.0063, t-test. c Thorny excrescence counts per dendrite. ** p = 0.0019, t-test. Data presented as mean + SD
Fig. 7
Fig. 7
GD mice exhibit synapse anomalies in CA3. a Cumulative histogram of asymmetrical synapse density in the stratum radiatum of the CA3 region of the hippocampus. Synapse density measured by the dissector method was significantly higher in GD mice (median value, 7 vs. 4, n: number of images examined. n = 37, 40, p = 0.00062, Mann–Whitney U-test). b Cumulative histogram of dendritic spine volume of asymmetrical synapses in the same region. Dendritic spine volume measured with ssTEM/3D reconstruction method was comparable between GD and WT mice (median value, 0.015 vs. 0.015, n: number of spines examined. n = 104, 125, p = 0.23, Mann–Whitney U-test). c Cumulative histogram of PSD area of asymmetrical synapses in the same region. PSD area measured with ssTEM/3D reconstruction method was significantly smaller in GD mice (median value, 0.030 vs. 0.035, n: number of spines examined. n = 104, 125, p = 0.0071, Mann–Whitney U-test). d Representative images of asymmetrical synapses at CA3 region observed by electron microscopy
Fig. 8
Fig. 8
Marginal anomalies of A/C fiber-pyramidal cell synaptic transmission in CA3. a A/C fiber-pyramidal cell synaptic potentials evoked at the stimulus intensities of 2, 3, 4 and 5 V in WT and GD mice. Scale bar: 10 ms, 1 mV. b Dependence of fiber volley amplitude (left) and EPSP slope (right) on stimulus intensity. Statistically significant interaction between genotype and stimulus intensity was observed for EPSP slopes (two-way repeated measure ANOVA: genotype, F1,20 = 2.02, p = 0.1711; stimulus intensity, F10,200 = 767.49, p < 0.0001; genotype × stimulus intensity; F10,200 = 3.2, p = 0.0008). c Normal paired-pulse facilitation of EPSP slopes. d Mild augmentation of LTP in the mutant mice. High-frequency stimulation (HFS) was delivered at time 0. Sample traces are averages of 30 consecutive EPSPs during baseline and 30 to 40 min after HFS. e Cumulative relative probability distributions of the magnitude of LTP measured at 30 to 40 min after HFS. The number (n) of data represents the number of slices in this figure

Similar articles

Cited by

References

    1. Dalva MB, McClelland AC, Kayser MS. Cell adhesion molecules: signalling functions at thesynapse. Nat Rev Neurosci. 2007;8:206–220. doi: 10.1038/nrn2075. - DOI - PMC - PubMed
    1. Kadowaki M, Nakamura S, Machon O, Krauss S, Radice GL, Takeichi M. N-cadherinmediates cortical organization in the mouse brain. Dev Biol. 2007;304:22–33. doi: 10.1016/j.ydbio.2006.12.014. - DOI - PubMed
    1. Arikkath J, Reichardt LF. Cadherins and catenins at synapses: roles in synaptogenesis and synaptic plasticity. Trends Neurosci. 2008;31:487–494. doi: 10.1016/j.tins.2008.07.001. - DOI - PMC - PubMed
    1. Hirano S, Takeichi M. Cadherins in brain morphogenesis and wiring. Physiol Rev. 2012;92:597–634. doi: 10.1152/physrev.00014.2011. - DOI - PubMed
    1. Nikitczuk JS, Patil SB, Matikainen-Ankney BA, Scarpa J, Shapiro ML, Benson DL, Huntley GW. N-cadherin regulates molecular organization of excitatory and inhibitory synaptic circuits in adult hippocampus in vivo. Hippocampus. 2014;24:943–962. doi: 10.1002/hipo.22282. - DOI - PMC - PubMed

Publication types

MeSH terms