

Interleukin-8 as a Biomarker for Disease Prognosis of Coronavirus Disease-2019 Patients
- PMID: 33488599
- PMCID: PMC7820901
- DOI: 10.3389/fimmu.2020.602395
Interleukin-8 as a Biomarker for Disease Prognosis of Coronavirus Disease-2019 Patients
Abstract
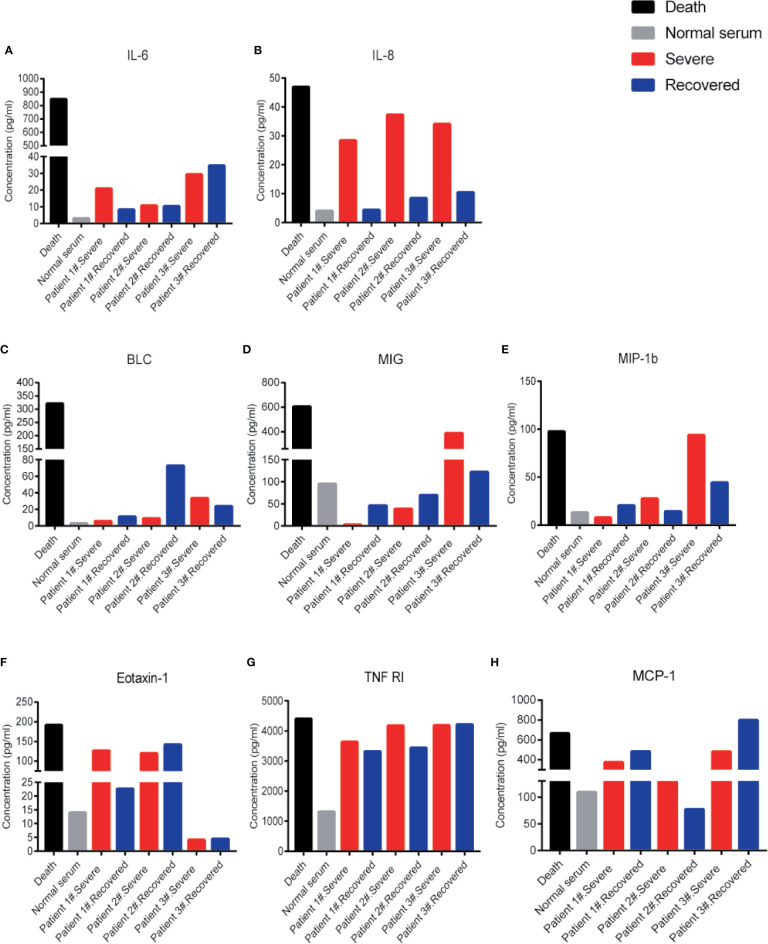
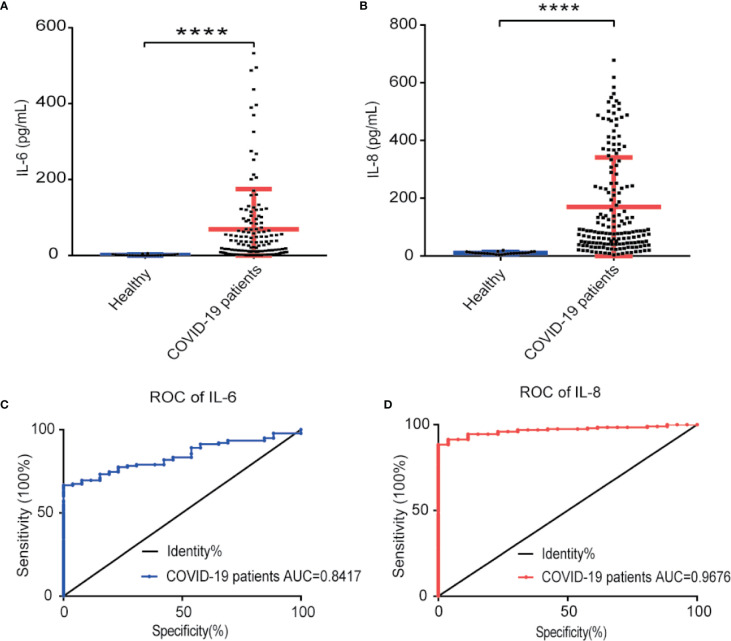
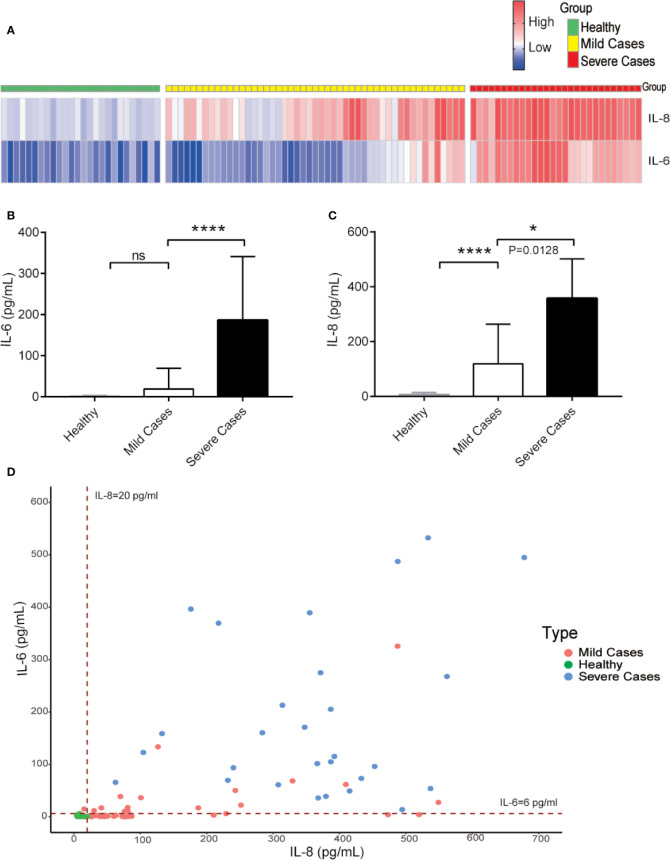
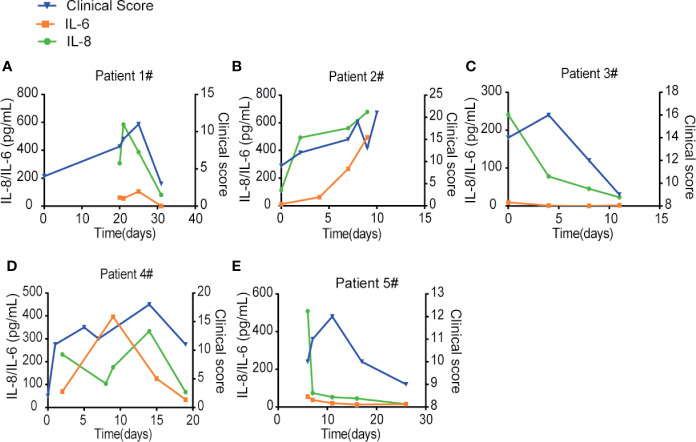
The widespread prevalence of coronavirus disease-2019 (COVID-19) which is caused by severe respiratory syndrome coronavirus 2 (SARS-CoV-2) infection, has resulted in a severe global public health emergency. However, there are no sensitive biomarkers to predict the disease prognosis of COVID-19 patients. Here, we have identified interleukin-8 (IL-8) as a biomarker candidate to predict different disease severity and prognosis of COVID-19 patients. While serum IL-6 become obviously elevated in severe COVID-19 patients, serum IL-8 was easily detectible in COVID-19 patients with mild syndromes. Furthermore, lL-8 levels correlated better than IL-6 levels with the overall clinical disease scores at different stages of the same COVID-19 patients. Thus, our studies suggest that IL-6 and IL-8 can be respectively used as biomarkers for severe COVID-19 patients and for COVID-19 disease prognosis.
Keywords: biomarker; coronavirus disease-2019 prognosis; cytokine serum profile; cytokine storm; interleukin-6; interleukin-8; respiratory syndrome coronavirus 2.
Copyright © 2021 Li, Li, Gao, Fan, Wang, Xu, Chen, Liu, Kim, Aliyari, Zhang, Jin, Li, Ma, Shi, Cheng and Yang.
Conflict of interest statement
Authors YW and CC were employed by the company Suzhou Func Biotech Inc. The remaining authors declare that the research was conducted in the absence of any commercial or financial relationships that could be construed as a potential conflict of interest.
Figures

Similar articles
-
Detectable Serum Severe Acute Respiratory Syndrome Coronavirus 2 Viral Load (RNAemia) Is Closely Correlated With Drastically Elevated Interleukin 6 Level in Critically Ill Patients With Coronavirus Disease 2019.Clin Infect Dis. 2020 Nov 5;71(8):1937-1942. doi: 10.1093/cid/ciaa449. Clin Infect Dis. 2020. PMID: 32301997 Free PMC article.
-
An inter-correlated cytokine network identified at the center of cytokine storm predicted COVID-19 prognosis.Cytokine. 2021 Feb;138:155365. doi: 10.1016/j.cyto.2020.155365. Epub 2020 Nov 9. Cytokine. 2021. PMID: 33246770 Free PMC article.
-
Using IL-2R/lymphocytes for predicting the clinical progression of patients with COVID-19.Clin Exp Immunol. 2020 Jul;201(1):76-84. doi: 10.1111/cei.13450. Epub 2020 May 15. Clin Exp Immunol. 2020. PMID: 32365221 Free PMC article.
-
The Role of Inflammatory Cytokines (Interleukin-1 and Interleukin-6) as a Potential Biomarker in the Different Stages of COVID-19 (Mild, Severe, and Critical).J Interferon Cytokine Res. 2023 Apr;43(4):147-163. doi: 10.1089/jir.2022.0185. J Interferon Cytokine Res. 2023. PMID: 37062817 Review.
-
Biomarkers for Prognosis and Treatment Response in COVID-19 Patients.Ann Lab Med. 2021 Nov 1;41(6):540-548. doi: 10.3343/alm.2021.41.6.540. Ann Lab Med. 2021. PMID: 34108281 Free PMC article. Review.
Cited by
-
A potent inflammatory response is triggered in asymptomatic blood donors with recent SARS-CoV-2 infection.Rev Soc Bras Med Trop. 2022 Oct 21;55:e02392022. doi: 10.1590/0037-8682-0239-2022. eCollection 2022. Rev Soc Bras Med Trop. 2022. PMID: 36287506 Free PMC article.
-
The Prognostic Utility of Cytokines in Hospitalized COVID-19 Patients.J Crit Care Med (Targu Mures). 2023 Nov 14;9(4):208-217. doi: 10.2478/jccm-2023-0025. eCollection 2023 Oct. J Crit Care Med (Targu Mures). 2023. PMID: 37969879 Free PMC article.
-
Efficacy and Safety of Complementary Therapy With Jing Si Herbal Tea in Patients With Mild-To-Moderate COVID-19: A Prospective Cohort Study.Front Nutr. 2022 Mar 14;9:832321. doi: 10.3389/fnut.2022.832321. eCollection 2022. Front Nutr. 2022. PMID: 35369061 Free PMC article.
-
Sex-adjusted approach to baseline variables demonstrated some improved predictive capabilities for disease severity and survival in patients with Coronavirus Disease 19.Inform Med Unlocked. 2022;31:100982. doi: 10.1016/j.imu.2022.100982. Epub 2022 Jun 10. Inform Med Unlocked. 2022. PMID: 35706828 Free PMC article.
-
Neutrophils in COVID-19: Not Innocent Bystanders.Front Immunol. 2022 Jun 1;13:864387. doi: 10.3389/fimmu.2022.864387. eCollection 2022. Front Immunol. 2022. PMID: 35720378 Free PMC article. Review.
References
Publication types
MeSH terms
Substances
Grants and funding
LinkOut - more resources
Full Text Sources
Other Literature Sources
Medical
Miscellaneous