. 2021 Jan 22;12(1):549.
doi: 10.1038/s41467-020-20832-7.

Fetuin-A is a HIF target that safeguards tissue integrity during hypoxic stress

Affiliations

Fetuin-A is a HIF target that safeguards tissue integrity during hypoxic stress

Stefan Rudloff et al. Nat Commun. .

Abstract

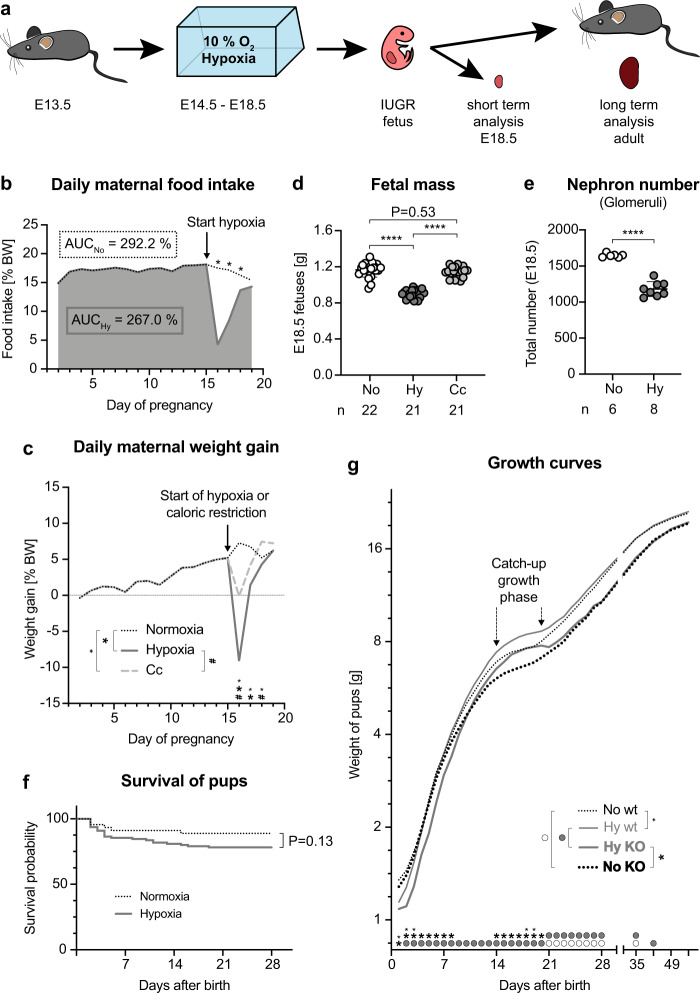
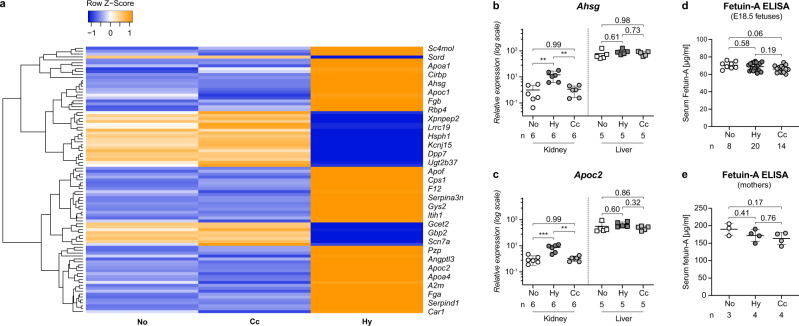
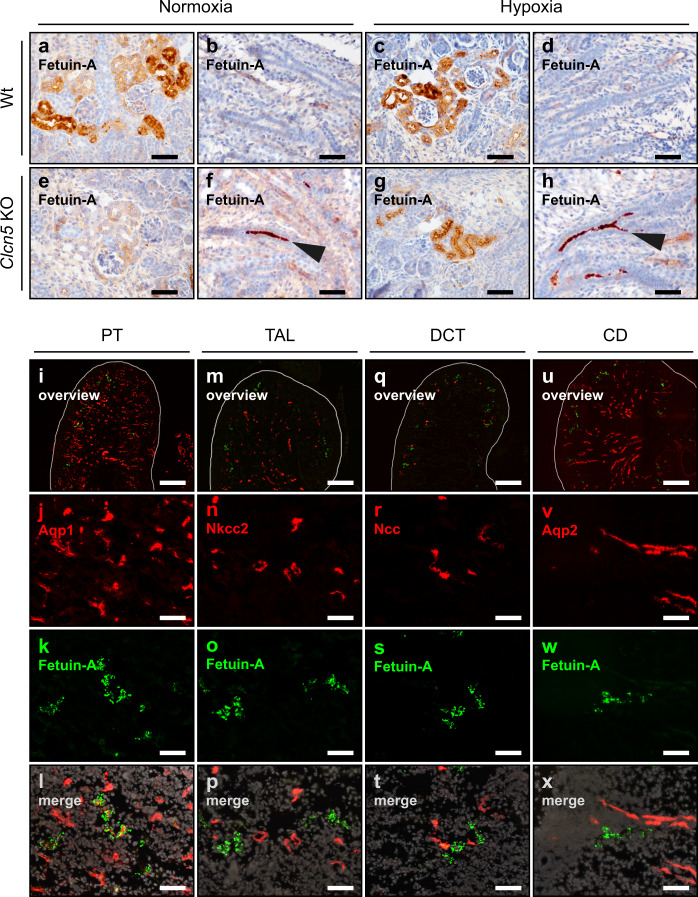
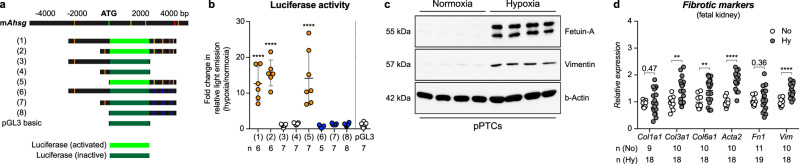
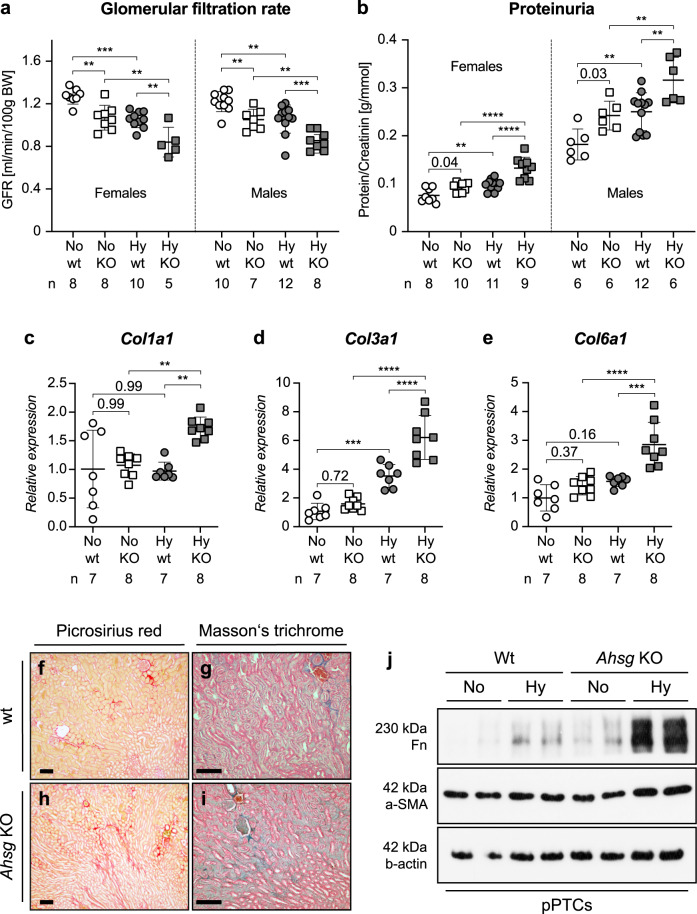
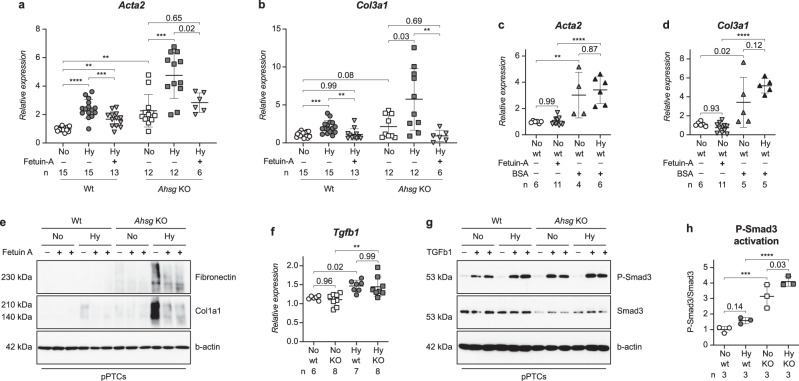
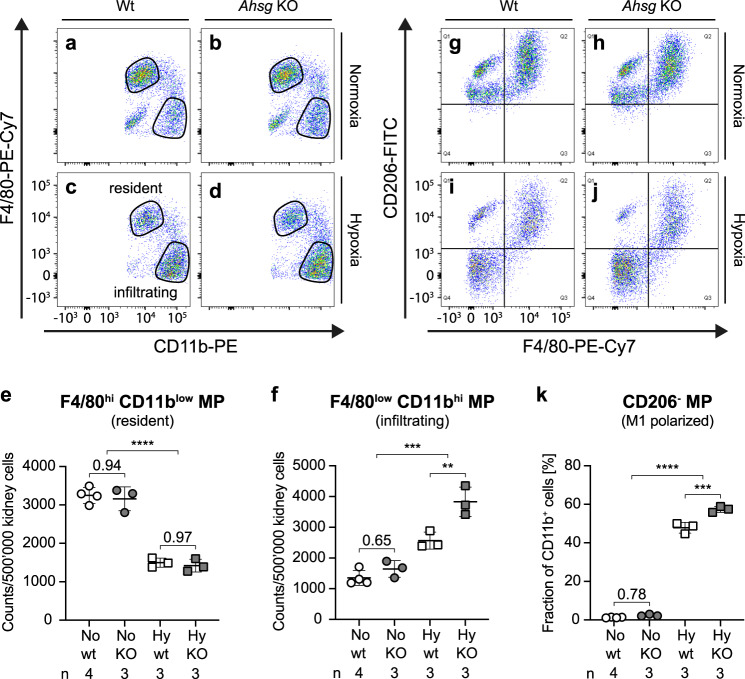
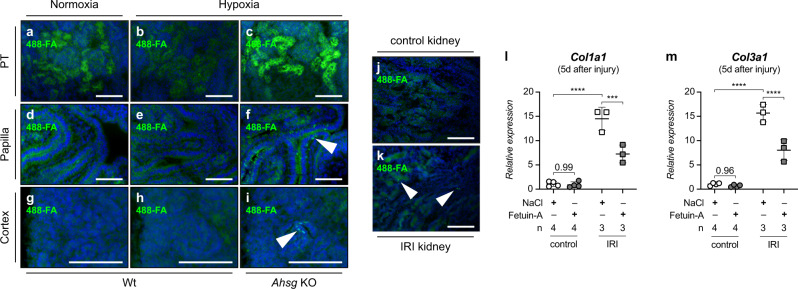
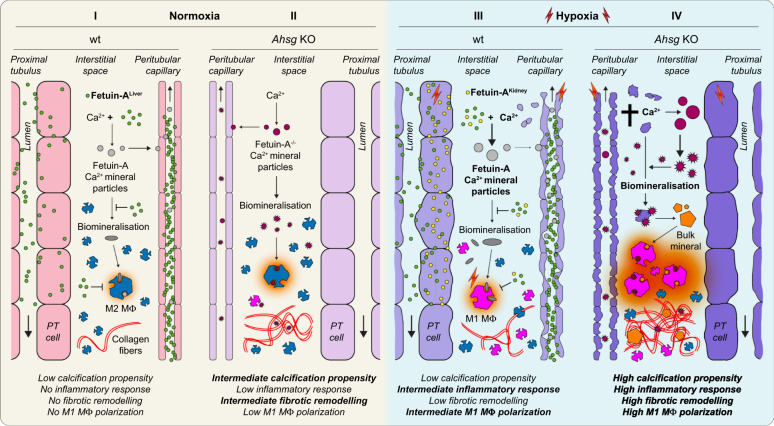
Intrauterine growth restriction (IUGR) is associated with reduced kidney size at birth, accelerated renal function decline, and increased risk for chronic kidney and cardiovascular diseases in adults. Precise mechanisms underlying fetal programming of adult diseases remain largely elusive and warrant extensive investigation. Setting up a mouse model of hypoxia-induced IUGR, fetal adaptations at mRNA, protein and cellular levels, and their long-term functional consequences are characterized, using the kidney as a readout. Here, we identify fetuin-A as an evolutionary conserved HIF target gene, and further investigate its role using fetuin-A KO animals and an adult model of ischemia-reperfusion injury. Beyond its role as systemic calcification inhibitor, fetuin-A emerges as a multifaceted protective factor that locally counteracts calcification, modulates macrophage polarization, and attenuates inflammation and fibrosis, thus preserving kidney function. Our study paves the way to therapeutic approaches mitigating mineral stress-induced inflammation and damage, principally applicable to all soft tissues.


Conflict of interest statement

The University of Bern has filed a European patent on behalf of U.H.-D. and S. Rudloff with application number: EP20162490. The patent relates to use of fetuin-A in treating renal disorders. The other authors declare no competing interests.

Figures

Fig. 1
Fig. 1. Chronic fetal hypoxia induces intrauterine growth restriction in mice.
a Experimental setup and time points of analysis. b Mean relative daily food intake shown for all dams until start of hypoxia (arrow), thereafter normoxic dams (black dotted line) or hypoxic dams (bold dark gray line) are separated. During whole gestation, normoxic dams consumed 292.2% of their body weight, while hypoxic mice ate 267%. This corresponds to 91.4% of the food consumed by normoxic mice. Asterisks denote significance (day 16 and 17 P < 0.0001, day 18 P = 0.0398). c Mean relative daily maternal weight gain shown for all dams until the start of intervention (arrow), thereafter normoxic dams (black dotted line), hypoxic dams (bold dark gray line), or Cc dams (dashed light gray line) are separated. Significance is denoted by large asterisks (normoxia vs. hypoxia: day 16 and 17 P < 0.0001), small asterisks (normoxia vs. Cc: day 16 P = 0.0002, day 17 P = 0.0012, day 18 P = 0.0082) or # (hypoxia vs. Cc: day 16 P < 0.0001, day 18 P = 0.0007). d Fetal mass shown as mean ± SEM. N = fetuses. Ordinary one-way ANOVA with Tukey’s multiple comparison test. e Number of nephrons per E18.5 kidney determined by staining for the glomerular marker nephrin shown as mean ± SEM. N = fetal kidneys. Unpaired 2-sided t-test with Welch’s correction. f Survival of normoxic and hypoxic pups. Mantel-Cox log-rank test. g Mean postnatal weight of hypoxic offspring (Ahsg KO—bold gray line, wild-type-thin gray line) and normoxic offspring (Ahsg KO—bold black dotted line, wild-type—thin black dotted line). KOs weighed less than wild-types, catch-up growth was observed for hypoxic offspring during the third week after birth. Gray circles denote significance between hypoxic offspring, white circles between normoxic offspring, large asterisks between KOs, and small asterisks between wild-types. P-values are listed in Supplementary Table 8. Individual P-values are denoted above the comparison lines (d, e). N = dams (b, c) or pups (f, g) can be derived from Source Data. Multiple 2-sided t-tests (b, c, g). (****P < 0.0001). Source data are provided as a Source Data file.
Fig. 2
Fig. 2. Hypoxia-induced gene expression in the kidney.
a Hierarchical clustering of cDNA microarray data comparing the renal gene expression profiles of hypoxic (Hy), normoxic (No), and caloric control (Cc) group E18.5 fetuses (N = 3 per experimental condition). Orange indicates induction, blue repression. Clustering was performed for genes with at least 1.3-fold regulation of hypoxic vs. both normoxic controls; 1way ANOVA; P < 0.05. b, c Relative mRNA values of Ahsg (b) or Apoc2 (c) in E18.5 kidneys (circles) or liver samples (squares) shown as mean ± SEM. N = fetal organs. Kidney and liver samples are analyzed separately. Note the logarithmic scale on the y-axis. d, e Serum fetuin-A levels assessed by ELISA are presented as mean and ± SEM. N = serum samples. No significant changes were observed among normoxic (No), hypoxic (Hy), or caloric control (Cc) E18.5 fetuses (d), nor for their mothers (e). Ordinary one-way ANOVA with Tukey’s multiple comparison test (be). Individual P-values are denoted above the comparison lines (be). (***P < 0.001; **P < 0.01). Source data are provided as a Source Data file.
Fig. 3
Fig. 3. Fetal hypoxia induces fetuin-A expression in the proximal tubulus.
ah Fetuin-A staining on E18.5 kidney sections of normoxic (a, b, e, f) or hypoxic (c, d, g, h), wild type (ad) or Clcn5 KO (eh) fetuses. Arrowheads indicate intraluminal fetuin-A staining that results from the impaired endocytosis of low molecular weight proteins in the PT of Clcn5 KO mice (f, h). ix Immunofluorescence staining of the indicated nephron segment marker proteins (red) and fetuin-A (green) on E18.5 kidney sections. PT, proximal tubulus (il); TAL, thick ascending limb (mp); DCT, distal convoluted tubulus (qt); CD, collecting duct (ux). Images are representative of at least three independent antibody stainings (ax). Scale bar = 50 µm (ax), except overview images for which the scale bar = 300 µm.
Fig. 4
Fig. 4. Hypoxia activates fetuin-A expression in vitro.
a Depiction of the potential HREs of mouse Ahsg that were used to generate the luciferase reporter gene constructs (1) to (8). Mutated HREs are shown in blue. b Mean ± SEM of luciferase activity in NRK cells individually transfected with the reporter constructs depicted in a, showing the fold-change in light emission between hypoxic and normoxic culture conditions. Each transfection condition is compared to the empty vector control (pGL3). N = independent experiments. Ordinary one-way ANOVA with Dunnett’s multiple comparisons test. c Expression of fetuin-A and vimentin in primary mouse proximal tubular cells (pPTCs) isolated from four different mice cultured under normoxic or hypoxic conditions. Images are representative of two independent Western blots. Uncropped blots in Source Data. d Relative mRNA expression levels of collagens (Col1a1, Col3a1, and Col6a1), α-smooth muscle actin (Acta2), fibronectin (Fn1), and vimentin (Vim) in kidneys from normoxic (white circles) or hypoxic fetuses (gray circles). Data is shown as mean ± SEM. N = fetal kidneys. Unpaired 2-sided t-test (with Welch’s correction for Col1a1 and Fn1). Individual P-values are denoted above the comparison lines. (****P < 0.0001; **P < 0.01). Source data are provided as a Source Data file.
Fig. 5
Fig. 5. Fetuin-A deficiency aggravates CKD progression in hypoxic IUGR kidneys.
a, b Decline of renal function in adult hypoxic offspring showed additive effects of hypoxia and fetuin-A deficiency. The decline in GFR was indistinguishable between the sexes with the greatest functional reduction in hypoxic Ahsg KO animals (a). The incline in proteinuria (protein/creatinine ratio) was more pronounced in males than in females. For both sexes, hypoxic Ahsg KO animals had the highest ratios (b). Male and female samples are analyzed separately. ce Relative mRNA expression levels of Col1a1 (c), Col3a1 (d), and Col6a1 (e) were markedly enhanced in kidneys of hypoxic Ahsg KO offspring. fi Histological depiction of collagen using picrosirius red (f, h) or Masson’s trichrome staining (g, i) showed a stronger, more intricate pattern on kidney sections of hypoxic Ahsg KO offprings compared to controls. Images are representative of at least three independent experiments. Scale bar = 100 µm. j Primary proximal tubular cells (pPTCs) isolated from two different wt or Ahsg KO mice exhibit enhanced expression of fibronectin and α-smooth muscle actin (α-SMA) protein upon culture in hypoxic conditions. Images are representative of three independent Western blots. Uncropped blots in Source Data. Data were analyzed from N = hypoxic or normoxic offspring and are presented as mean ± SEM (ae). Ordinary one-way ANOVA with Dunnett’s multiple comparisons test (ab) or Ordinary one-way ANOVA with Tukey’s multiple comparisons test (ce). Individual P-values are denoted above the comparison lines (b, c, e). (****P < 0.0001; ***P < 0.001; **P < 0.01). Source data are provided as a Source Data file.
Fig. 6
Fig. 6. Fetuin-A attenuates hypoxia-induced expression of fibrotic markers.
a, b Fetuin-A supplementation (downward pointing triangles) attenuated the hypoxia-induced expression of the fibrotic markers Acta2 (a) or Col3a1 (b) in pPTCs. Wt and Ahsg KO samples are analyzed separately. Unpaired two-tailed t-test with Welch’s correction (only for comparison of normoxic wt and normoxic Ahsg KO samples). c, d BSA supplementation (upward pointing triangles), did not reduce the expression of Acta2 (c) or Col3a1 (d) in pPTCs. e Fetuin-A supplementation also reduced the expression of fibronectin and collagen type I (Col1a1) protein in pPTCs. Images are representative of two Western blots. Uncropped blots in Source Data. f Relative mRNA expression levels of Tgfb1 shown as mean ± SEM were markedly enhanced in kidneys of hypoxic offspring, regardless of genotype. N = hypoxic or normoxic offspring. g TGF-β1 treatment and hypoxia had an additive effect on the phosphorylation of Smad3 in pPTCs. Images are representative of three Western blots. Uncropped blots in Source Data. h Quantification of Smad3 activation shown in g. N = three independent Western blots. Ordinary one-way ANOVA (Fisher’s LSD test). Data were analyzed from N = pPTCs derived from kidneys of wt or Ahsg KO mice and are presented as mean ± SEM (ad). Ordinary one-way ANOVA with Tukey’s multiple comparisons test (ad, f). Individual P-values are denoted above the comparison lines (ad, f, h). (****P < 0.0001; ***P < 0.001; **P < 0.01). Source data are provided as a Source Data file.
Fig. 7
Fig. 7. Fetuin-A mitigates infiltration and polarization of pro-inflammatory M1 macrophages.
ad Under normoxic conditions (a, b), the majority of renal macrophages exhibits a F4/80hiCD11blow phenotype, indicating resident macrophages. The number of these cells was generally reduced under hypoxic conditions. Under hypoxic conditions (c, d), the cell count of infiltrating macrophages (F4/80lowCd11bhi) was increased. Lack of fetuin-A even more stimulated the infiltration of macrophages into hypoxic fetal kidneys (d). Images are representative of 3 (bd) or 4 (a) sorted kidneys. e Quantification of resident macrophages shown in ad. Unpaired two-tailed t-test (for comparison of normoxic and hypoxic condition). f Quantification of infiltrating macrophages shown in ad. Unpaired two-tailed t-test with Welch’s correction (for comparison of normoxic and hypoxic condition). gj Under normoxic conditions (g, h), the majority of renal macrophages exhibits a M2 CD206+ anti-inflammatory phenotype (depicted in the upper two quadrants). Hypoxic conditions (i, j) promoted the polarization of M1 CD206 pro-inflammatory macrophages (depicted in the lower two quadrants). This polarization is even more pronounced in fetal kidneys of Ahsg KO mice (j). Images are representative of three (hj) or four (g) sorted kidneys. k Quantification of the lower two quadrants (CD206 macrophages) of the FACS blots shown in gj. Unpaired two-tailed t-test with Welch’s correction (for comparison of normoxic and hypoxic condition). Data were analyzed from N = fetal kidneys and are presented as mean ± SEM (e, f, k). Ordinary one-way ANOVA with Tukey’s multiple comparisons test (e, f, k). Individual P-values are denoted above the comparison lines (e, f, k). (****P < 0.0001; ***P < 0.001; **P < 0.01). Source data are provided as a Source Data file.
Fig. 8
Fig. 8. Fetuin-A supplementation reduces the expression of fibrotic markers upon hypoxia-related injury.
ai Fetuin-A deficiency promotes accumulation of calcium mineral particles in hypoxic fetal kidneys. Calcium biominerals were detected by ATTO 488 fluorescently labeled fetuin-A (488-FA). Compared to normoxic or hypoxic wt mice, hypoxic Ahsg KO mice exhibited the strongest 488-FA staining intensity in the proximal tubulus (PT), indicative of an increased mineralized matrix turnover (ac). Arrowheads in f and i point towards granular staining pattern in the papilla and cortex, respectively, reflecting bulk accumulation of 488-FA in kidneys of hypoxic Ahsg KOs. Such granules were not detectable in wt samples (d, e, g, h). j, k Ischemia-reperfusion injury (IRI) induces calcium mineral particles in adult kidneys. A granular staining pattern indicative of bulk accumulation of 488-FA at sites of calcium deposits was only present in IRI kidneys (k), but not in controls (j). l, m Fetuin-A supplementation reduced the expression of the fibrotic markers Col1a1 (l) and Col3a1 (m) in IRI kidneys 5 days after injury. No effect is seen in mice treated with physiological saline solution (NaCl). Data were analyzed from N = kidneys and are presented as mean ± SEM. Ordinary one-way ANOVA with Dunnett’s multiple comparisons test. Individual P-values are denoted above the comparison lines. (****P < 0.0001; ***P < 0.001). Images are representative of at least three independent experiments (ak). Scale bar = 100 µm (ak). Source data are provided as a Source Data file.
Fig. 9
Fig. 9. Proposed model.
Fetuin-A (Ahsg) is a HIF target gene that locally protects the kidney from hypoxia-induced renal damage and functional deterioration. It is implicated in the clearance of calcifying nanoparticles, mitigation of inflammation, attenuation of fibrotic tissue remodeling, and polarization of macrophages. (I) In normoxia, liver-derived fetuin-A (green) locally binds calcium in mineral particles (light gray), inhibits their maturation and accumulation (dark gray). Macrophages exhibit an M2 anti-inflammatory phenotype (M2 MΦ, blue). (II) The relatively low abundance of fetuin-A-free calcium biominerals (dark red) in normoxic conditions is not sufficient to elicit a noticeable inflammatory response. The majority of macrophages is M2 polarized, only a small fraction shows a M1 pro-inflammatory phenotype (M1 MΦ, magenta). (III) In hypoxia, increased tissue damage leads to calcium mineral overload and a polarization shift towards M1 MΦ. However, local induction of fetuin-A (yellow) augments the clearance of calcium biominerals and keeps the polarization of M1 MΦ in check, thus preventing inflammation and fibrotic remodeling. (IV) Fetuin-A deficiency in an hypoxic environment leads to an unbalanced accumulation of calcium biominerals and their unchecked maturation (orange), which overwhelms the intrinsic clearing capacity of the tissue. This further promotes the polarization of pro-inflammatory M1 MΦ, and culminates in inflammation (red) and fibrotic tissue remodeling.

Similar articles

Cited by

References

    1. Barker DJ. The fetal and infant origins of adult disease. BMJ. 1990;301:1111. doi: 10.1136/bmj.301.6761.1111. - DOI - PMC - PubMed
    1. Ducsay CA, et al. Gestational hypoxia and developmental plasticity. Physiol. Rev. 2018;98:1241–1334. doi: 10.1152/physrev.00043.2017. - DOI - PMC - PubMed
    1. Zeve D, Regelmann MO, Holzman IR, Rapaport R. Small at birth, but how small? the definition of SGA revisited. Horm. Res. Paediatr. 2016;86:357–360. doi: 10.1159/000449275. - DOI - PubMed
    1. Reyes, L. & Mañalich, R. Long-term consequences of low birth weight. Kidney Int. Suppl, 68, S107–S111 (2005). - PubMed
    1. Ergaz Z, Avgil M, Ornoy A. Intrauterine growth restriction-etiology and consequences: what do we know about the human situation and experimental animal models? Reprod. Toxicol. 2005;20:301–322. doi: 10.1016/j.reprotox.2005.04.007. - DOI - PubMed

Publication types

MeSH terms

Substances