Single-cell lineages reveal the rates, routes, and drivers of metastasis in cancer xenografts
- PMID: 33479121
- PMCID: PMC7983364
- DOI: 10.1126/science.abc1944
Single-cell lineages reveal the rates, routes, and drivers of metastasis in cancer xenografts
Abstract
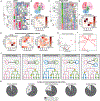
Detailed phylogenies of tumor populations can recount the history and chronology of critical events during cancer progression, such as metastatic dissemination. We applied a Cas9-based, single-cell lineage tracer to study the rates, routes, and drivers of metastasis in a lung cancer xenograft mouse model. We report deeply resolved phylogenies for tens of thousands of cancer cells traced over months of growth and dissemination. This revealed stark heterogeneity in metastatic capacity, arising from preexisting and heritable differences in gene expression. We demonstrate that these identified genes can drive invasiveness and uncovered an unanticipated suppressive role for KRT17 We also show that metastases disseminated via multidirectional tissue routes and complex seeding topologies. Overall, we demonstrate the power of tracing cancer progression at subclonal resolution and vast scale.
Copyright © 2021 The Authors, some rights reserved; exclusive licensee American Association for the Advancement of Science. No claim to original U.S. Government Works.
Figures


Comment in
-
Single-cell recording of metastasis.Nat Methods. 2021 Mar;18(3):231. doi: 10.1038/s41592-021-01095-6. Nat Methods. 2021. PMID: 33674798 No abstract available.
Similar articles
-
Comparative use of CRISPR and RNAi to modulate integrin α3β1 in triple negative breast cancer cells reveals that some pro-invasive/pro-metastatic α3β1 functions are independent of global regulation of the transcriptome.PLoS One. 2021 Jul 16;16(7):e0254714. doi: 10.1371/journal.pone.0254714. eCollection 2021. PLoS One. 2021. PMID: 34270616 Free PMC article.
-
Obligate progression precedes lung adenocarcinoma dissemination.Cancer Discov. 2014 Jul;4(7):781-9. doi: 10.1158/2159-8290.CD-13-0862. Epub 2014 Apr 16. Cancer Discov. 2014. PMID: 24740995 Free PMC article.
-
NOTCH3 expression is linked to breast cancer seeding and distant metastasis.Breast Cancer Res. 2018 Sep 4;20(1):105. doi: 10.1186/s13058-018-1020-0. Breast Cancer Res. 2018. PMID: 30180881 Free PMC article.
-
Single-Cell RNA Sequencing in Lung Cancer: Revealing Phenotype Shaping of Stromal Cells in the Microenvironment.Front Immunol. 2022 Jan 19;12:802080. doi: 10.3389/fimmu.2021.802080. eCollection 2021. Front Immunol. 2022. PMID: 35126365 Free PMC article. Review.
-
Metastatic models of human cancer xenografted in the nude mouse: the importance of orthotopic transplantation.J Cell Biochem. 1994 Sep;56(1):4-8. doi: 10.1002/jcb.240560103. J Cell Biochem. 1994. PMID: 7806591 Review.
Cited by
-
Recent Advances and Future Prospects in Immune Checkpoint (ICI)-Based Combination Therapy for Advanced HCC.Cancers (Basel). 2021 Apr 18;13(8):1949. doi: 10.3390/cancers13081949. Cancers (Basel). 2021. PMID: 33919570 Free PMC article. Review.
-
Signaling levels mold the RAS mutation tropism of urethane.Elife. 2021 May 17;10:e67172. doi: 10.7554/eLife.67172. Elife. 2021. PMID: 33998997 Free PMC article.
-
Simulation of CRISPR-Cas9 editing on evolving barcode and accuracy of lineage tracing.Sci Rep. 2024 Aug 19;14(1):19213. doi: 10.1038/s41598-024-70154-7. Sci Rep. 2024. PMID: 39160220 Free PMC article.
-
In vivo growth of subclones derived from Lewis lung carcinoma is determined by the tumor microenvironment.Am J Cancer Res. 2022 Nov 15;12(11):5255-5270. eCollection 2022. Am J Cancer Res. 2022. PMID: 36504888 Free PMC article.
-
Theoretical guarantees for phylogeny inference from single-cell lineage tracing.Proc Natl Acad Sci U S A. 2023 Mar 21;120(12):e2203352120. doi: 10.1073/pnas.2203352120. Epub 2023 Mar 16. Proc Natl Acad Sci U S A. 2023. PMID: 36927151 Free PMC article.
References
-
- Turajlic S, Swanton C, Metastasis as an evolutionary process. Science. 352, 169–175 (2016). - PubMed
-
- Nowell PC, The clonal evolution of tumor cell populations. Science. 194, 23–28 (1976). - PubMed
-
- Brannon AR, Vakiani E, Sylvester BE, Scott SN, McDermott G, Shah RH, Kania K, Viale A, Oschwald DM, Vacic V, Emde A-K, Cercek A, Yaeger R, Kemeny NE, Saltz LB, Shia J, D’Angelica MI, Weiser MR, Solit DB, Berger MF, Comparative sequencing analysis reveals high genomic concordance between matched primary and metastatic colorectal cancer lesions. Genome Biol. 15, 454 (2014). - PMC - PubMed
Publication types
MeSH terms
Substances
Grants and funding
- U19 AI090023/AI/NIAID NIH HHS/United States
- K08 CA222625/CA/NCI NIH HHS/United States
- T32 GM067547/GM/NIGMS NIH HHS/United States
- R01 DA036858/DA/NIDA NIH HHS/United States
- F32 GM125247/GM/NIGMS NIH HHS/United States
- R01 CA204302/CA/NCI NIH HHS/United States
- U54 CA224081/CA/NCI NIH HHS/United States
- RM1 HG009490/HG/NHGRI NIH HHS/United States
- HHMI/Howard Hughes Medical Institute/United States
- R01 CA211052/CA/NCI NIH HHS/United States
- R01 CA231300/CA/NCI NIH HHS/United States
- R01 CA169338/CA/NCI NIH HHS/United States
LinkOut - more resources
Full Text Sources
Other Literature Sources
Medical
Molecular Biology Databases
Research Materials
Miscellaneous

