

Systematic alteration of in vitro metabolic environments reveals empirical growth relationships in cancer cell phenotypes
- PMID: 33472066
- PMCID: PMC7877896
- DOI: 10.1016/j.celrep.2020.108647
Systematic alteration of in vitro metabolic environments reveals empirical growth relationships in cancer cell phenotypes
Abstract
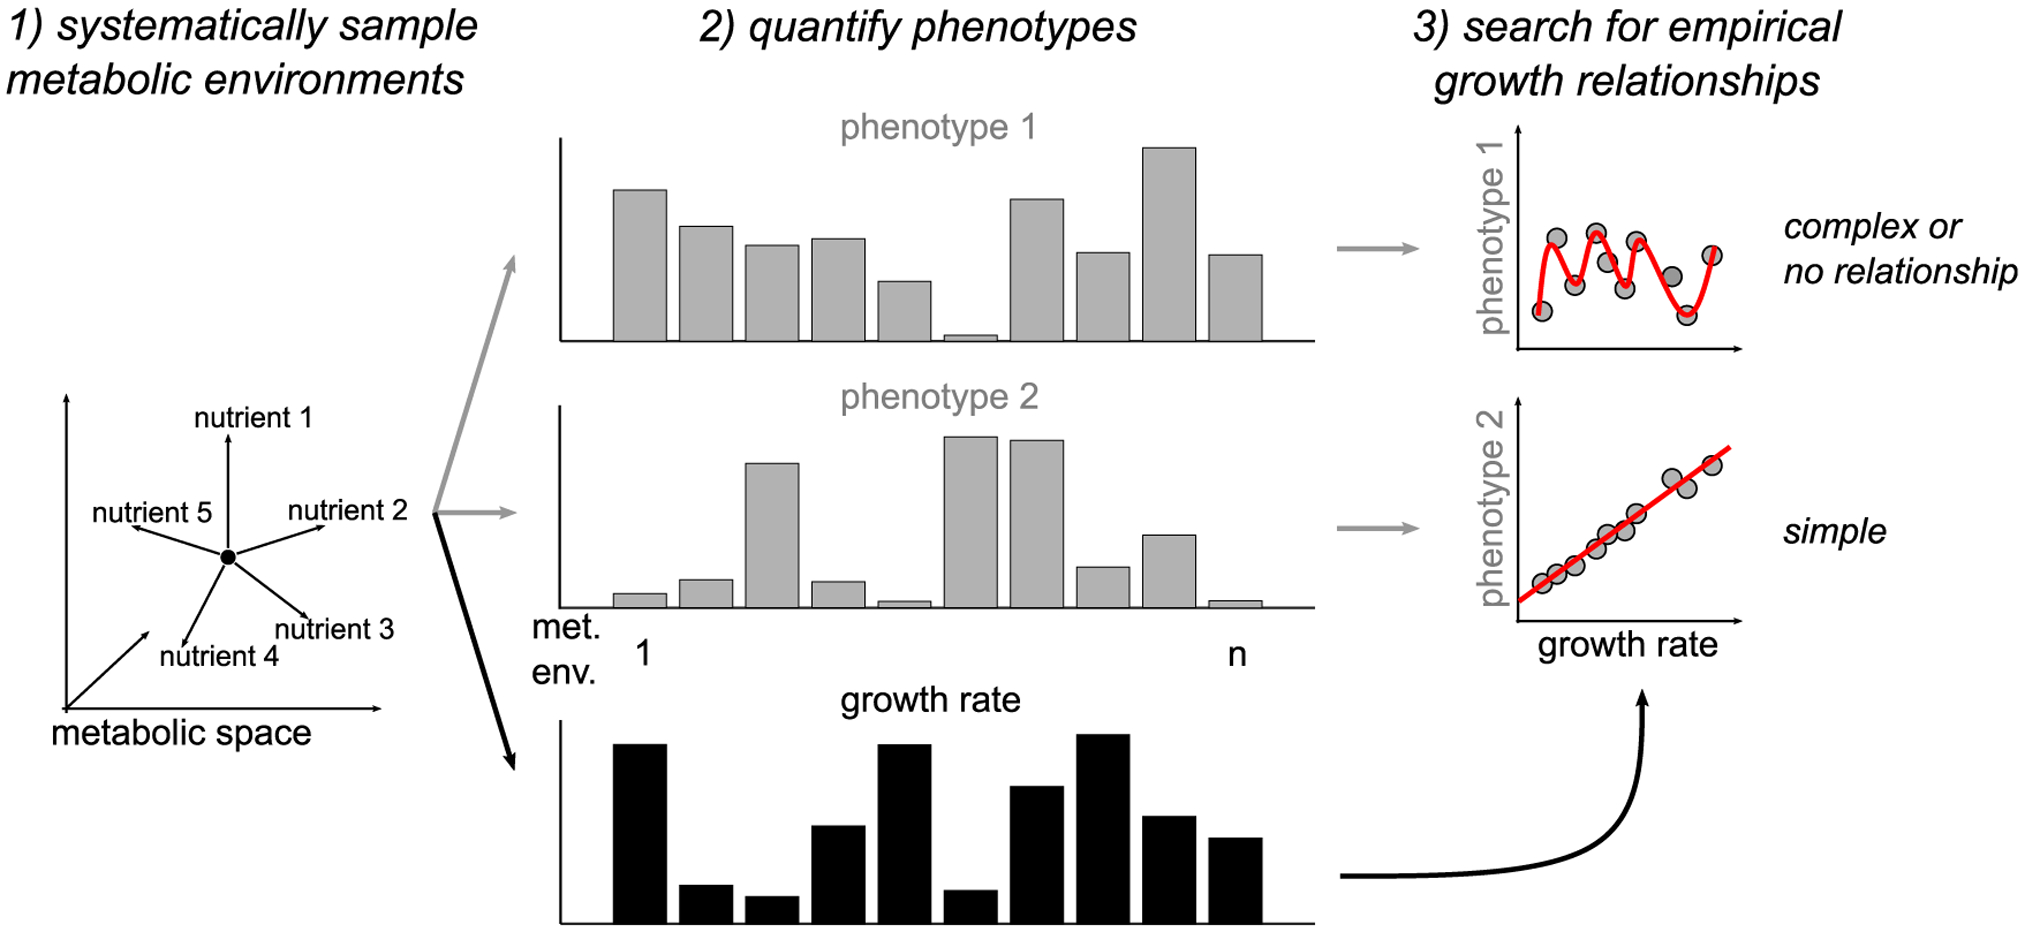
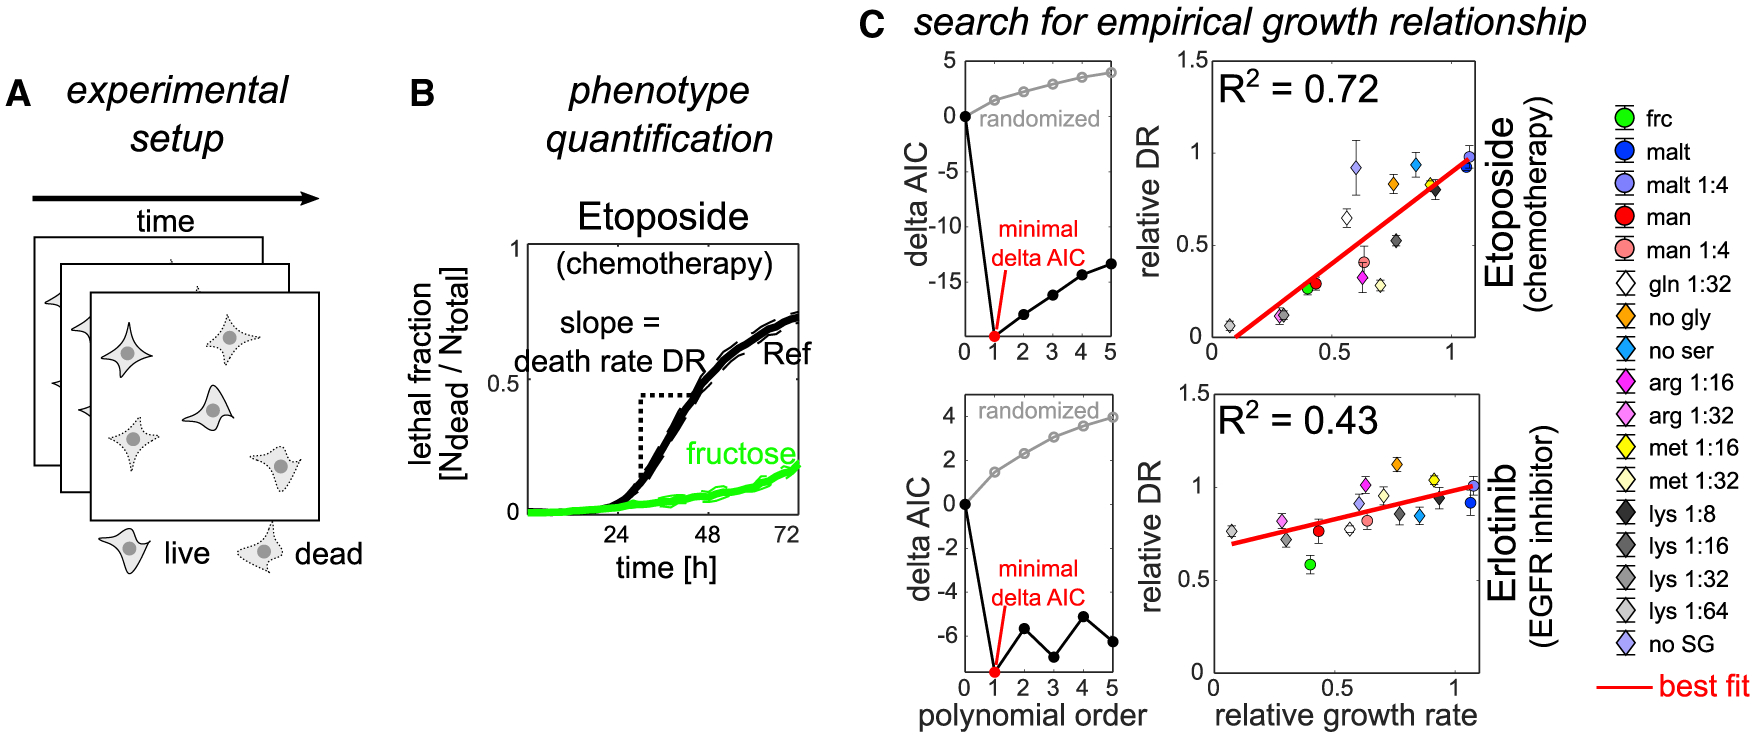
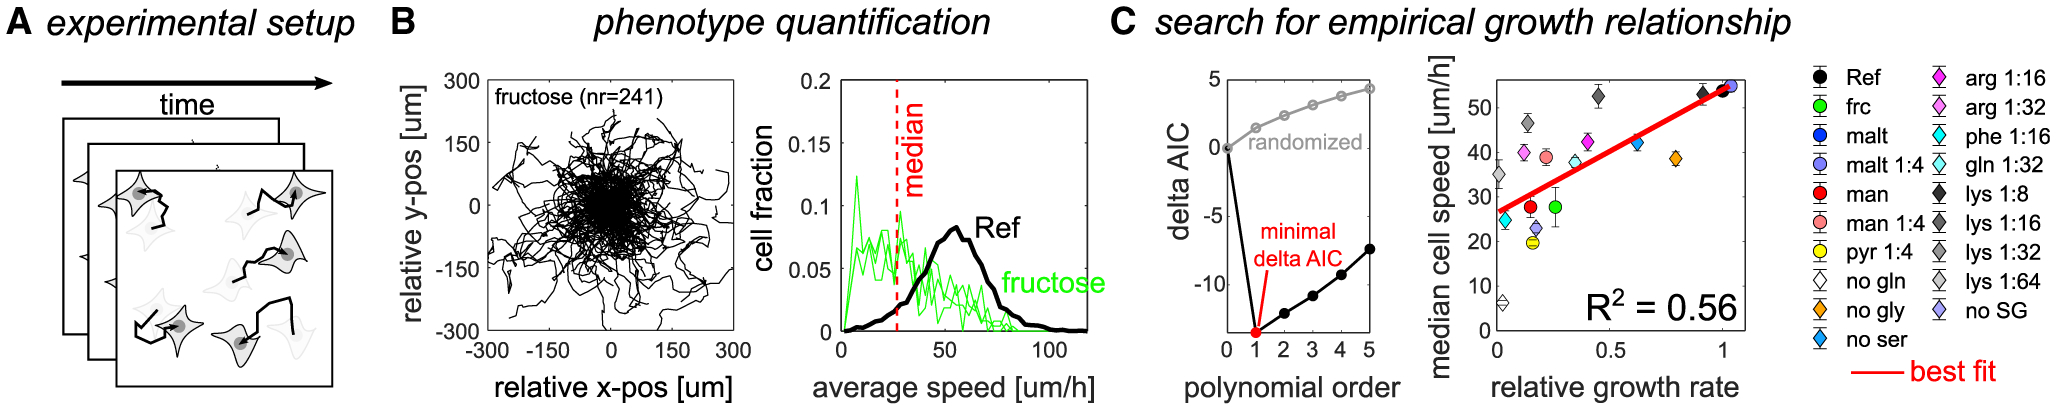
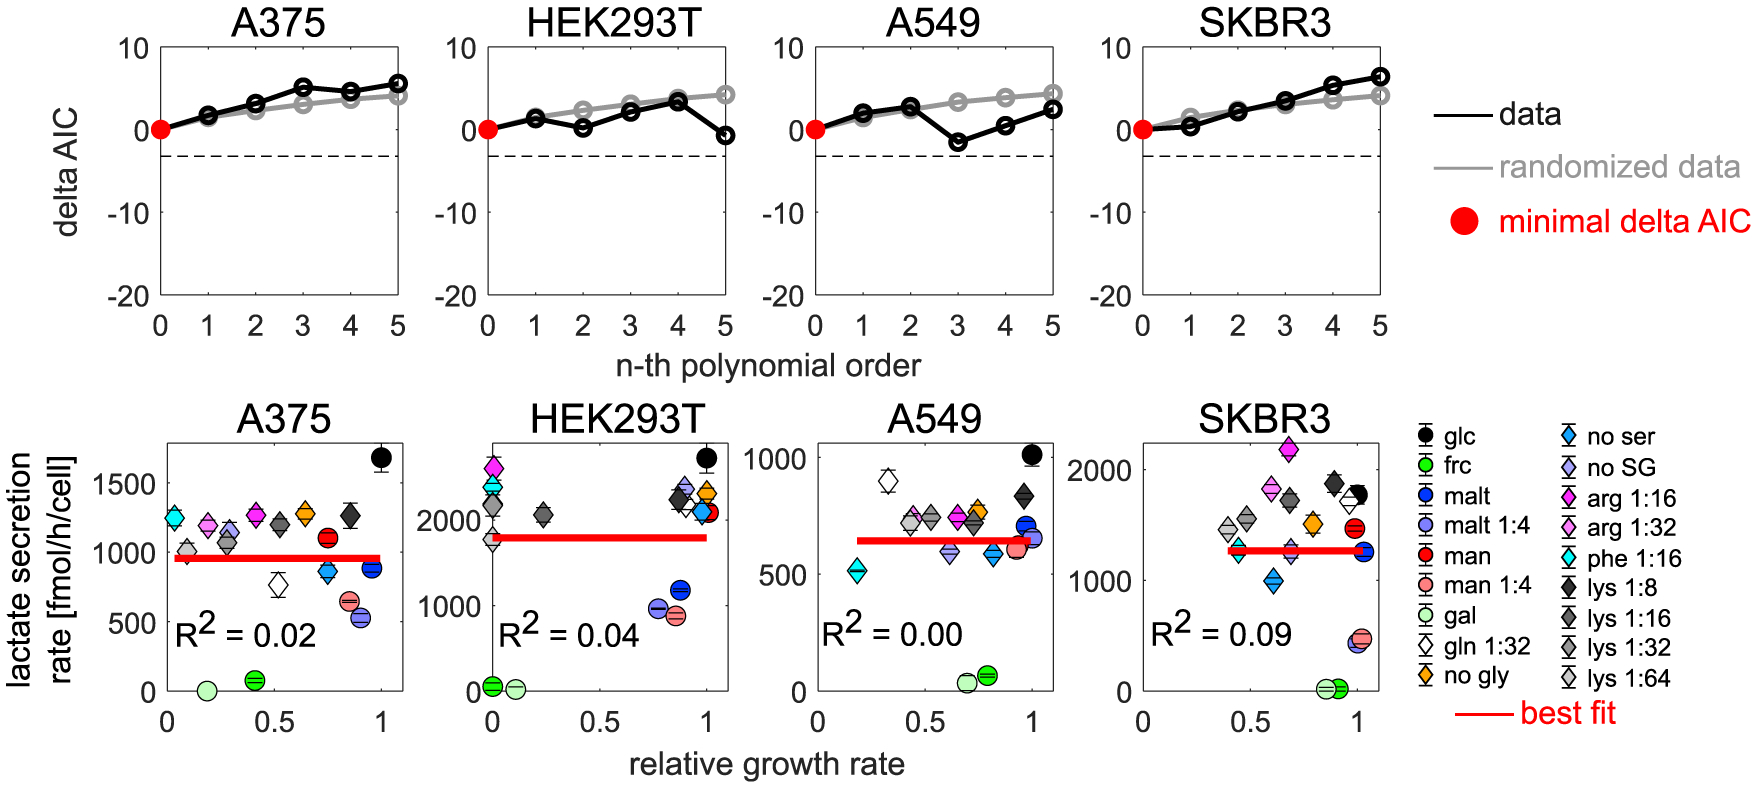
Cancer cells, like microbes, live in complex metabolic environments. Recent evidence suggests that microbial behavior across metabolic environments is well described by simple empirical growth relationships, or growth laws. Do such empirical growth relationships also exist in cancer cells? To test this question, we develop a high-throughput approach to extract quantitative measurements of cancer cell behaviors in systematically altered metabolic environments. Using this approach, we examine relationships between growth and three frequently studied cancer phenotypes: drug-treatment survival, cell migration, and lactate overflow. Drug-treatment survival follows simple linear growth relationships, which differ quantitatively between chemotherapeutics and EGFR inhibition. Cell migration follows a weak grow-and-go growth relationship, with substantial deviation in some environments. Finally, lactate overflow is mostly decoupled from growth rate and is instead determined by the cells' ability to maintain high sugar uptake rates. Altogether, this work provides a quantitative approach for formulating empirical growth laws of cancer.
Keywords: cancer; growth law; metabolic environment; metabolism.
Copyright © 2021 The Authors. Published by Elsevier Inc. All rights reserved.
Conflict of interest statement
Declaration of interests The authors declare no competing interests.
Figures


Similar articles
-
Bacterial Evolution in High-Osmolarity Environments.mBio. 2020 Aug 4;11(4):e01191-20. doi: 10.1128/mBio.01191-20. mBio. 2020. PMID: 32753494 Free PMC article.
-
The matrix environmental and cell mechanical properties regulate cell migration and contribute to the invasive phenotype of cancer cells.Rep Prog Phys. 2019 Jun;82(6):064602. doi: 10.1088/1361-6633/ab1628. Epub 2019 Apr 4. Rep Prog Phys. 2019. PMID: 30947151 Review.
-
Clonal analysis of neoplastic transformation in cultured diploid rat liver epithelial cells.Basic Life Sci. 1991;57:279-98; discussion 299-300. doi: 10.1007/978-1-4684-5994-4_24. Basic Life Sci. 1991. PMID: 1814288 Review.
-
Functional genomics reveals diverse cellular processes that modulate tumor cell response to oxaliplatin.Mol Cancer Res. 2011 Feb;9(2):173-82. doi: 10.1158/1541-7786.MCR-10-0412. Epub 2010 Dec 17. Mol Cancer Res. 2011. PMID: 21169384
-
Maximal sum of metabolic exchange fluxes outperforms biomass yield as a predictor of growth rate of microorganisms.PLoS One. 2014 May 27;9(5):e98372. doi: 10.1371/journal.pone.0098372. eCollection 2014. PLoS One. 2014. PMID: 24866123 Free PMC article.
Cited by
-
Nontargeted and targeted metabolomics approaches reveal the key amino acid alterations involved in multiple myeloma.PeerJ. 2022 Feb 9;10:e12918. doi: 10.7717/peerj.12918. eCollection 2022. PeerJ. 2022. PMID: 35186493 Free PMC article.
-
Shaping bacterial gene expression by physiological and proteome allocation constraints.Nat Rev Microbiol. 2023 May;21(5):327-342. doi: 10.1038/s41579-022-00818-6. Epub 2022 Nov 14. Nat Rev Microbiol. 2023. PMID: 36376406 Free PMC article. Review.
-
Cell Population Growth Kinetics in the Presence of Stochastic Heterogeneity of Cell Phenotype.ArXiv [Preprint]. 2023 Oct 19:arXiv:2301.03782v2. ArXiv. 2023. Update in: J Theor Biol. 2023 Nov 7;575:111645. doi: 10.1016/j.jtbi.2023.111645. PMID: 37904742 Free PMC article. Updated. Preprint.
-
Resource allocation in mammalian systems.Biotechnol Adv. 2024 Mar-Apr;71:108305. doi: 10.1016/j.biotechadv.2023.108305. Epub 2024 Jan 11. Biotechnol Adv. 2024. PMID: 38215956 Review.
References
-
- Ast T, and Mootha VK (2019). Oxygen and mammalian cell culture: are we repeating the experiment of Dr. Ox? Nat. Metab 1, 858–860. - PubMed
-
- Atkins RJ, Stylli SS, Kurganovs N, Mangiola S, Nowell CJ, Ware TM, Corcoran NM, Brown DV, Kaye AH, Morokoff A, et al. (2019). Cell quiescence correlates with enhanced glioblastoma cell invasion and cytotoxic resistance. Exp. Cell Res 374, 353–364. - PubMed
-
- Baguley BC, Marshall ES, Whittaker JR, Dotchin MC, Nixon J, McCrystal MR, Finlay GJ, Matthews JHL, Holdaway KM, and van Zijl P (1995). Resistance mechanisms determining the in vitro sensitivity to paclitaxel of tumour cells cultured from patients with ovarian cancer. Eur. J. Cancer 31A, 230–237. - PubMed
Publication types
MeSH terms
Grants and funding
LinkOut - more resources
Full Text Sources
Other Literature Sources
Research Materials
Miscellaneous
