. 2021 Jan 20;17(1):e1009231.
doi: 10.1371/journal.ppat.1009231. eCollection 2021 Jan.

Phase separation and DAXX redistribution contribute to LANA nuclear body and KSHV genome dynamics during latency and reactivation

Affiliations

Phase separation and DAXX redistribution contribute to LANA nuclear body and KSHV genome dynamics during latency and reactivation

Olga Vladimirova et al. PLoS Pathog. .

Abstract

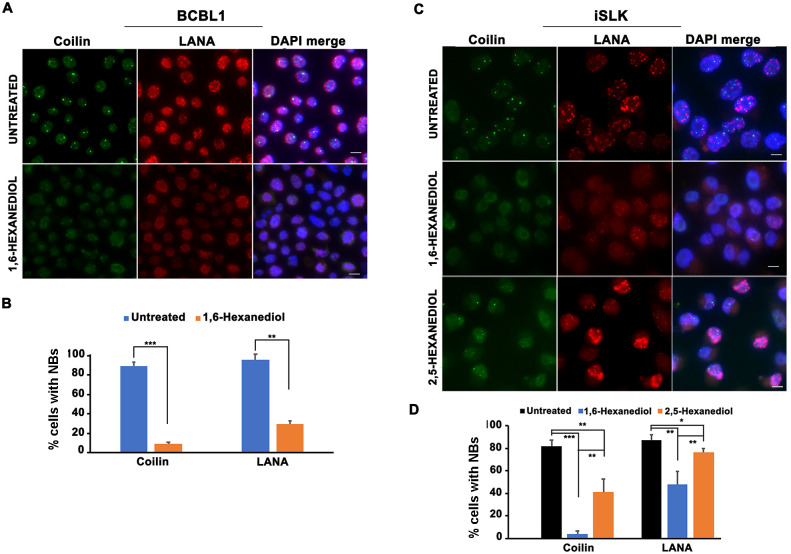
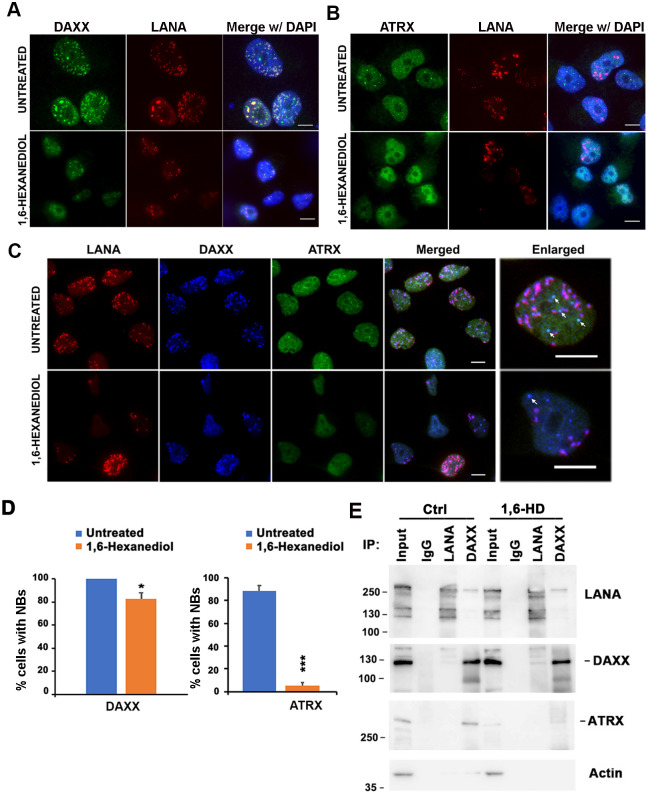
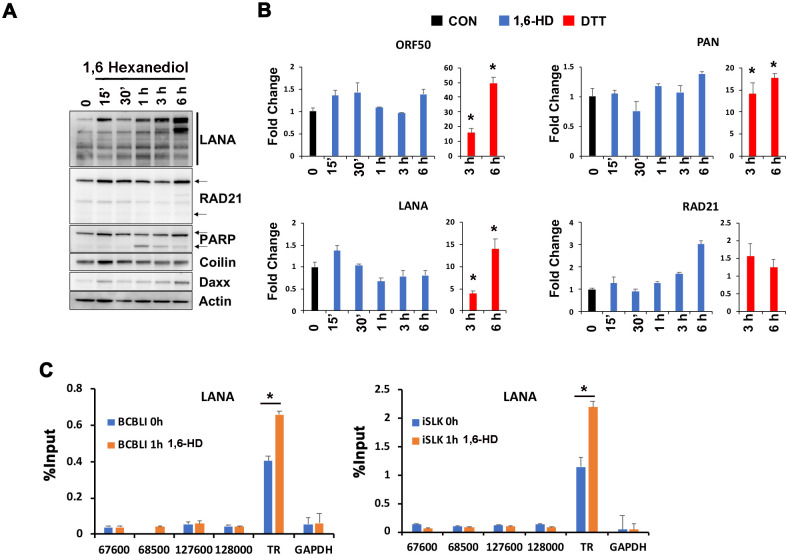
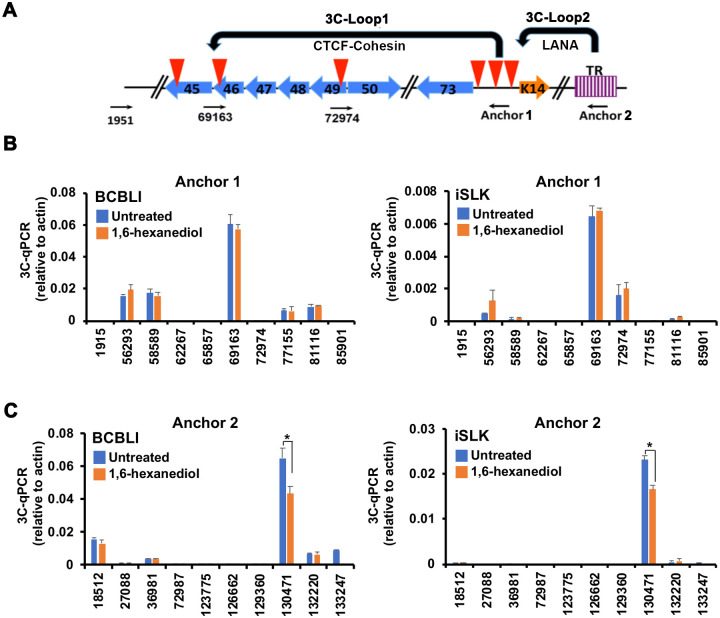
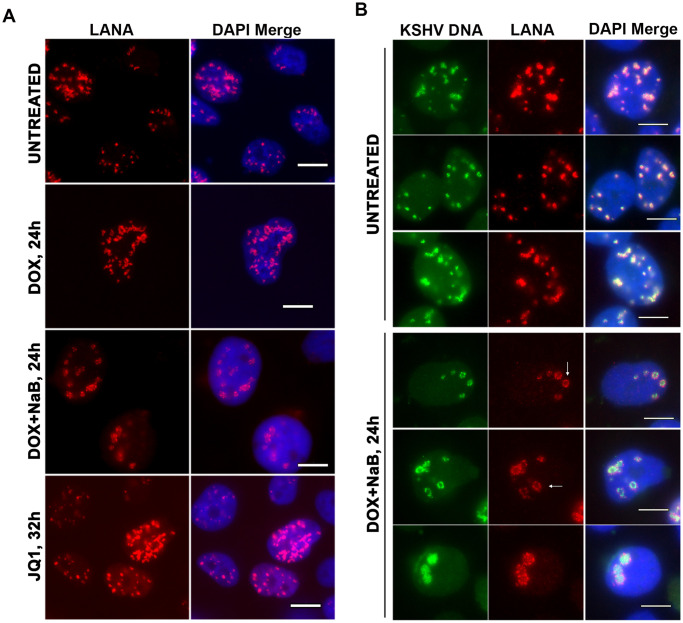
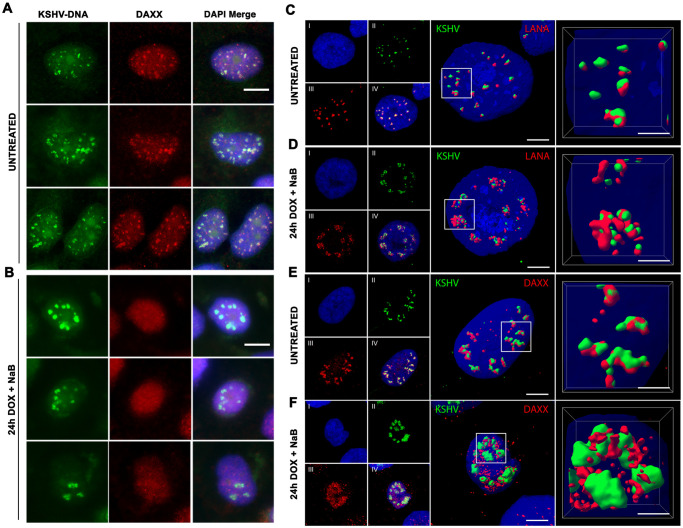
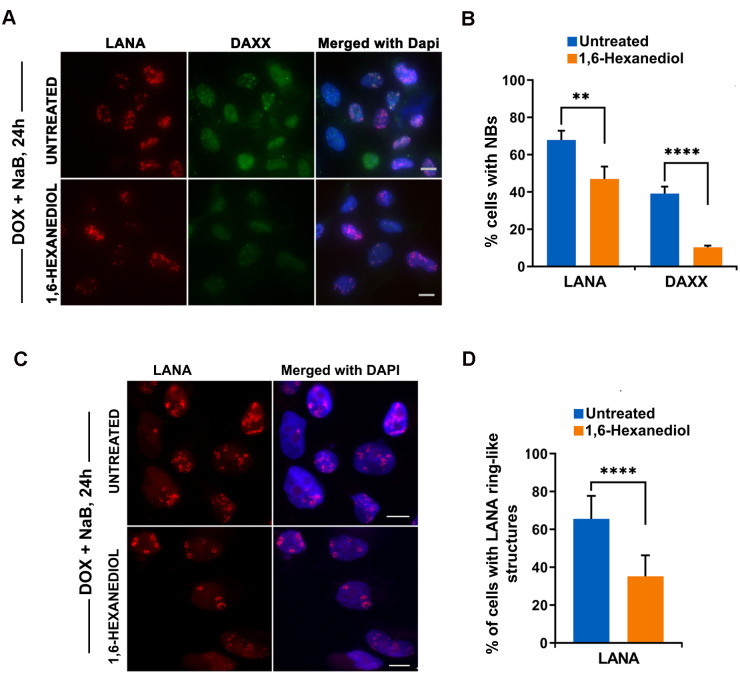
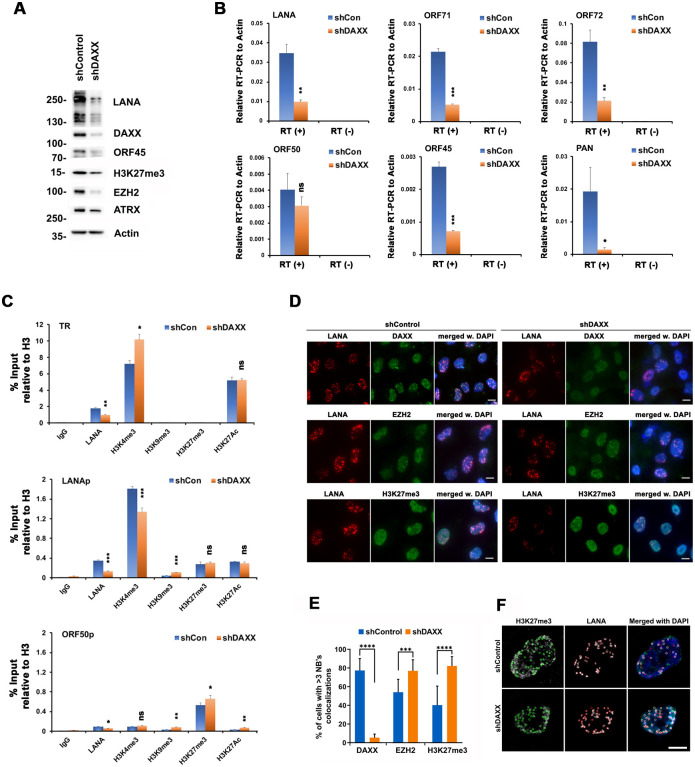
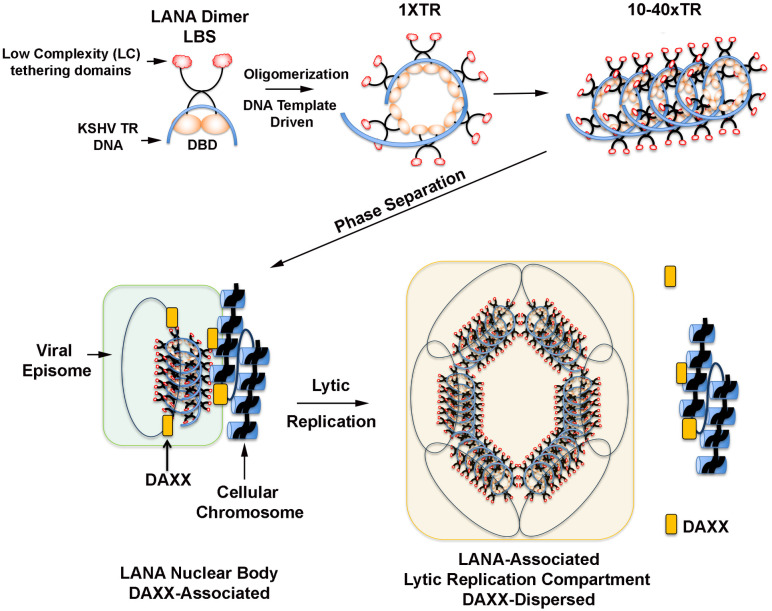
Liquid-liquid phase separation (LLPS) can drive formation of diverse and essential macromolecular structures, including those specified by viruses. Kaposi's Sarcoma-Associated Herpesvirus (KSHV) genomes associate with the viral encoded Latency-Associated Nuclear Antigen (LANA) to form stable nuclear bodies (NBs) during latent infection. Here, we show that LANA-NB formation and KSHV genome conformation involves LLPS. Using LLPS disrupting solvents, we show that LANA-NBs are partially disrupted, while DAXX and PML foci are highly resistant. LLPS disruption altered the LANA-dependent KSHV chromosome conformation but did not stimulate lytic reactivation. We found that LANA-NBs undergo major morphological transformation during KSHV lytic reactivation to form LANA-associated replication compartments encompassing KSHV DNA. DAXX colocalizes with the LANA-NBs during latency but is evicted from the LANA-associated lytic replication compartments. These findings indicate the LANA-NBs are dynamic super-molecular nuclear structures that partly depend on LLPS and undergo morphological transitions corresponding to the different modes of viral replication.


Conflict of interest statement

I have read the journal’s policy and the authors of this manuscript have the following competing interests: PML is a founder and consultant for Vironika, LLC. All other authors have no Competing Interests declarations.

Figures

Fig 1
Fig 1. LANA-NBs are partially sensitive to LLPS disrupting agents.
A. BCBL1 cells untreated or treated for 10 min with 3.5% 1,6-Hexanediol were imaged by IF for Coilin (green), LANA (red) or DAPI (blue). Scale bar = 10 μm. B. BCBL1 cells treated as in panel A were quantified for >2 coilin or >4 LANA NBs. The bar graph represents means ± s.d, ** p value < 0.01, *** p value < 0.001 using two-tailed student t-test. C. iSLK RFP-LANA cells untreated or treated for 10 min with 3.5% 1, 6-Hexanediol or 2,5-Hexanediol were imaged by IF for Coilin (green), RFP-LANA (red) or DAPI (blue). Scale bar = 10 μm. D. iSLK RFP-LANA cells treated as in panel C were quantified for >2 coilin or >4 LANA-NBs. The bar graph represents means ± s.d, * p value < 0.05, ** p value < 0.005, *** p value < 0.001 using two-tailed student t-test.
Fig 2
Fig 2. LLPS disrupting agent effects on DAXX and ATRX foci.
A. iSLK RFP-LANA cells untreated or treated for 10 min with 3.5% 1,6-Hexanediol were imaged by IF for DAXX (green), RFP-LANA (red) or DAPI (blue). Scale bar = 10 μm. B. iSLK RFP-LANA cells untreated or treated for 10 min with 3.5% 1,6-Hexanediol were imaged by IF for ATRX (green), RFP-LANA (red) or DAPI (blue). Scale bar = 10 μm. C. Same as in panel A, except combined imaging with RFP-LANA (red), DAXX (blue), and ATRX (green). In enlarged images, arrows indicate colocalizations of ATRX and DAXX foci, but lacking LANA. Scale bar = 10 μm. D. Quantification of DAXX (left) and ATRX (right) foci in cells treated as described in panels A and B, respectively. Error bars are s.d., * = p value <0.05, *** = p value <0.001, two-tailed t-test, relative to untreated cells. E. IP-Western analysis of iSLK RFP-LANA cells treated with 3.5% 1,6-Hexanediol or DMSO control for 1 hr. Protein complexes were immunoprecipitated by antibodies to LANA, DAXX, or control IgG, and assayed by Western with antibodies specific for LANA, DAXX, ATRX, or Actin, as indicated. Molecular weight markers are indicated in KDa, and input represents 10% of cell lysis used for each IP.
Fig 3
Fig 3. LLPS disrupting agent effects on KSHV transcription and LANA binding.
A. Immunoblotting of LANA, RAD21, PARP1, Coilin, DAXX and actin in BCBL1 cells exposed to 3.5% 1,6-Hexanediol for the indicated times. B. RT-qPCR for lytic transcripts ORF50, PAN and latent transcript LANA relative to cellular actin in BCBL1 cells treated as in panel A. The data are expressed as fold change of the treated versus untreated cells. C. BCBL1 and iSLK RFP-LANA cells treated for 1 hr with 3.5% 1,6-Hexanediol were assayed by ChIP for LANA or IgG. ChIP-qPCR primer positions indicated on x-axis are relative to KSHV genome. GAPDH primers were used as internal control. * p value < 0.05, two-tailed t-test.
Fig 4
Fig 4. LLPS disrupting agent effects on KSHV chromosome conformation.
A. Schematic of KSHV regulatory regions and primers used for 3C experiment with anchors for loop 1 (LANAp) or loop 2 (TR). Red arrowheads indicate previously mapped CTCF binding sites. B. BCBL1 and iSLK RFP-LANA cell lines treated for 1 hr with 3.5% 1,6-Hexanediol were assayed by 3C using anchor primer (Anchor 1) at latency control region (128,264) and acceptor primers at positions indicated on x-axis. 3C-qPCR relative to actin control is reported. C. BCBL1 and iSLK RFP-LANA cell lines treated as in panel B were assayed by 3C using anchor primer (Anchor 2) near TR (position 133872) and acceptor primers at positions indicated on x-axis. 3C-qPCR relative to actin control is reported. * p value < 0.05, two-tailed t-test.
Fig 5
Fig 5. Dynamic changes in LANA-NB morphology after lytic induction.
A. iSLK RFP-LANA cells untreated or induced by Dox or Dox+NaB for 24 h, or JQ1for 32 h were assayed by IF for RFP-LANA (red) and DAPI (blue). Scale bar = 10 μm. B. KSHV DNA FISH (green) combined with RFP-LANA IF (red) and DAPI (blue) in iSLK RFP-LANA cells untreated (top) or induced with Dox+NaB for 24h (lower panels). Scale bar = 10 μm. White arrows indicate examples of LANA ring-like structures.
Fig 6
Fig 6. Redistribution of DAXX from LANA-NB during lytic induction.
A-B. iSLK RFP-LANA cells untreated (A) or induced by Dox+NaB for 24 h (B) were imaged with KSHV-DNA FISH (green) or DAXX IF (red) and DAPI (blue). Scale bar = 10 μm. C-D. Confocal images and 3D reconstructions for iSLK RFP-LANA cells untreated (C) or induced by Dox+NaB (D) for 24h were imaged with KSHV DNA FISH (green), LANA IF (red) and DAPI (blue). Scale bar = 5 μm. E-F. Confocal images and 3D reconstructions of iSLK RFP-LANA cells untreated (E) or induced by Dox+NaB (F) for 24h were imaged with KSHV DNA FISH (green), DAXX IF (red) and DAPI (blue). Scale bar = 5 μm.
Fig 7
Fig 7. Sensitivity of lytic induced LANA ring-like structures to LLPS.
A. iSLK cells were induced with Dox+NaB for 24h and then untreated or treated with 3.5% 1,6-HD for 10 min followed by IF for RFP-LANA (red), DAXX (green) or DAPI (blue). Scale bar = 10 μm. B. Quantitation of DAXX or LANA foci for experiments represented by panel A. N = 200 cells, **** p < .001, ** p < .01 two-tailed student t-test. C. Same as in panel A, but IF for RFP-LANA (red) and DAPI (blue). Scale bar = 10 μm. D. Quantification of IF images represented by panel A for % of cells with LANA ring-like structures. N = 200 cells, ****p < .001, two-tailed student t-test.
Fig 8
Fig 8. Effects of shDAXX depletion on KSHV transcripts, epigenetics, and LANA-NBs.
A. Western blot analysis of iSLK RFP-LANA cells infected with lentiviruses encoding DAXX or control shRNAs for 6 days with antibodies specific for LANA, DAXX, ORF45, H3K27me3, EZH2, ATRX, or Actin, as indicated. Molecular weight markers are indicated in KDa. B. iSLK RFP-LANA cells treated as in panel A were assayed by RT-qPCR at Day 6 for KSHV latency-associated genes LANA, ORF71, ORF73 or lytic-associated genes ORF50, ORF45, PAN. The bar graph represents means ± s.d. from three independent DAXX depletion experiments. * p value <0.05, ** p <0.01, *** p < 0.005, ns not significant using two-tailed t-test. C. iSLK RFP-LANA cells infected with shCon or shDAXX for 6 days were assayed by ChIP using antibodies against IgG, LANA, histone H3K4me3, H3K9me3, H3K27me3, and H3K27Ac, and normalized to total H3 ChIP signal for each loci, as indicated. ChIPed DNA was examined by qPCR using primers for KSHV TR (top panel), LANA promoter (middle panel), or ORF50 promoter (bottom panel). Bar graph represents the average value of percentage of input relative to H3 for each ChIP from three independent PCR reactions (mean ± s.d.). * p value <0.05, ** p <0.01, *** p < 0.005, ns not significant using two-tailed t-test. D. iSLK RFP-LANA cells infected with shCon or shDAXX for 6 days were assayed by IF for RFP-LANA (red) and either DAXX (top), EZH2 (middle), or H3K27me3 (lower) in green, and merge with DAPI (blue). Scale bar = 10 μm. E. Quantification of IF images represented by panel D for % of cells with >5 colocalizations of RFP-LANA foci with either DAXX, EZH2, or H3K27me3 foci. N = 200 cells, ***p <0.005, ****p < .001, two-tailed student t-test. F. Example of computational analysis for quantifying colocalization of LANA and H3K27me3 foci. The colored circular outlines indicate the number of H3K27me3 (green) and RFP-LANA (red) foci. Bar scale = 10μm.
Fig 9
Fig 9. Model of LLPS-driven LANA-NB formation.
Dynamic LANA-NB structures form through the combined actions of the structured DNA binding domain (DBD), KSHV terminal repeat DNA templated oligomerization, and the low complexity, multivalent N-terminal domain interactions driving LLPS.

Similar articles

Cited by

References

    1. Cesarman E, Damania B, Krown SE, Martin J, Bower M, Whitby D. Kaposi sarcoma. Nat Rev Dis Primers. 2019;5(1):9. Epub 2019/02/02. 10.1038/s41572-019-0060-9 . - DOI - PMC - PubMed
    1. Chang Y, Moore P. Twenty years of KSHV. Viruses. 2014;6(11):4258–64. Epub 2014/11/12. 10.3390/v6114258 . - DOI - PMC - PubMed
    1. De Leo A, Calderon A, Lieberman PM. Control of Viral Latency by Episome Maintenance Proteins. Trends Microbiol. 2020;28(2):150–62. Epub 2019/10/19. 10.1016/j.tim.2019.09.002 . - DOI - PMC - PubMed
    1. Ballestas ME, Kaye KM. The latency-associated nuclear antigen, a multifunctional protein central to Kaposi’s sarcoma-associated herpesvirus latency. Future Microbiol. 2011;6(12):1399–413. Epub 2011/11/30. 10.2217/fmb.11.137 . - DOI - PMC - PubMed
    1. Uppal T, Jha HC, Verma SC, Robertson ES. Chromatinization of the KSHV Genome During the KSHV Life Cycle. Cancers (Basel). 2015;7(1):112–42. Epub 2015/01/17. 10.3390/cancers7010112 . - DOI - PMC - PubMed

Publication types

MeSH terms