. 2021 Mar;18(3):686-697.
doi: 10.1038/s41423-020-00600-9. Epub 2021 Jan 19.

Plasma membrane lipid scrambling causing phosphatidylserine exposure negatively regulates NK cell activation

Affiliations

Plasma membrane lipid scrambling causing phosphatidylserine exposure negatively regulates NK cell activation

Ning Wu et al. Cell Mol Immunol. 2021 Mar.

Abstract

One of the hallmarks of live cells is the asymmetric distribution of lipids across their plasma membrane. Changes in this asymmetry due to lipid "scrambling" result in phosphatidylserine exposure at the cell surface that is detected by annexin V staining. This alteration is observed during cell death processes such as apoptosis, and during physiological responses such as platelet degranulation and membrane repair. Previous studies have shown that activation of NK cells is accompanied by exposure of phosphatidylserine at the cell surface. While this response was thought to be indicative of ongoing NK cell death, it may also reflect the regulation of NK cell activation in the absence of cell death. Herein, we found that NK cell activation was accompanied by rapid phosphatidylserine exposure to an extent proportional to the degree of NK cell activation. Through enforced expression of a lipid scramblase, we provided evidence that activation-induced lipid scrambling in NK cells is reversible and does not lead to cell death. In contrast, lipid scrambling attenuates NK cell activation. This response was accompanied by reduced cell surface expression of activating receptors such as 2B4, and by loss of binding of Src family protein tyrosine kinases Fyn and Lck to the inner leaflet of the plasma membrane. Hence, lipid scrambling during NK cell activation is, at least in part, a physiological response that reduces the NK cell activation level. This effect is due to the ability of lipid scrambling to alter the distribution of membrane-associated receptors and kinases required for NK cell activation.

Keywords: Lipid scrambling; NK cell activation; Phosphatidylserine exposure; Signaling; TMEM16F.


Conflict of interest statement

A.V. received a contract from Bristol Myers-Squibb to study the mechanism of action of the anti-SLAMF7 monoclonal antibody elotuzumab in multiple myeloma. He was also a consultant for Boehringer-Ingelheim on the topic of the SIRPα-CD47 blockade in anticancer immunotherapy. The authors declare no competing interests.

Figures
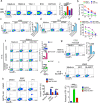
Fig. 1
Fig. 1
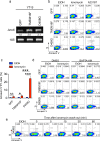
Plasma membrane lipid scrambling during NK cell activation by tumor target cells. a Annexin V and PI staining was performed on IL-2-activated mouse NK cells incubated with tumor target cells. NK cells without target cells (medium alone) were used as controls. Representative dot plots are shown on the left, and the statistics of annexin V+PI populations for 4 independent experiments are shown on the right. PI propidium iodide. b NK cell cytotoxicity induced in YAC-1, RMA-S, B16 and CMT-93 cells was assessed by 51Cr release assay. The data are representative of three independent experiments. Annexin V and PI staining was performed on YT-S cells activated or not with K562 (c) or HeLa (d) target cells, which express green fluorescent protein (GFP) alone or in combination with human CD48 (hCD48). Representative dot plots are shown on the left, and the statistics for three independent experiments are shown on the right. e YT-S cell cytotoxicity induced in K562 and HeLa cells expressing GFP or human CD48. The data are representative of two independent experiments. f Annexin V and PI staining was performed on YT-S cells expressing an empty vector alone (puromycin resistance marker; puro) or with wild-type mouse CD226 (mCD226) or the mCD226 tyrosine 319-to-phenylalanine 319 (Y319F) mutant, incubated or not with RMA-S expressing GFP alone or with mCD155. Representative dot plots are shown on the left, and the statistics for three independent experiments are shown on the right. g Annexin V and PI staining was performed on YT-S cells expressing mCD226 incubated with RMA-S cells expressing mCD155 with or without wortmannin [wort, 1 μM; dissolved in dimethyl sulfoxide (DMSO)]. DMSO alone was used as the control. Representative dot plots are shown on the left, and the statistics for four independent experiments are depicted on the right. h Annexin V and PI staining was performed on YT-S cells stimulated or not with K562 cells expressing hCD48, with or without 1,2-bis(2-aminophenoxy)ethane-N,N,N′,N′-tetraacetic acid tetrakis(acetoxymethyl ester) (BAPTA-AM; 100 μM in DMSO). Phorbol myristate acetate (PMA; 100 ng/ml) plus ionomycin (1 μM) (P + I) was used as a control. Representative dot plots are shown on the left, and the statistics for three independent experiments are shown on the right. i Annexin V and PI staining was performed on YT-S cells expressing empty vector (puro) or mSLAMF7 and incubated or not with K562 cells expressing GFP alone or with mSLAMF7. Representative dot plots are shown at the top, and statistics for three independent experiments are shown at the bottom. NS not significant; *p < 0.05; **p < 0.01; ***p < 0.001 (two-tailed Student’s t tests). The data are presented as the means ± s.e.m
Fig. 2
Fig. 2
Lipid scramblase TMEM16F causes transient and reversible PS exposure on NK cells. a Expression of human TMEM16F-encoding RNA (Ano6) in YT-S cells expressing GFP alone or in combination with wild-type TMEM16F or the aspartate 408-to-glycine 408 (D408G) TMEM16F mutant was measured by RT-PCR. 18S RNA was used as control. b, c Annexin V and PI staining was performed on YT-S cells expressing GFP alone or in combination with wild-type TMEM16F or D408G TMEM16F that were treated or not for 5 min with the calcium ionophore ionomycin [10 μM; in ethanol (EtOH)] or A23187 (10 μM in EtOH). Representative dot plots are shown in (b), while the statistics for seven independent experiments are shown in (c). d Same as (b), except that the cells were incubated or not with BAPTA-AM (100 μM). The data are representative of two independent experiments. e Same as (b), except that ionomycin was washed out, and the cells were incubated for the indicated periods at 37 °C in the culture medium. Representative of two independent experiments. NS not significant; *p < 0.05; **p < 0.01; ***p < 0.001 (two-tailed Student’s t tests). The data are presented as the means ± s.e.m
Fig. 3
Fig. 3
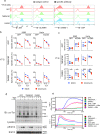
Enhanced PS exposure during NK cell activation is TMEM16F-dependent. a Anti-TMEM16F immunoblot (IB) of total cell lysates from YT-S cells expressing mouse D409G TMEM16F transfected either with control nontargeting siRNAs (siCT) or with siRNAs against mouse TMEM16F (siTMEM16F). β-actin was used as the loading control. b, c Annexin V and PI staining was performed on the cells described in (a) treated or not with ionomycin. Representative dot plots are shown in (b), while the statistics for four independent experiments are shown in (c). d, e Annexin V and PI staining was conducted with YT-S cells expressing GFP alone or in combination with wild-type TMEM16F or the aspartate 408-to-glycine 408 (D408G) TMEM16F mutant that were incubated or not with K562 cells expressing hCD48 or the combination of PMA (100 ng/ml) plus ionomycin (1 μM) (P + I). Representative dot plots are shown in (d), while statistics for three independent experiments are shown in (e). *p < 0.05; **p < 0.01; ***p < 0.001 (two-tailed Student’s t tests). The data are presented as the means ±  s.e.m
Fig. 4
Fig. 4
TMEM16F-triggered lipid scrambling reduces NK cell cytotoxicity and 2B4 signaling. a Expression of membrane receptors 2B4, SLAMF6, and DNAM-1, as well as adapter SAP, was determined by flow cytometry of YT-S cells expressing empty vector (GFP), wild-type TMEM16F, or the D408G TMEM16F mutant. For detection of SAP, the cells were permeabilized. Open histogram, isotype control antibody; filled histogram, specific antibody. Representative histograms of two independent experiments. b, c YT-S cells expressing GFP alone or in combination with wild-type TMEM16F or D408G TMEM16F were incubated for 6 h with K562 or HeLa cells expressing hCD48 in the presence or in the absence of ionomycin (1 μM) to activate TMEM16F. Cytotoxicity was measured by 51Cr release at the indicated effector:target (E:T) ratios. The extent of the cell lysis was indicated as the percentage of maximum 51Cr release. The data are presented as mean ± s.d. of duplicate samples. Representative cytotoxicity assays are shown in (b), while statistics for four independent experiments are depicted in (c). d The indicated YT-S derivatives were preincubated for 5 min at room temperature in the presence or in the absence of ionomycin (10 μM). They were then stimulated or not for 5 min at 37 °C with anti-2B4 antibodies C1.7 and the relevant secondary anti-mouse antibody. Total cell lysates were probed by immunoblotting with anti-phosphotyrosine (p-Tyr; top), anti-phospho-Erk1/2 (pErk1/2; middle) or anti-Erk1/2 (bottom) antibodies. The levels of phospho-Erk1/2 were measured and normalized according to the total Erk1/2 level. Representative blots of three independent experiments. e Calcium influx in the indicated YT-S cells stimulated or not with anti-2B4 antibodies. Calcium influx was determined by the indicated fluorescence ratio for Indo-1. Ionomycin served as the positive control. Representative histograms of three independent experiments. *p < 0.05; **p < 0.01; ***p < 0.001 (two-tailed Student’s t tests). The data are presented as the means ± s.e.m
Fig. 5
Fig. 5
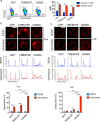
Loss of surface 2B4 and membrane dissociation of Src kinases during lipid scrambling. a The intensity of the 2B4 and annexin V staining was analyzed on YT-S derivatives treated with ionomycin (10 μM). Representative dot plots are on the left, while the statistics of the mean fluorescent intensity (MFI) of 2B4 in the annexin Vhigh versus the annexin Vlow populations from three independent experiments are depicted on the right. Cellular localization of Fyn (b) and Lck (c) in YT-S derivatives treated or not with ionomycin (10 μM) for 5 min at RT was determined by staining with the relevant antibodies and confocal microscopy. Representative images are shown in the top two panels, while profiles of the fluorescence as measured by ZEN software are shown in the middle two panels, and the statistics for multiple cells are shown in the bottom two panels. The data are from seven pictures for each condition, with 20–50 cells in each picture. The data are representative of two experiments. Scale bar is 10 μm. *p < 0.05; **p < 0.01; ***p < 0.001 (two-tailed Student’s t tests). The data are presented as the means ± s.e.m. The data are related to Fig. S1
Fig. 6
Fig. 6
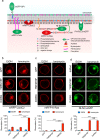
The loss of inner membrane acidic charges induced by lipid scrambling. a A depiction of the fluorescent probes used in Figs. 6 and 7 is shown. Cellular localization of mRFP-LactC2 (b), mRFP-K-Ras (c) and Nt-Src-eGFP (d) in YT-S derivatives treated or not with ionomycin (10 μM) for 5 min at RT was determined by confocal microscopy. Representative images are shown at the top, while the statistics for multiple cells are shown at the bottom. The data are from 7 (b, c) or 10 (d) pictures for each condition, with 20–50 cells in each picture. The data are representative of two experiments. The scale bar is 10 μm in all the images. NS, not significant; ***p < 0.001 (two-tailed Student’s t tests). Data are means ± s.e.m
Fig. 7
Fig. 7
Specificity of plasma membrane remodeling induced by lipid scrambling. Same as Fig. 6, except that a different set of probes was introduced to YT-S cells expressing Discosoma (ds) Red alone, or in combination with wild-type or D408G TMEM16F, were used. a eGFP-Palm; b eGFP-GPI; c PH-PLCδ-eGFP. Data are from ten pictures for each condition, with 20–50 cells per picture. The data are representative of two experiments. The scale bar is 10 μm in all the images. NS not significant, two-tailed Student’s t tests. The data are presented as the means ± s.e.m

Similar articles

Cited by

References

    1. Sunshine H, Iruela-Arispe ML. Membrane lipids and cell signaling. Curr. Opin. Lipidol. 2017;28:408–413. doi: 10.1097/MOL.0000000000000443. - DOI - PMC - PubMed
    1. van Meer G, Voelker DR, Feigenson GW. Membrane lipids: where they are and how they behave. Nat. Rev. Mol. Cell Biol. 2008;9:112–124. doi: 10.1038/nrm2330. - DOI - PMC - PubMed
    1. Leventis PA, Grinstein S. The distribution and function of phosphatidylserine in cellular membranes. Annu. Rev. Biophys. 2010;39:407–427. doi: 10.1146/annurev.biophys.093008.131234. - DOI - PubMed
    1. Bevers EM, Williamson PL. Getting to the outer leaflet: physiology of phosphatidylserine exposure at the plasma membrane. Physiol. Rev. 2016;96:605–645. doi: 10.1152/physrev.00020.2015. - DOI - PubMed
    1. Balasubramanian K, Schroit AJ. Aminophospholipid asymmetry: a matter of life and death. Annu. Rev. Physiol. 2003;65:701–734. doi: 10.1146/annurev.physiol.65.092101.142459. - DOI - PubMed

Publication types

MeSH terms

Substances

LinkOut - more resources