. 2021 Jan 13;22(2):745.
doi: 10.3390/ijms22020745.

Involvement of SUT1 and SUT2 Sugar Transporters in the Impairment of Sugar Transport and Changes in Phloem Exudate Contents in Phytoplasma-Infected Plants

Affiliations

Involvement of SUT1 and SUT2 Sugar Transporters in the Impairment of Sugar Transport and Changes in Phloem Exudate Contents in Phytoplasma-Infected Plants

Federica De Marco et al. Int J Mol Sci. .

Abstract

Phytoplasmas inhabit phloem sieve elements and cause abnormal growth and altered sugar partitioning. However, how they interact with phloem functions is not clearly known. The phloem responses were investigated in tomatoes infected by "Candidatus Phytoplasma solani" at the beginning of the symptomatic stage, the first symptoms appearing in the newly emerged leaf at the stem apex. Antisense lines impaired in the phloem sucrose transporters SUT1 and SUT2 were included. In symptomatic sink leaves, leaf curling was associated with higher starch accumulation and the expression of defense genes. The analysis of leaf midribs of symptomatic leaves indicated that transcript levels for genes acting in the glycolysis and peroxisome metabolism differed from these in noninfected plants. The phytoplasma also multiplied in the three lower source leaves, even if it was not associated with the symptoms. In these leaves, the rate of phloem sucrose exudation was lower for infected plants. Metabolite profiling of phloem sap-enriched exudates revealed that glycolate and aspartate levels were affected by the infection. Their levels were also affected in the noninfected SUT1- and SUT2-antisense lines. The findings suggest the role of sugar transporters in the responses to infection and describe the consequences of impaired sugar transport on the primary metabolism.

Keywords: carbon allocation; defense; glycolate; glyoxylate; metabolome; peroxisome; phloem; photorespiration; phytoplasma; plant-pathogen interaction; source-sink relationships; sugar metabolism.


Conflict of interest statement

The authors declare no conflicts of interest.

Figures

Figure 1
Figure 1
Experimental Design. Schematic representation of tomato plants when material from leaves L1, L3, L4 and L6 was collected for RNA, DNA, sugar and starch analyses and sap collection by exudation and imaging. Source and sink status of the leaves follow leaf development and expansion. In this study, leaves that are more than 60% fully expanded were considered as sources, based on the study of Turgeon (1989), who established that leaves begin to export when they are 30–60% fully expanded [56]. The L1 leaf just emerged and began to unfold at the sampling stage and was considered as a sink, with leaves L3 and older as sources and L2 indeterminate. The arrow in green indicates the direction of migration of phytoplasmas from the grafted area to the apical leaves. Based on the ages of leaves in which phytoplasma were detected at 18 days after grafting (L1 to L4) and the number of leaves that emerged after grafting (6 new leaves), it is likely that it took at least one week for graft union to be successful and for the phytoplasma to enter the translocation stream. Samplings and observations are indicated as solid circles: plant and phytoplasma RNA sampling (red circle), phytoplasma DNA sampling (orange circle), sugars and starch sampling (blue circle), imaging by transmission electron microscopy or light microscopy (grey circle) and exudate, phloem sap-enriched exudate sampling for the metabolomics analysis (black circle). Inset shows leaflets numbering within a leaf (Ll1–Ll5).
Figure 2
Figure 2
Symptoms and Stolbur phytoplasma proliferation in infected plants. (AD) Details of L1 leaves from grafted noninfected wild-type (WT) (A), infected WT (B), infected SUT1-AS (antisense) (C) and infected SUT2-AS (D). ni: noninfected and i: infected (D). White arrows in (B,D) indicate leaf typical yellowing and growth reduction. (E,F) Boxplot showing phytoplasma DNA in L1 leaves in (E) and rRNA amounts in L1, L4 and L6 leaves in (F); RU: relative units of content. The box and whisker plots in (E,F) show the distribution of the biological replicates. Inside black lines represent medians; top and bottom ends of the boxes represent the first and the third quartiles, respectively; n = 4. Different letters denote statistically different values determined by ANOVA and Tukey’s test.
Figure 3
Figure 3
Ultrastructure of the phloem in response to the infection in the L1 leaf. (AI): Transmission electron (TEM) images of the phloem in noninfected (NI) (AC) and infected (I) (DI) plants. Images are representative of the sieve elements observed, with n = 11–29 for healthy plants and n = 63–73 for infected ones, with 58 SE in total observed for healthy and 200 SE in total for infected plants. (A,D,G) WT, (B,E,H) SUT1-AS plants and (C,F,I) SUT2-AS plants. (AF) Transversal sections and (GI) longitudinal sections. Phytoplasma, CC: companion cell, SE: sieve element, SP: sieve plate (white arrows in (G-I) and P-p: P-proteins (white arrows in (D)). Scale Bars, 2.5 µm. (J) SE cross-sectional areas in the phloem of not infected and infected plants, determined from TEM images (n = 8–22). Asterisks above the bars indicate significant differences by a t-test in SUT1- or SUT2-AS plants compared to WT plants in the same genotype. The effects due to the infection (Inf), genotype (G) and their interaction (G x Inf), determined using a two-way ANOVA, are reported above the plot (* p < 0.05 and *** p < 0.001; ns, not significant.
Figure 4
Figure 4
Frequency and location of phytoplasmas in the sieve elements of infected plants. (A,CG) Details of TEM micrographs in the SE of infected main veins of L1 (leaflets 4 or 5) showing the location of parietal phytoplasma. (B) Frequency of SE with phytoplasmas. (A) Distinctive features of the phytoplasma observed with TEM compared to plastids and mitochondria on a SE longitudinal section. A mature sieve–tube plastid (pl), around 1-µm-wide, exhibits a sparse stroma enclosing a dense inclusion of a proteinaceous type. Phytoplasma (asterisks), less wide, display a loose fibrillar content, whereas the mitochondria matrix (mi) is dense, with clearer cristae. (C,G) TEM images of the WT (C,D), SUT1-AS (E,F) and SUT2-AS lines (G). In (C), white arrows indicate attachments of phytoplasma to the SE plasma membrane. * Phytoplasma, SE: sieve element, P-p: filamentous P-proteins and ser: SE reticulum. ser: sieve element reticulum. Bar: 1 µm. (B) Number of SEs with or without phytoplasmas observed in the phloem of infected L1 leaves. The data were determined with TEM images of transverse or longitudinal sections of the phloem of WT, SUT1-AS and SUT2-AS infected plants. A total of 63, 73 and 74 SEs were imaged for WT, SUT1-AS and SUT2-AS plants, respectively. Phytoplasmas were unambiguously identified in the SEs of WT and SUT2-AS plants (5–30 phytoplasmas per cell). In SUT1-AS plants, no typical phytoplasma were observed, but phytoplasma-like vesicles were observed, less dense and looser.
Figure 5
Figure 5
Frequency of peroxisomes in the phloem of infected and noninfected tomato plants. (AF) TEM images of the main vein phloem cells in leaf L1 in not infected (AC) and infected (DF) plants. (A,D) Wild-type (WT), (B,E) SUT1-AS and (C,F) SUT2-AS transversal sections showing the location of peroxisomes (white arrows in (AF)) in phloem cells. Peroxisomes, easily recognizable by their large crystals, were found in parenchyma cells (pc), inside or close to the phloem bundle in the three lines, and were rarely observed in other phloem cell types, such as in companion cells (in (B)). CC: companion cell, SE: sieve element, pc: parenchyma cell, ppc: phloem parenchyma cell and Chl: chloroplast. Bars, 2.5 µm. (G) The histogram shows the average number of peroxisomes per ROI (+/− se), with n = 6–14. ROI: region of interest, NI: not infected and I: infected, ** p < 0.01.
Figure 6
Figure 6
Rate of phloem exudation of metabolites from L3 leaves in response to the infection. Exudation rate is expressed in nmol mg−1 fresh weight (FW) per hour of exudation. Boxplots show rates of total sugars (A), sucrose (B), total amino acids (C) and total organic acids (D) in noninfected (NI) and infected plants (I). The probabilities obtained by a two-way ANOVA, indicating the effects of the Infection (Inf), the Genotype (G) and interaction of Genotype by Infection (GxI), are shown on each boxplot header. The box and whisker plots show the distribution of the biological replicates. Inside black lines represent medians, top and bottom ends of the boxes represent the first and the third quartiles, respectively, and whisker extremities (open circles) represent the maximum and minimum data points when different from the first and third quartiles (n = 6–8). Asterisks above whisker plots indicate significant differences by a t-test in infected compared to the noninfected plants of the same genotype. p-values: * p < 0.05 and ** p < 0.01; ns, not significant.
Figure 7
Figure 7
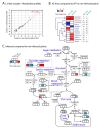
Comparison of metabolite profiles of the phloem sap-enriched exudate from the L3 leaf of not infected and infected plants. (A,B,C) Analysis of the metabolite content determined on the exudate of the third leaf for WT, SUT1- and SUT2-AS lines. (A) Pairwise comparisons and R2 correlation coefficients between metabolite profiles in infected and not infected plants in the 3 genotypes. The plots show for each metabolite its contents in the exudates of not infected plants (X-axis) and infected plants (Y-axis). The linear regression indicates that most metabolites remained stable in both conditions. (B) Heat map showing significant fold changes in metabolite contents in the phloem sap-enriched exudates from the L3 leaves of not infected SUT1- and SUT2-AS plants compared to not infected WT plants (n = 7–8). Values are shown in a blue-to-red log2 scale, with blue for negative values, red for positive values and white for no difference. On the right panel: significance of the effects due to genotype (G), determined using one-way ANOVA (* p < 0.05, ** p < 0.01 and *** p < 0.001; ns, not significant). (C) Heat map showing significant fold changes in the contents of metabolites in phloem sap-enriched exudates in response to infection (p-value < 0.05 on a paired t-test). From the left to the right sides, responses in wild-type (WT) on the left side, SUT1-AS line in the middle and SUT2-AS line on the right side. Values are shown in a blue-to-red log2 scale, with blue values for metabolites showing a smaller content (and red values for higher) due to infection. BCAA: branched-chain amino acids. TCA: tricarboxylic acid cycle. In white: nonsignificant variations. In grey: missing values.
Figure 8
Figure 8
Main variations in the metabolite contents of phloem sap-enriched exudates in response to the infection. (A-F) Boxplots with the contents in the exudates from the L3 leaf of (A) sucrose, (B) aspartate, (C) glycolate and (D) glyoxylate and the content ratios for (E) glyoxylate-to-glycolate and (F) glycine-to-serine. Noninfected plants: NI, Infected plants: I and RU: relative units for content, plotted on a log2 scale. The box and whisker plots show the distribution of the biological replicates. Inside black lines represent medians, top and bottom ends of the boxes represent the first and the third quartiles, respectively, and whisker extremities (open circles) represent the maximum and minimum data points when different from the first and third quartiles (n = 6–8). Above each boxplot, the significance of the effects due to the infection (Inf), genotype (G) and their interaction (G × Inf) (* p < 0.05, ** p < 0.01 and *** p < 0.001; ns, not significant). Inside boxplots in green, t-test comparing AS lines with WT for NI plants and, in red, t-test comparing I and NI plants for each genotype. (G) Glyoxylate can be produced either via photorespiration or via the glyoxylate cycle, the latter being a bypass of the TCA cycle. Glyoxylate and glycolate are reversibly converted by glyoxylate reductases (GLYR) and glycolate oxidases (GOX), reactions that are controlled by the redox status and contribute to the production of reactive oxygen species (ROS) and the conversion of NAD(P)H into NAD(P)+. 2-PG: 2 phosphoglycolate, 3-PGA: 3 phosphoglycerate and RuBP: ribulose 1,5-bisphosphate.
Figure 9
Figure 9
Transcript profiling of candidate genes in infected plants. (A) Inserted heat maps showing fold changes between infected and noninfected plants in each genotype in L1 and L4 leaves (n = 4). Fold changes were determined after normalization by the reference genes, and values are shown on a log2 scale, with blue values for metabolites showing a smaller content due to infection and red values for a higher content. In grey, not determined (nd). (B) Results of the two-way ANOVA for each gene, with the effects of infection (Inf), genotype (G) and interaction (G × Inf). p-values: * p < 0.05, ** p < 0.01 and *** p < 0.001. ns, not significant.
Figure 10
Figure 10
A model of our inferred responses in the young (sink) and mature (source) leaves of a tomato infected plants. On the right side, primary metabolic steps regulating the levels of sugars and organic acids (METABOLISM) in L1 and L4 leaves. Upregulated genes are shown in red, and downregulated genes are shown in blue. The metabolites in exudate from L3 are shown in grey (no change), blue (decrease) or red (increase). Similarly, the soluble sugars and starch contents are shown in the L1 and L4 leaves. The TEM inset shows the main phloem cell types: CC: companion cells, SE: sieve elements, PPC: phloem parenchyma cells, plast: plastid, mi: mitochondria, per: peroxisome and PD: plasmodesmata, with typically close locations of the peroxisome with mitochondria and plastids with starch granules (Bar: 2.5 µm). Suc: sucrose, Fru: fructose, F6P: fructose-6-phosphate, Glc: glucose, G6P: glucose-6-phosphate, AA: amino acids, Glx: glyoxylate cycle and PR: photorespiration.

Similar articles

Cited by

References

    1. Hollingsworth C.R., Atkinson L.M., Samac D.A., Larsen J.E., Motteberg C.D., Abrahamson M.D., Glogoza P., Macrae I.V. Region and field level distributions of aster yellows phytoplasma in small grain crops. Plant Dis. 2008;92:623–630. doi: 10.1094/PDIS-92-4-0623. - DOI - PubMed
    1. Bertaccini A., Duduk B., Paltrinieri S., Contaldo N. Phytoplasmas and phytoplasma diseases: A severe threat to agriculture. Am. J. Plant Sci. 2014;5:1763–1788. doi: 10.4236/ajps.2014.512191. - DOI
    1. Siddique A.B.M., Guthrie J.N., Walsh K.B., White D.T., Scott P.T. Histopathology and within-plant distribution of the phytoplasma associated with australian papaya dieback. Plant Dis. 1998;82:1112–1120. doi: 10.1094/PDIS.1998.82.10.1112. - DOI - PubMed
    1. Wei W., Kakizawa S., Suzuki S., Jung H.-Y., Nishigawa H., Miyata S.-I., Oshima K., Ugaki M., Hibi T., Namba S. In Planta dynamic analysis of onion yellows phytoplasma using localized inoculation by insect transmission. Phytopathology. 2004;94:244–250. doi: 10.1094/PHYTO.2004.94.3.244. - DOI - PubMed
    1. Christensen N.M., Axelsen K.B., Nicolaisen M., Schulz A. Phytoplasmas and their interactions with hosts. Trends Plant Sci. 2005;10:526–535. doi: 10.1016/j.tplants.2005.09.008. - DOI - PubMed

MeSH terms

LinkOut - more resources