

Quantitative analysis of the splice variants expressed by the major hepatitis B virus genotypes
- PMID: 33439114
- PMCID: PMC8115900
- DOI: 10.1099/mgen.0.000492
Quantitative analysis of the splice variants expressed by the major hepatitis B virus genotypes
Abstract
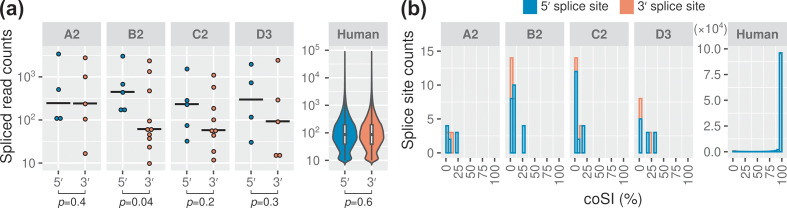
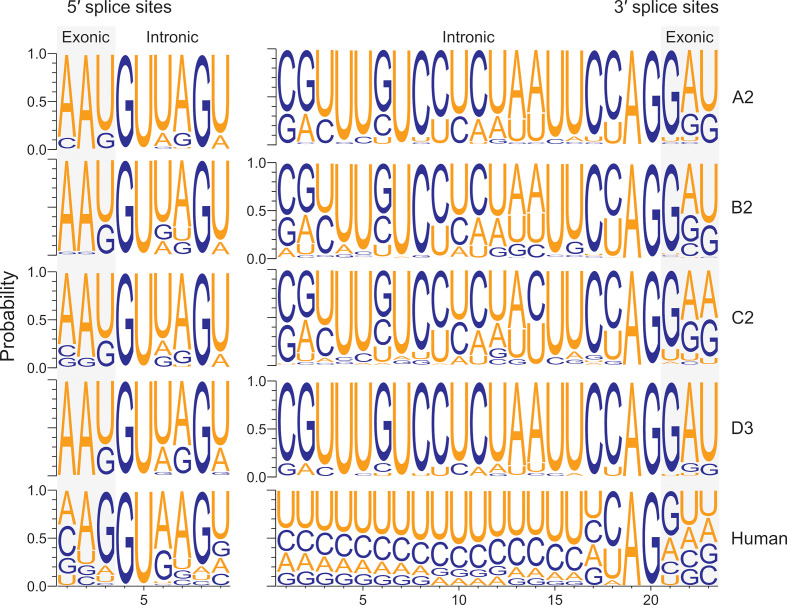
Hepatitis B virus (HBV) is a major human pathogen that causes liver diseases. The main HBV RNAs are unspliced transcripts that encode the key viral proteins. Recent studies have shown that some of the HBV spliced transcript isoforms are predictive of liver cancer, yet the roles of these spliced transcripts remain elusive. Furthermore, there are nine major HBV genotypes common in different regions of the world, these genotypes may express different spliced transcript isoforms. To systematically study the HBV splice variants, we transfected human hepatoma cells, Huh7, with four HBV genotypes (A2, B2, C2 and D3), followed by deep RNA-sequencing. We found that 13-28 % of HBV RNAs were splice variants, which were reproducibly detected across independent biological replicates. These comprised 6 novel and 10 previously identified splice variants. In particular, a novel, singly spliced transcript was detected in genotypes A2 and D3 at high levels. The biological relevance of these splice variants was supported by their identification in HBV-positive liver biopsy and serum samples, and in HBV-infected primary human hepatocytes. Interestingly the levels of HBV splice variants varied across the genotypes, but the spliced pregenomic RNA SP1 and SP9 were the two most abundant splice variants. Counterintuitively, these singly spliced SP1 and SP9 variants had a suboptimal 5' splice site, supporting the idea that splicing of HBV RNAs is tightly controlled by the viral post-transcriptional regulatory RNA element.
Keywords: HBV; pgRNA; shotgun sequencing; transcriptome assembly.
Conflict of interest statement
The authors declare that there are no conflicts of interest.
Figures
Similar articles
-
The inhibitory effect of the hepatitis B virus singly-spliced RNA-encoded p21.5 protein on HBV nucleocapsid formation.PLoS One. 2015 Mar 18;10(3):e0119625. doi: 10.1371/journal.pone.0119625. eCollection 2015. PLoS One. 2015. PMID: 25785443 Free PMC article.
-
The in vitro replication phenotype of hepatitis B virus (HBV) splice variants Sp3 and Sp9 and their impact on wild-type HBV replication.J Virol. 2024 Apr 16;98(4):e0153823. doi: 10.1128/jvi.01538-23. Epub 2024 Mar 19. J Virol. 2024. PMID: 38501924 Free PMC article.
-
Doubly Spliced RNA of Hepatitis B Virus Suppresses Viral Transcription via TATA-Binding Protein and Induces Stress Granule Assembly.J Virol. 2015 Nov;89(22):11406-19. doi: 10.1128/JVI.00949-15. Epub 2015 Sep 2. J Virol. 2015. PMID: 26339052 Free PMC article.
-
Alternative splicing of viral transcripts: the dark side of HBV.Gut. 2021 Dec;70(12):2373-2382. doi: 10.1136/gutjnl-2021-324554. Epub 2021 Sep 17. Gut. 2021. PMID: 34535538 Review.
-
Prospects for inhibiting the post-transcriptional regulation of gene expression in hepatitis B virus.World J Gastroenterol. 2014 Jul 7;20(25):7993-8004. doi: 10.3748/wjg.v20.i25.7993. World J Gastroenterol. 2014. PMID: 25009369 Free PMC article. Review.
Cited by
-
Hepatitis B virus serum RNA transcript isoform composition and proportion in chronic hepatitis B patients by nanopore long-read sequencing.Front Microbiol. 2023 Aug 14;14:1233178. doi: 10.3389/fmicb.2023.1233178. eCollection 2023. Front Microbiol. 2023. PMID: 37645229 Free PMC article.
-
An enrichment protocol and analysis pipeline for long read sequencing of the hepatitis B virus transcriptome.J Gen Virol. 2023 May;104(5):001856. doi: 10.1099/jgv.0.001856. J Gen Virol. 2023. PMID: 37196057 Free PMC article.
-
A roadmap for serum biomarkers for hepatitis B virus: current status and future outlook.Nat Rev Gastroenterol Hepatol. 2022 Nov;19(11):727-745. doi: 10.1038/s41575-022-00649-z. Epub 2022 Jul 20. Nat Rev Gastroenterol Hepatol. 2022. PMID: 35859026 Free PMC article. Review.
-
Pre- and Post-Transcriptional Control of HBV Gene Expression: The Road Traveled towards the New Paradigm of HBx, Its Isoforms, and Their Diverse Functions.Biomedicines. 2023 Jun 9;11(6):1674. doi: 10.3390/biomedicines11061674. Biomedicines. 2023. PMID: 37371770 Free PMC article. Review.
-
Secreted hepatitis B virus splice variants differ by HBV genotype and across phases of chronic hepatitis B infection.J Viral Hepat. 2022 Aug;29(8):604-615. doi: 10.1111/jvh.13702. Epub 2022 May 28. J Viral Hepat. 2022. PMID: 35582878 Free PMC article.
References
Publication types
MeSH terms
Substances
LinkOut - more resources
Full Text Sources
Other Literature Sources
Molecular Biology Databases
Miscellaneous