. 2021 Jan 11;56(1):52-66.e7.
doi: 10.1016/j.devcel.2020.12.014.

Reticulon-3 Promotes Endosome Maturation at ER Membrane Contact Sites

Affiliations

Reticulon-3 Promotes Endosome Maturation at ER Membrane Contact Sites

Haoxi Wu et al. Dev Cell. .

Abstract

ER tubules form and maintain membrane contact sites (MCSs) with endosomes. How and why these ER-endosome MCSs persist as endosomes traffic and mature is poorly understood. Here we find that a member of the reticulon protein family, Reticulon-3L (Rtn3L), enriches at ER-endosome MCSs as endosomes mature. We show that this localization is due to the long divergent N-terminal cytoplasmic domain of Rtn3L. We found that Rtn3L is recruited to ER-endosome MCSs by endosomal protein Rab9a, which marks a transition stage between early and late endosomes. Rab9a utilizes an FSV region to recruit Rtn3L via its six LC3-interacting region motifs. Consistent with our localization results, depletion or deletion of RTN3 from cells results in endosome maturation and cargo sorting defects, similar to RAB9A depletion. Together our data identify a tubular ER protein that promotes endosome maturation at ER MCSs.

Keywords: endoplasmic reticulum; endosome maturation; membrane contact sites.


Conflict of interest statement

Declaration of Interests The authors declare no competing interests.

Figures
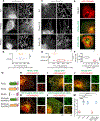
Figure 1.
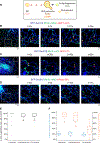
Figure 1.. Rtn3L localizes to discrete domains on ER tubules.
(A) Representative images and 10 x 10 µm insets of ER morphology in WT, RTN4Δ, and RTN3Δ HeLa cells transfected with a general ER marker mNeonGreen (mNG)-Sec61β. (B) Quantification of number of three-way junctions in 10 x 10 µm peripheral insets (A) in WT (n=17 cells) and RTN3Δ cells (n=18 cells). (C) Representative images and 10 x 10 µm insets of ER morphology in COS-7 cells co-transfected with an ER marker (mCh-Sec61β, WT) and either overexpressing (OE) Rtn4a-mNG (Rtn4a OE) or Rtn3L-mNG (Rtn3L OE). (D) Quantification as in (B) for (C) from WT (n=19 cells), Rtn4a OE (n=10 cells) and Rtn3L OE (n=21 cells). (E) Representative images of ER morphology in COS-7 cells OE mCh-Climp63 alone (control), and either with OE of Climp63/Rtn4a (Rtn4a-mNG) or Climp63/Rtn3L (Rtn3L-mNG). (F) Quantification of percent of cells with expanded peripheral ER sheets (E) for Climp63-OE (n=14 cells), Climp63/Rtn4a-OE (n=113 cells) and Climp63/Rtn3L-OE (n=113 cells). (G-L) Cartoon diagrams (with amino acid numbers) and representative images of Rtn variants’ localization for (H) Rtn3L-mNG, (I) Rtn4a-GFP, (J) Rtn3S-GFP, (K) Rtn3cytoRtn4RHD-mNG and (L) Rtn4cytoRtn3RHD-mNG relative to a mCh-Sec61β (ER) in COS-7 cells. 10 µm x 10 µm insets are shown for each Rtn variant alone (green, top right) and overlaid with Sec61β (red, bottom right). (M) Quantification of Rtn variants pixel coverage over the general ER marker (Sec61β) (H-L, n=15 cells for each condition). A lower percent coverage indicates that the Rtn variant is not evenly distributed on ER tubules. Statistical analyses were performed with one-way ANOVA, p-value from Tukey’s test: ns=not significant, ***p<0.001, ****p<0.0001. Scale bars = 5 µm, 1 µm for insets. See also Figure S1–S2. Video S1–S2.
Figure 2.
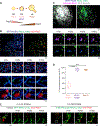
Figure 2.. Rtn3L enriches at ER membrane contact sites.
(A) Cartoon diagram of peroxisome (SKL) and endolysosomal system including early endosome (Rab5), late endosome/lysosome (Rab7/LAMP1) and autophagosome (LC3). (B-D) Representative whole cell and time-lapse images of 10 µm x 10 µm insets show Rtn3L localization relative to other ER-associated trafficking organelles in COS-7 cells co-transfected with Rtn3L-mNG (green), a general ER marker (BFP-Sec61β, blue) and (B) lysosomes (LAMP1-mCh, red), (C) autophagosomes (GFP-LC3, red) or (D) peroxisomes (mRuby-SKL, red). (E) Graph of the percent of time each organelle maintains contact with the ER during time-lapse movies. (F) Graph of percent coverage of Rtn3L pixels over the general ER marker (blue bars) and the percent of time that each dynamic organelle tracks with an Rtn3L puncta over time (orange bars). Quantified from data represented in (B-D) for 60 lysosomes in n=9 cells; 18 autophagosomes in n=7 cells; 23 peroxisomes in n=13 cells. Scale bars = 5 µm, 1 µm for insets.
Figure 3.
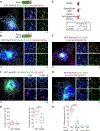
Figure 3.. Rtn3L puncta are recruited to ER-endosome MCSs during maturation.
(A) Cartoon diagram of Rab5, EEA1, and Rab7 recruitment during endosome maturation. (B) Rtn3L puncta were tracked relative to LEs in live COS-7 cells co-transfected with Rtn3L-mNG (green), BFP-Sec61β (ER, blue), and mCh-Rab7 (LEs, red). Images below show time-lapse 10 µm x 10 µm and 3 µm x 3 µm insets, respectively. (C) Rtn3L puncta localization relative to moving early endosomes (EEs) in COS-7 cells co-transfected with Rtn3L-mNG (green), BFP-Sec61β (ER, grey), SNAP-Rab5 (blue), and mScarlet-EEA1 (magenta). Representative time lapse insets are 5 µm x 5 µm. Note that a Rab5 EE that is EEA1+ (magenta, marked by yellow arrows) tracks with an Rtn3L punctum over time. In contrast, a Rab5+ EE that is EEA1- (marked by pink arrows) did not associate with an Rtn3L punctum over time. (D) The percent of time that each endosome population associates with Rtn3L puncta during 2min movies (from data represented in B and C). Endosomes are binned according to their maturation stages: EEA1-/Rab5+ (early maturation stage EEs, 84 endosomes from n=10 cells), EEA1+/Rab5+ (late maturation stage EEs, 87 endosomes from n=10 cells) and Rab7+ endosomes (LEs, 82 endosomes from n=10 cells). (E) Representative time-lapse images of U-2 OS RTN3Δ cells expressing mCh-Rab7 (LEs) and BFP-MAVS (left panels) or mNG-Rtn3cyto-MAVS (right panels) reveals that ectopically localized Rtn3cyto-MAVS can tether LEs (red) to mitochondria (green). Statistical analyses were performed with one-way ANOVA, p-value from Tukey’s test: ****p<0.0001. Scale bars were 5 µm, 1 µm for insets. See also Figure S2, Movie S3-S6.
Figure 4.
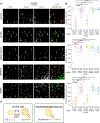
Figure 4.. Rab9a promotes Rtn3L recruitment to endosomes.
(A-B) Representative images of COS-7 cells co-transfected with mScarlet-Rab9a (red), BFP-Sec61β (ER, blue), and (A) Rtn3L-mNG (green) or (B) Rtn3LΔ6LIR-mNG (green). 10 x 10 µm insets were shown in right panels. (C) Rtn3LΔ6LIR puncta were tracked relative to LEs in live COS-7 cells co-transfected with Rtn3LΔ6LIR-mNG (green), BFP-Sec61β (ER, blue), and mCh-Rab7 (LEs, red). Time-lapse insets of 10 µm x 10 µm and 3 µm x 3 µm are shown on the right. (D) Quantification of Rtn3L (WT versus Δ6LIR) pixel coverage over an ER marker and the percent of time that Rtn3L (WT versus Δ6LIR) maintain contact with Rab7 LEs over time. Data taken from WT Rtn3L (50 endosomes in n=10 cells) and Rtn3LΔ6LIR (54 endosomes in n=14 cells). (E) Domain structure of human Rab9a, Rab9aS21N (dominant negative, DN) and Rab9aF87AS88AV89A (ΔFSV). Amino acid numbers are indicated. Pairwise sequence alignment between LC3 and Rab9a were performed using Clustal-Omega and its default parameters (Söding, 2005). *indicate identical amino acids. (F) The percent of Rab9a-positive endosomes that are wrapped by both Rtn3L (green) and ER (Sec61β, blue) was quantified from data represented in (A) (Rtn3L, 242 endosomes from n=15 cells), (B) (Rtn3LΔ6LIR, 214 endosomes from n=16 cells), (F) (Rab9aS21N, 202 endosomes from n=13 cells), and (G) (Rab9aΔFSV, 233 endosomes from n=14 cells). Statistical analyses were performed with two-tailed student t-test: ****p<0.0001. Scale bars = 5 µm, 1 µm for insets. See also Figure S3–S4.
Figure 5.
Figure 5.. Rab9a recruits Rtn3L to ER-endosome MCSs.
(A) Representative images of control siRNA (siCTRL) and RAB9A siRNA (siRAB9A) treated COS-7 cells co-transfected with BFP-Sec61β (ER, blue), mCh-Rab7 (LEs, red) and Rtn3L-mNG (green). Time-lapse 10 x 10 µm insets are shown on the right. Orange arrows point at LEs in RAB9A-depleted cells that do not track with Rtn3L. (B) Quantification of Rtn3L coverage on ER tubules (left) and the percent of time Rab7 LEs track with Rtn3L in 2min movies (right). Data quantitated from siCTRL (66 endosomes, n= 10 cells) versus siRAB9A (56 endosomes, n=11 cells). (C) Cartoon diagram of experiment testing whether Rtn3L and Rab9a are within tethering distance. Briefly: HeLa cells expressing TurboID-Rab9a or V5-TurboID-Rab9aΔFSV (negative control) were treated with 500µM biotin for 3hrs. Biotinylated proteins were pulled-down by anti-biotin agarose beads. Eluted biotinylated proteins are assayed by immunoblot. (D) Representative V5 and Rtn3L immunoblot of load and elute of biotin pulldown (left), and the quantification of normalized Rtn3L biotinylated by V5-TurboID-Rab9a WT versus V5-TurboID-Rab9aΔFSV. All numbers normalized to V5-TurboID-Rab9a WT. Statistical analyses were performed with two-tailed student t-test: **p<0.01, ****p<0.0001. Scale bars = 5 µm, 1 µm for insets. See also Figure S5.
Figure 6.
Figure 6.. RTN3 and RAB9A are required for endosome maturation.
(A) The effect of RTN3 and RAB9A on endosome maturation. HeLa cells were co-transfected with BFP-Rab5 (EEs), GFP-Rab7 (LEs) and with control siRNA (siCTRL), RTN3 siRNA (siRTN3), RTN3 siRNA with re-expression of siRNA resistant Rtn3L-mCh (siRTN3+Rtn3L), RAB9A siRNA (siRAB9A), or ERM siRNA (siERM). To visualize newly formed and actively trafficking endosomes, cells were pulse-labeled with EGF-647 and then fixed 10 min or 20 min later (see 20 min images in Figure S6). Representative max-projected z-stacks are shown. Individual channels are shown in grey the merge of all three are shown on the right (EGF in grey, Rab5 in red and Rab7 in green). Only EGF-647-positive endosomes are scored. Examples of EGF+ endosomes are marked by pink arrows (EGF+ and Rab5+) or yellow arrows (EGF+, Rab5+ and Rab7+). For whole cell images see Figure S6A. (B) Quantification of data represented in (A) and from 20 min time point (data represented in Figure S6). Endosomes were binned into EGF+/Rab5+, EGF+/Rab7+, or EGF+/Rab5+/Rab7+ at the 10 min and 20 min time points. Data presented in 10min/20min graphs are from: control siRNA (239/201 endosomes, n=11/15 cells) RTN3 siRNA (166/276 endosomes, n=11/16 cells), RTN3 siRNA + Rtn3L-mCh (470/249 endosomes, n=14/13 cells), RAB9A siRNA (319/352 endosomes, n=11/16 cells) and ERM siRNA (352/414 endosomes, n=12/13 cells). (C) Model of endosome maturation defect in cells depleted of RTN3, RAB9A or ERM: Rab7 recruitment is premature, and Rab5 displacement (Rab5/7 conversion) is delayed. Statistical analyses were performed with one-way ANOVA, p-value from Tukey’s test: ns=not significant, ****p<0.0001. Scale bars = 5 µm, 1 µm for insets. See also Figure S6.
Figure 7.
Figure 7.. Rab9a and Rtn3L regulate endosomal cargo sorting.
(A) CI-MPR trafficking assay. The relative fluorescence intensity of internalized anti-CI-MPR antibody (green) by immunostaining shows the localization of internalized anti-CI-MPR relative to the Golgi (Giantin, red) in HeLa cells treated with control (left, siCTRL), RTN3 siRNA (middle, siRTN3) or RTN3 siRNA and re-expressing exogenous Rtn3L (right, siRTN3+Rtn3L). Note that a block in cargo trafficking causes CI-MPR to stall in peripheral vesicles and not traffic to the perinuclear Golgi. (B) As in (A) for HeLa cells treated with RTN3 siRNA and rescued with Rtn3cytoRtn4RHD-mNG (+Rtn3/4RHD, left), constitutively active GFP-Rab9aQ66L (+Rab9aQ66L, middle), or constitutively active GFP-Rab7Q67L (+Rab7Q67L, right). (C) Quantification of the ratio between fluorescence intensity in vesicular structures relative to that of the Golgi for siCTRL (1.9, n=35 cells), siRTN3, (3.4, n=53 cells); siRTN3+Rtn3L (1.0, n=44 cells), siRTN3+Rtn3/4RHD (0.7, n=21 cells), siRTN3+ Rab9aQ66L (1.9, n=34 cells), and siRTN3+Rab7Q67L (3.2, n=23 cells). Statistical analyses were performed with one-way ANOVA, p-value from Tukey’s test: ns = not significant, ****p<0.0001. Scale bars = 5 µm, 1 µm for insets.

Similar articles

Cited by

References

    1. Audhya A, Desai A, and Oegema K (2007). A role for Rab5 in structuring the endoplasmic reticulum. J. Cell Biol 178, 43–56. - PMC - PubMed
    1. Bayer N, Schober D, Prchla E, Murphy RF, Blaas D, and Fuchs R (1998). Effect of Bafilomycin A1 and Nocodazole on Endocytic Transport in HeLa Cells: Implications for Viral Uncoating and Infection. J. Virol 72, 9645–9655. - PMC - PubMed
    1. Betancourt-Solis MA, Desai T, and McNew JA (2018). The atlastin membrane anchor forms an intramembrane hairpin that does not span the phospholipid bilayer. J. Biol. Chem 293, 18514–18524. - PMC - PubMed
    1. Bindels DS, Haarbosch L, van Weeren L, Postma M, Wiese KE, Mastop M, Aumonier S, Gotthard G, Royant A, Hink MA, et al. (2017). mScarlet: a bright monomeric red fluorescent protein for cellular imaging. Nat. Methods 14, 53–56. - PubMed
    1. Branon TC, Bosch JA, Sanchez AD, Udeshi ND, Svinkina T, Carr SA, Feldman JL, Perrimon N, and Ting AY (2018). Efficient proximity labeling in living cells and organisms with TurboID. Nat. Biotechnol 36, 880–898. - PMC - PubMed

Publication types

MeSH terms