Role of necroptosis in chronic hepatic inflammation and fibrosis in a mouse model of increased oxidative stress
- PMID: 33429022
- PMCID: PMC8845573
- DOI: 10.1016/j.freeradbiomed.2020.12.449
Role of necroptosis in chronic hepatic inflammation and fibrosis in a mouse model of increased oxidative stress
Abstract
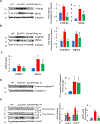
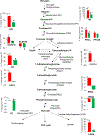
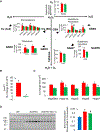
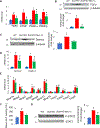
Mice deficient in the antioxidant enzyme Cu/Zn-superoxide dismutase (Sod1-/- or Sod1KO mice) have increased oxidative stress, show accelerated aging and develop spontaneous hepatocellular carcinoma (HCC) with age. Similar to humans, HCC development in Sod1KO mice progresses from non-alcoholic fatty liver disease (NAFLD) to non-alcoholic steatohepatitis (NASH) with fibrosis, which eventually progresses to HCC. Oxidative stress plays a role in NAFLD to NASH progression, and liver inflammation is the main mechanism that drives the disease progression from NASH to fibrosis. Because necroptosis is a major source of inflammation, we tested the hypothesis that increased necroptosis in the liver plays a role in increased inflammation and fibrosis in Sod1KO mice. Phosphorylation of MLKL (P-MLKL), a well-accepted marker of necroptosis, and expression of MLKL protein were significantly increased in the livers of Sod1KO mice compared to wild type (WT) mice indicating increased necroptosis. Similarly, phosphorylation of RIPK3 and RIPK3 protein levels were also significantly increased. Markers of pro-inflammatory M1 macrophages, NLRP3 inflammasome, and transcript levels of pro-inflammatory cytokines and chemokines, e.g., TNFα, IL-6, IL-1β, and Ccl2 that are associated with human NASH, were significantly increased. Expression of antioxidant enzymes and heat shock proteins, and markers of fibrosis and oncogenic transcription factor STAT3 were also upregulated and autophagy was downregulated in the livers of Sod1KO mice. Short term treatment of Sod1KO mice with necrostatin-1s (Nec-1s), a necroptosis inhibitor, reversed these conditions. Our data show for the first time that necroptosis-mediated inflammation contributes to fibrosis in a mouse model of increased oxidative stress and accelerated aging, that also exhibits progressive HCC development.
Keywords: Autophagy; Cu/Zn superoxide dismutase; Fibrosis; Hepatocellular carcinoma; Inflammation; Necroptosis; Necrostatin-1s; Non-alcoholic fatty liver disease; Non-alcoholic hepatosteatosis; Oxidative stress.
Copyright © 2020 The Author(s). Published by Elsevier Inc. All rights reserved.
Conflict of interest statement
Conflict of interest
The authors declare that they have no conflicts of interest with the contents of this article.
Figures


Similar articles
-
Senolytic treatment reduces cell senescence and necroptosis in Sod1 knockout mice that is associated with reduced inflammation and hepatocellular carcinoma.Aging Cell. 2022 Aug;21(8):e13676. doi: 10.1111/acel.13676. Epub 2022 Jul 23. Aging Cell. 2022. PMID: 35869934 Free PMC article.
-
Necroptosis is a key pathogenic event in human and experimental murine models of non-alcoholic steatohepatitis.Clin Sci (Lond). 2015 Oct 1;129(8):721-39. doi: 10.1042/CS20140732. Epub 2015 Jun 15. Clin Sci (Lond). 2015. PMID: 26201023
-
Absence of Either Ripk3 or Mlkl Reduces Incidence of Hepatocellular Carcinoma Independent of Liver Fibrosis.Mol Cancer Res. 2023 Sep 1;21(9):933-946. doi: 10.1158/1541-7786.MCR-22-0820. Mol Cancer Res. 2023. PMID: 37204757 Free PMC article.
-
Role of gut microbiota and oxidative stress in the progression of non-alcoholic fatty liver disease to hepatocarcinoma: Current and innovative therapeutic approaches.Redox Biol. 2018 May;15:467-479. doi: 10.1016/j.redox.2018.01.009. Epub 2018 Feb 3. Redox Biol. 2018. PMID: 29413959 Free PMC article. Review.
-
Pathogenesis of NASH: How Metabolic Complications of Overnutrition Favour Lipotoxicity and Pro-Inflammatory Fatty Liver Disease.Adv Exp Med Biol. 2018;1061:19-44. doi: 10.1007/978-981-10-8684-7_3. Adv Exp Med Biol. 2018. PMID: 29956204 Review.
Cited by
-
Decreased antioxidant-related superoxide dismutase 1 expression in peripheral immune cells indicates early ethanol exposure.Sci Rep. 2024 Oct 23;14(1):25091. doi: 10.1038/s41598-024-76084-8. Sci Rep. 2024. PMID: 39443615 Free PMC article.
-
Comparative Transcriptome Analysis Unveils Regulatory Factors Influencing Fatty Liver Development in Lion-Head Geese under High-Intake Feeding Compared to Normal Feeding.Vet Sci. 2024 Aug 11;11(8):366. doi: 10.3390/vetsci11080366. Vet Sci. 2024. PMID: 39195820 Free PMC article.
-
Microcystin-LR activates serine/threonine kinases and alters the phosphoproteome in human HepaRG cells.Toxicon. 2024 Oct;249:108072. doi: 10.1016/j.toxicon.2024.108072. Epub 2024 Aug 20. Toxicon. 2024. PMID: 39154757
-
Programmed cell death in hepatocellular carcinoma: mechanisms and therapeutic prospects.Cell Death Discov. 2024 Aug 8;10(1):356. doi: 10.1038/s41420-024-02116-x. Cell Death Discov. 2024. PMID: 39117626 Free PMC article. Review.
-
Ferroptosis, pyroptosis and necroptosis in hepatocellular carcinoma immunotherapy: Mechanisms and immunologic landscape (Review).Int J Oncol. 2024 Jun;64(6):63. doi: 10.3892/ijo.2024.5651. Epub 2024 May 17. Int J Oncol. 2024. PMID: 38757345 Free PMC article. Review.
References
Publication types
MeSH terms
Grants and funding
LinkOut - more resources
Full Text Sources
Other Literature Sources
Medical
Molecular Biology Databases
Miscellaneous

