. 2021 Jan 12;118(2):e2016425118.
doi: 10.1073/pnas.2016425118.

Permissive selection followed by affinity-based proliferation of GC light zone B cells dictates cell fate and ensures clonal breadth

Affiliations

Permissive selection followed by affinity-based proliferation of GC light zone B cells dictates cell fate and ensures clonal breadth

Rinako Nakagawa et al. Proc Natl Acad Sci U S A. .

Abstract

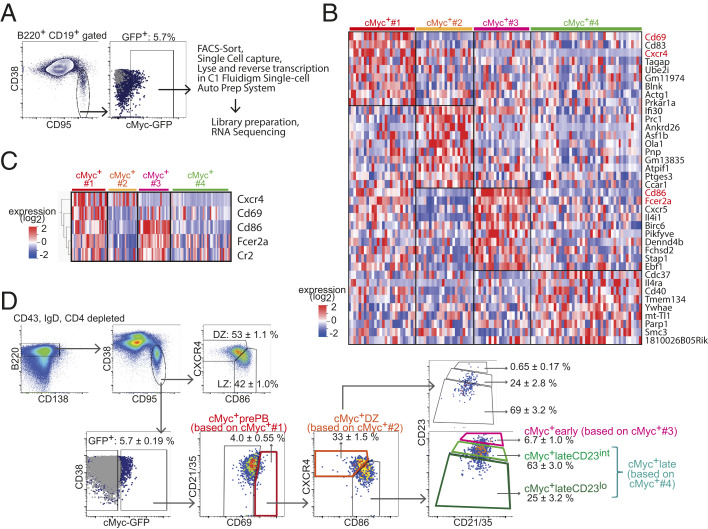
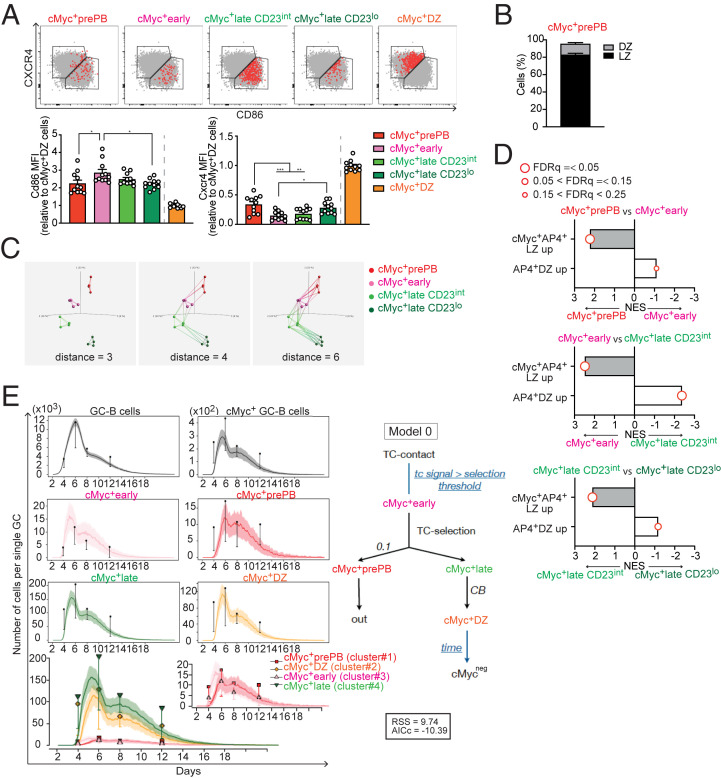
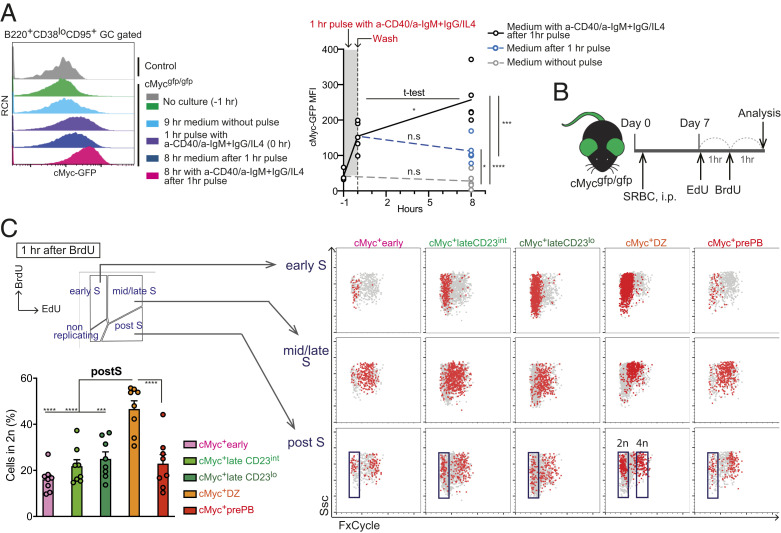
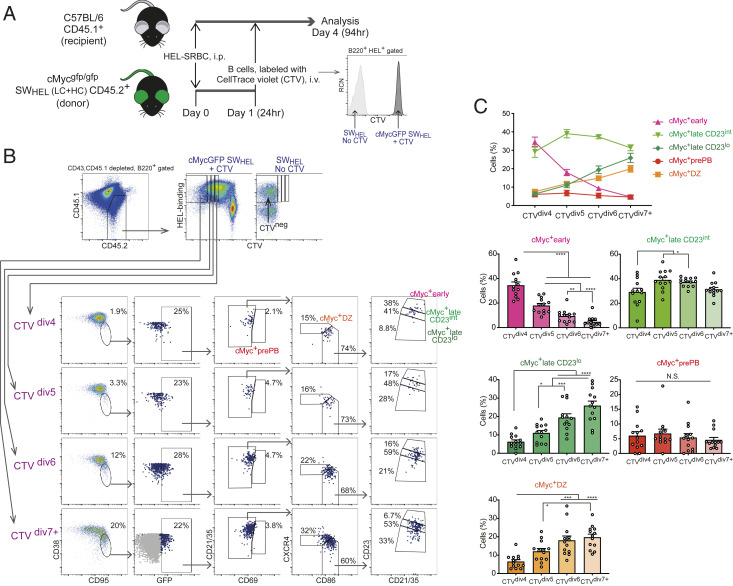
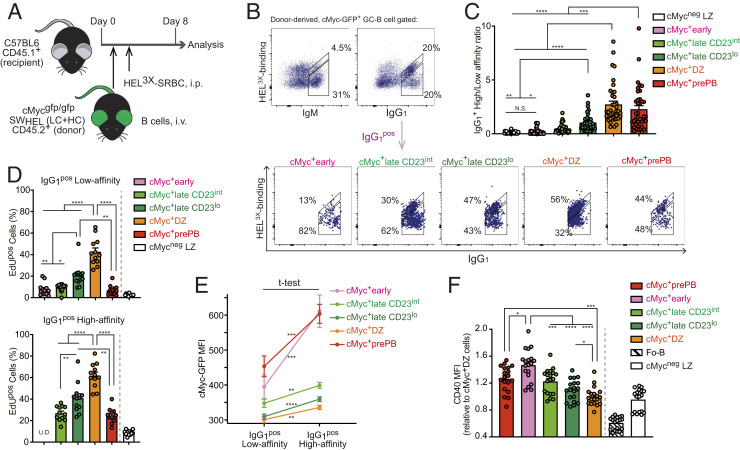
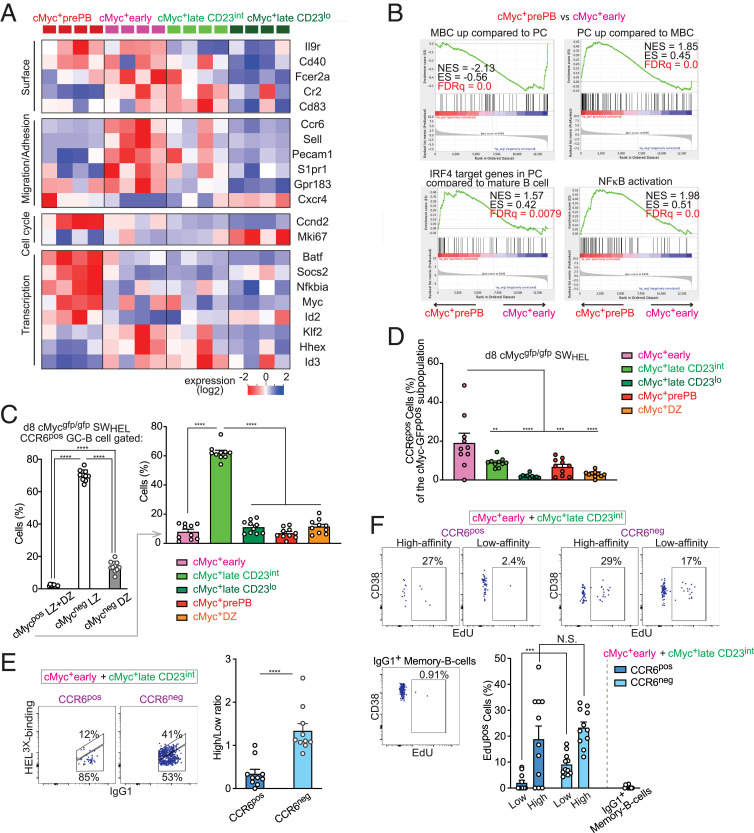
Affinity maturation depends on how efficiently germinal centers (GCs) positively select B cells in the light zone (LZ). Positively selected GC B cells recirculate between LZs and dark zones (DZs) and ultimately differentiate into plasmablasts (PBs) and memory B cells (MBCs). Current understanding of the GC reaction presumes that cMyc-dependent positive selection of LZ B cells is a competitive affinity-dependent process; however, this cannot explain the production of GC-derived lower-affinity MBCs or retention of GC B cells with varied affinities. Here, by combining single-cell/bulk RNA sequencing and flow cytometry, we identified and characterized temporally and functionally distinct positively selected cMyc+ GC B cell subpopulations. cMyc+ LZ B cell subpopulations enriched with either higher- or lower-affinity cells diverged soon after permissive positive selection. The former subpopulation contained PB precursors, whereas the latter comprised less proliferative MBC precursors and future DZ entrants. The overall affinity of future DZ entrants was enhanced in the LZ through preferential proliferation of higher-affinity cells. Concurrently, lower-affinity cells were retained in GCs and protected from apoptosis. These findings redefine positive selection as a dynamic process generating three distinct B cell fates and elucidate how positive selection ensures clonal diversity for broad protection.

Keywords: GC B cells; affinity maturation; clonal diversity; memory B cells; positive selection.


Conflict of interest statement

The authors declare no competing interest.

Figures

Fig. 1.
Fig. 1.
Identification and flow cytometric delineation of positively selected cMyc+ GC B cell subpopulations. (A) scRNAseq workflow and gating strategy for isolating splenic cMyc+ GC B cells of cMycgfp/gfp mice. (B) Heat map illustrating highly representative DEGs in each cluster. These DEGs passed thresholds: first, the cutoff for P ≤ 0.05 by multigroup comparison and second, for P ≤ 0.05 by two-group comparison (the cluster vs. ≠ the cluster) and log2 fold change >1. Fcer2a was the eighth enriched gene in the cMyc+#1 cluster, but it is not listed in the cluster because it is shown as the second enriched gene in the cMyc+#3 cluster instead. Genes encoding key markers that are used for delineating flow cytometric cMyc+ GC B cell subpopulations (as described in D) are highlighted in red. (C) Heat map illustrating the five key marker genes used in D. The markers were selected from 76 DEGs (P ≤ 0.005, by multigroup comparison). (D) Representative flow cytometry plots illustrating gating strategy to delineate cMyc+ GC B cell subpopulations. Splenic GC B cells of C57BL/6 mice are shown in gray dots as cMyc-GFPneg control cells. Average ± SEM value (15 mice) is shown in each indicated gate. Splenic GC B cell response to SRBC on day 7 in cMycgfp/gfp mice.
Fig. 2.
Fig. 2.
cMyc+ LZ B cell subpopulations emerge in a sequential order following positive selection signals. (A) Representative flow cytometry plots of CD86 vs. CXCR4 expression in the cMyc+ GC B cell subpopulations. Total GC B cells are shown in gray dots (Upper). Cd86 and Cxcr4 MFI values of the cMyc+ GC B cell subpopulations (relative to cMyc+ DZ values). (B) Percentages of cells in the cMyc+prePB subpopulation in DZ or LZ gates as described in A. Splenic GC B cell response to SRBC on day 7 in cMycgfp/gfp mice (A and B). Pooled data from more than three experiments with 11 (A) or 16 mice (B). Error bars indicate SEM. Statistics were calculated with one-way ANOVA. *P < 0.05; **P < 0.01; ***P < 0.001. (C) The 3D PCA plots of RNAseq data from the four cMyc+ LZ B cell subpopulations: cMyc+early, cMyc+lateCD23int, cMyc+lateCD23lo, and cMyc+prePB. The sample clusters were visualized by connecting each sample with its nearest neighbors for distance 3, 4, and 6. (D) Bar graphs representing GSEA of a cMyc+ LZ B cell subpopulation compared with the other (see description) for gene sets: “cMyc+AP4+ LZ up-regulated compared with AP4+ DZ” and “AP4+ DZ up-regulated compared with cMyc+AP4+ LZ.” The size of the dots indicates false discovery rate (FDR) q values. NES, normalized enrichment score. (E) In silico kinetics of the GC response (model 0) are plotted over the in vivo results for the number of GC B cells, cMyc+ GC B cells, and cells in each cMyc+ GC B cell subpopulation. cMyc positivity was attributed to the cells that were positively selected and received T cell signal (“tc signal”) from TFH above the selection threshold (= cMyc+early subpopulation). Cells in the cMyc+early subpopulation progressed to the cMyc+prePB or cMyc+late subpopulations, according to an in silico probabilistic fate decision between differentiation into GC output or CBs, respectively. Cells in the cMyc+late subpopulation progressed to the cMyc+ DZ subpopulation at the time of in silico CB differentiation. Cells in the cMyc+ DZ subpopulation lost cMyc expression after a fixed time. At the bottom plot, the four cMyc+ GC B cell subpopulations are plotted together, and Inset shows a magnification of cMyc+prePB and cMyc+early subpopulations. (Right) Working model of the cMyc+ GC B cell subpopulation dynamics in silico; RSS and AICc values are shown (see SI Appendix, Fig. S2 BE for the other tested models). Free parameters used to fit the model are shown in blue letters. All data points were normalized with respect to the maximum value obtained in the simulation of the GC B cell kinetics in GC B cell numbers shown in the plot GC B cells. Mean (full lines) and SD (shaded area) of 100 simulations are shown. Black dots and colored dots represent in vivo data.
Fig. 3.
Fig. 3.
A fraction of cMyc+ GC B cells in each subpopulation completes mitosis in the LZ. (A) Representative flow cytometric histograms of cMyc-GFP vs. relative cell number (RCN; Left). cMyc-GFP MFI values of GC B cells in the indicated time points (Right). Each circle indicates one sample. (B) Experimental design for C. (C) Representative flow cytometric plots of a DNA dye, FxCycle vs. Ssc in the cMyc+ GC B cell subpopulations after 1-h BrdU incorporation. Diploid (2n) and tetraploid (4n) gates were determined by DNA contents that were visualized with FxCycle staining. Percentage of cells in the diploid gate of the post–S-gated cells is shown. This ratio indicates duration of S phase under this experimental setting. Splenic GC B cell response to SRBC on day 6 (A) or day 7 (C) in cMycgfp/gfp mice. Data are from a representative experiment containing five samples per condition of two experiments (A) or three experiments with eight mice (C). Error bars indicate SEM. Statistics were calculated with unpaired Student’s t test between samples taken at different time points (A) or with one-way ANOVA (C). n.s., not significant. *P < 0.05; ***P < 0.001; ****P < 0.0001.
Fig. 4.
Fig. 4.
Transit to a subsequent cMyc+ LZ B cell subpopulation can be accompanied by cell division. (A) Experimental design for B and C with a representative flow cytometric plot of B cells used for adoptive transfer. Intraperitoneal (i.p.) and intravenous (i.v.) injections in mice. (B) Representative flow cytometric plots. SWHEL cMycgfp/gfp donor-derived HEL-specific B220+ B cells were divided into four gates by cell division number based on dilution of CTV: CTVdiv7+, seven division and more; CTVdiv6, six division; CTVdiv5, five division; CTVdiv4, four division. cMyc-GFP+ GC B cells of each CTV gate were further resolved into the five subpopulations by the gating described in Fig. 1D. SWHEL control mouse-derived GC B cells are shown in gray dots to identify the cMyc-GFPneg population. (C) Percentages of cells of the five cMyc+ GC B cell subpopulations in each CTV gate. Pooled data from more than three experiments with 13 mice (C). Error bars indicate SEM. Statistics were calculated with one-way ANOVA. N.S., not significant. *P < 0.05; **P < 0.01; ***P < 0.001; ****P < 0.0001.
Fig. 5.
Fig. 5.
Permissive selection occurs at the start of positive selection, followed by affinity-dependent proliferation in the LZ. (A) Experimental design for B. (B) Representative flow cytometric plots. SWHEL cMycgfp/gfp donor-derived cMyc+ GC B cells 8 d after HEL-SRBC immunization were divided into high-affinity (top diagonal gate) and low-affinity (bottom gate) gates based on binding ability of BCR (IgM or IgG1) to HEL (Upper). Representative flow cytometric plots of HEL binding vs. IgG1 expression in the cMyc+ GC B cell subpopulations (Lower). (C) IgG1+ high-/low-HEL binding ratio in the cMyc+ GC B cell subpopulations. (D) Percentages of EdUpos cells in the cMyc+ GC B cell subpopulations that were further divided based on the BCR affinity as shown in B 6 h after i.v. injection with EdU. Splenic GC B cell response to HEL-SRBC immunization on day 7. Due to the limitation of the number of high-affinity cells in the cMyc+early subpopulation, percentages of EdUpos cells were unable to be determined (U.D.). (E) cMyc-GFP MFI values of the cMyc+ GC B cell subpopulations. SWHEL cMycgfp/gfp donor-derived HEL-specific cells 8 d after HEL-SRBC immunization were divided into IgG1pos high affinity and low affinity. Statistics calculated with unpaired Student’s t test between low- and high-affinity cells of each cMyc+ GC B cell subpopulation. (F) CD40 MFI values (relative to cMyc+ DZ values). Fo-B cells were defined as B220+CD38hiCD95negCD23hiCD21/35lo cells. Splenic GC B cell response to SRBC on day 7 in cMycgfp/gfp mice. Pooled data from more than three experiments with 38 mice (C), 12 mice (D), 18 mice (E), or 19 mice (F). Error bars indicate SEM. Statistics were calculated with one-way ANOVA. N.S., not significant. *P < 0.05; **P < 0.01; ***P < 0.001; ****P < 0.0001.
Fig. 6.
Fig. 6.
Specific cMyc+ GC B cell subpopulations contain MBC and PB/PC precursors. (A) Heat map for selected genes known to be associated with PB/PC or MBC differentiation. Only genes that have passed the threshold of P ≤ 0.04 by multigroup comparison are shown. (B) GSEA of differential gene expression in the cMyc+prePB subpopulation vs. the cMyc+early subpopulation for gene sets: “up-regulated in MBC compared with PC,” “up-regulated in PC compared with MBC,” “IRF4 target in PC compared with mature B cell,” and “NFκB activation.” Nominal enrichment score (NES), enrichment score (ES) and false discovery rate (FDR) q values. (C) Percentages of cells within the indicated populations after gating on CCR6pos GC B cells as shown in SI Appendix, Fig. S5C (Left). Percentage of cells within the cMyc+ GC B cell subpopulations after gating on CCR6pos cMyc+ GC B cells (Right). (D) Percentage of CCR6pos cells in the cMyc+ GC B cell subpopulations after gating as shown in SI Appendix, Fig. S5C. (E) Representative flow cytometric plots of HEL binding vs. IgG1 expression in CCR6pos and CCR6neg cells of the cMyc+early and cMyc+lateCD23int combined populations (Left). IgG1pos high-/low-HEL binding ratio in the indicated cell populations as gated in Left (Right). (F) Representative flow cytometric plots of CD38 vs. EdU incorporation in CCR6pos and CCR6neg cells of the cMyc+early and cMyc+lateCD23int combined populations that were further divided based on the BCR affinity as shown in E and IgG1pos MBCs 6 h after intravenous injection with EdU. Percentages of EdUpos cells in the indicated cell populations (Lower Right). SWHEL cMycgfp/gfp donor B cells on day 8 (CE) or day 7 (F) after HEL-SRBC immunization. Pooled data from two experiments with 10 mice (CE) or 11 mice (F). Error bars indicate SEM. Statistics were calculated with one-way ANOVA (C and D) or unpaired Student’s t test (E and F). N.S., not significant. **P < 0.01; ***P < 0.001; ****P < 0.0001.

Similar articles

Cited by

References

    1. Berek C., Berger A., Apel M., Maturation of the immune response in germinal centers. Cell 67, 1121–1129 (1991). - PubMed
    1. Jacob J., Kelsoe G., Rajewsky K., Weiss U., Intraclonal generation of antibody mutants in germinal centres. Nature 354, 389–392 (1991). - PubMed
    1. Kepler T. B., Perelson A. S., Cyclic re-entry of germinal center B cells and the efficiency of affinity maturation. Immunol. Today 14, 412–415 (1993). - PubMed
    1. Dominguez-Sola D., et al. , The proto-oncogene MYC is required for selection in the germinal center and cyclic reentry. Nat. Immunol. 13, 1083–1091 (2012). - PMC - PubMed
    1. Calado D. P., et al. , The cell-cycle regulator c-Myc is essential for the formation and maintenance of germinal centers. Nat. Immunol. 13, 1092–1100 (2012). - PMC - PubMed

Publication types

Substances