

Oncogene UBE2I enhances cellular invasion, migration and proliferation abilities via autophagy-related pathway resulting in poor prognosis in hepatocellular carcinoma
- PMID: 33414994
- PMCID: PMC7783760
Oncogene UBE2I enhances cellular invasion, migration and proliferation abilities via autophagy-related pathway resulting in poor prognosis in hepatocellular carcinoma
Abstract
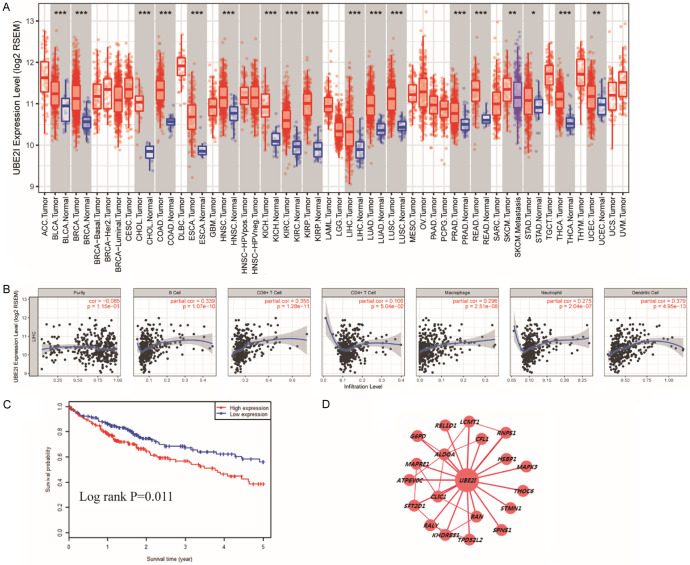
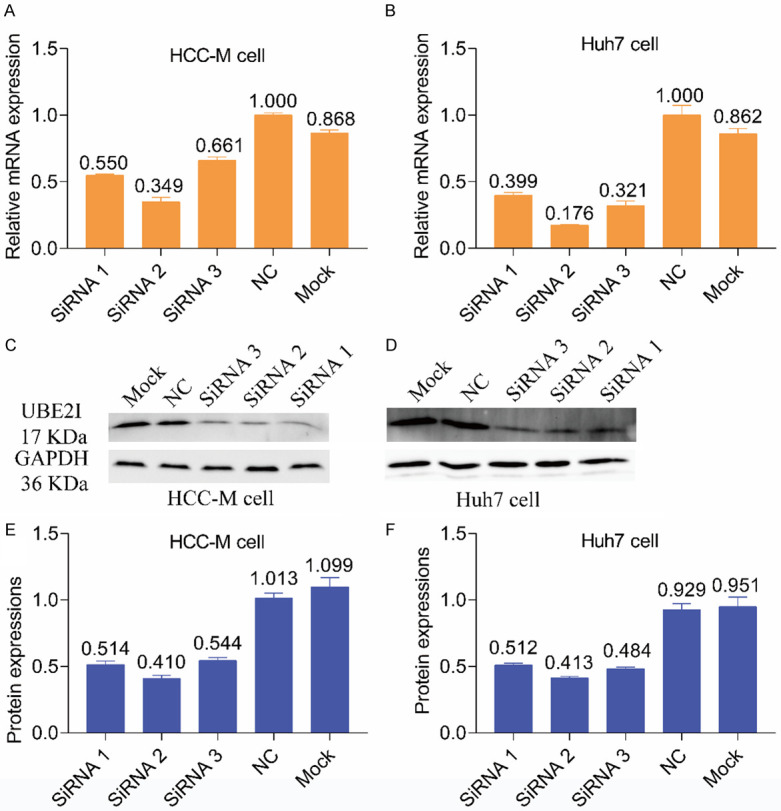
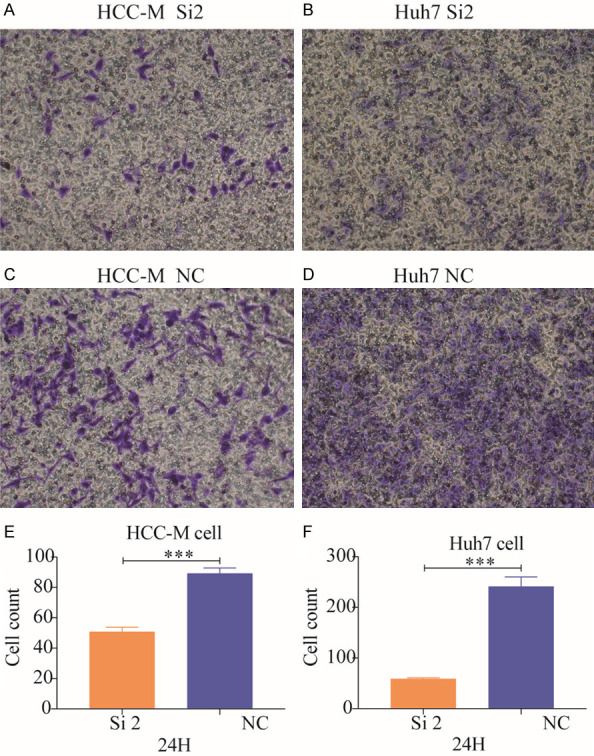
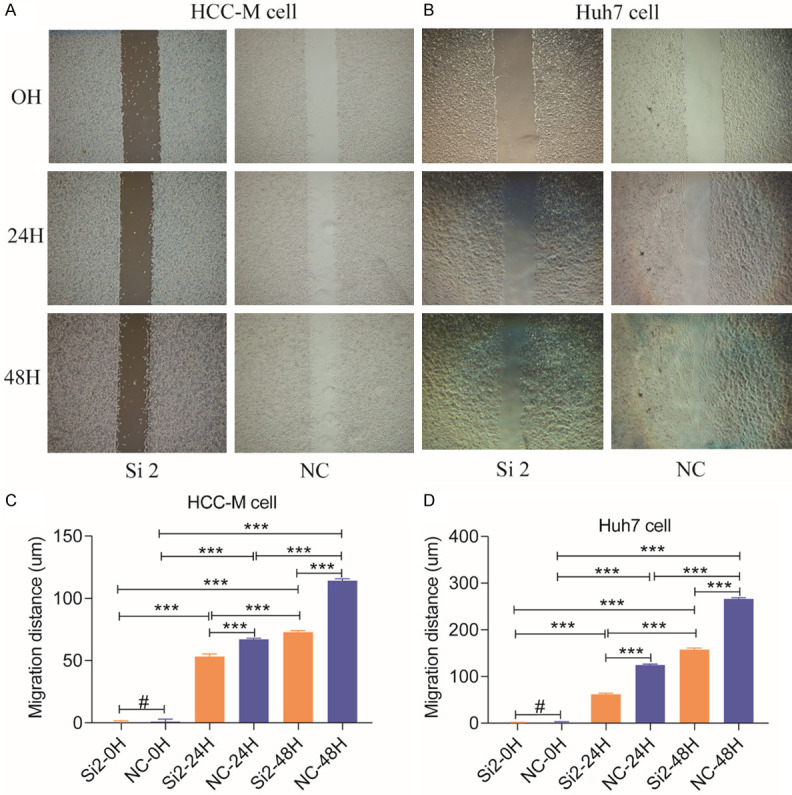
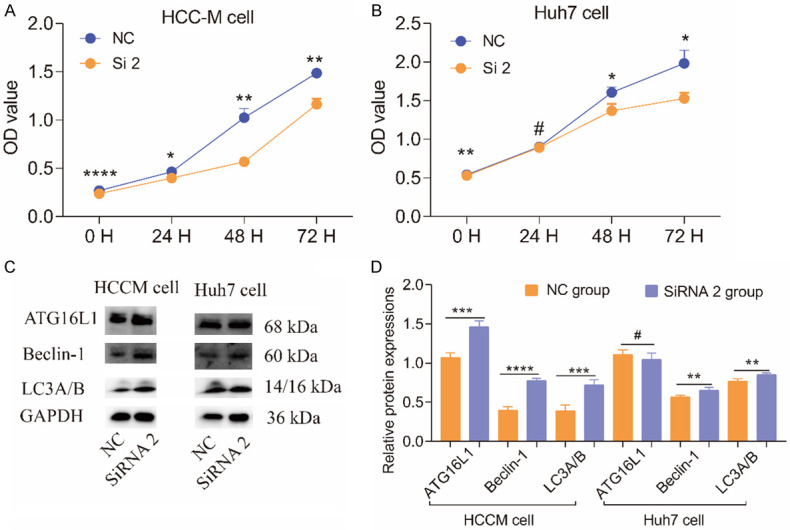
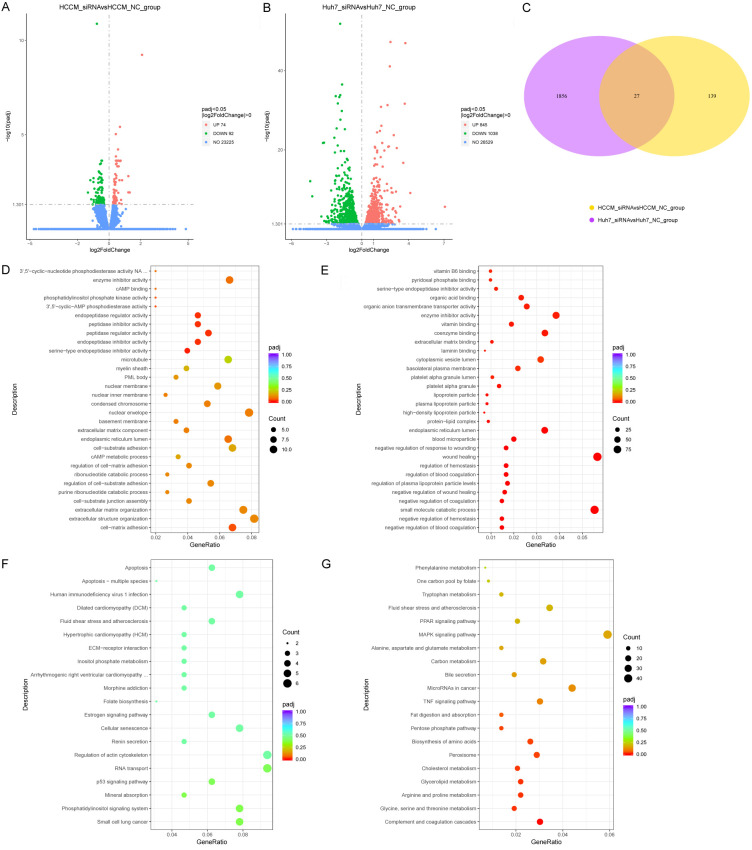
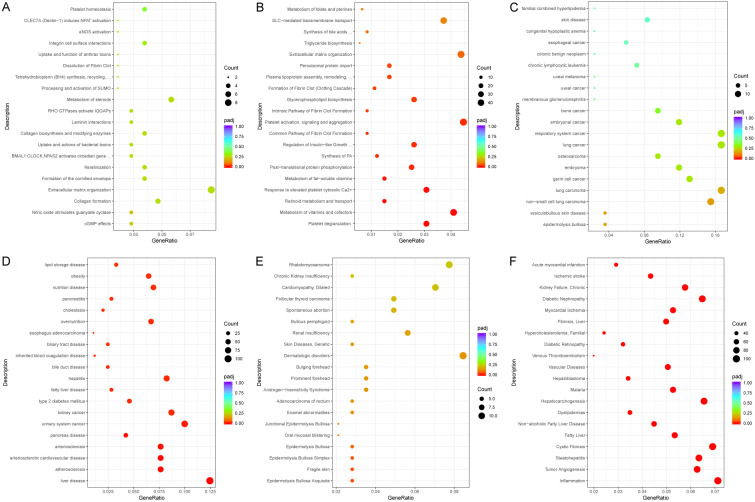
Hepatocellular carcinoma (HCC) is a worldwide malignancy with high morbidity and mortality. In this study, ubiquitin conjugating enzyme E2I (UBE2I), a small ubiquitin-like modifier E2 enzyme reportedly expressed in tumors, was examined for its potential effects in HCC. Bioinformatics analysis was performed based on HCCDB, TIMER, and Kaplan-Meier plotter databases to explore the clinical implications in HCC. An siRNA kit was used to downregulate UBE2I, and in vitro experiments-including migration, invasion and proliferation assays-were performed to examine UBE2I expression in HCC. Western blot (WB) was used to determine whether downregulated UBE2I expression influenced the prognosis of HCC via autophagy pathways. Finally, RNA-sequencing was performed to explore candidate molecular mechanisms underlying the effect of UBE2I. Bioinformatics analysis including stratification by alcohol ingestion and hepatitis status in HCC showed that highly expressed UBE2I was not only correlated with poor prognosis, but was also associated with immune infiltrates. In vitro experiments showed that high expression of UBE2I was associated with increased migration, invasion and proliferation of HCC cells. WB results indicated that downregulated expression of UBE2I was associated with higher levels of autophagy-related proteins including LC3A/B, Beclin-1 and ATG16L1. Moreover, RNA-sequencing results suggested that UBE2I was involved in hepatocarcinogenesis, non-alcohol fatty liver disease, steatohepatitis, liver fibrosis, inflammation, hepatoblastoma, tumor angiogenesis, type 2 mellitus diabetes, biliary tract disease and other diseases. We conclude that oncogene UBE2I is associated with poor prognosis of HCC via autophagy pathways and may be involved in hepatocarcinogenesis, tumor angiogenesis, non-alcohol fatty liver disease and inflammation.
Keywords: Hepatocellular carcinoma; RNA-sequencing; UBE2I; autophagy pathway; prognosis.
AJCR Copyright © 2020.
Conflict of interest statement
None.
Figures
Similar articles
-
UBE2I promotes metastasis and correlates with poor prognosis in hepatocellular carcinoma.Cancer Cell Int. 2020 Jun 12;20:234. doi: 10.1186/s12935-020-01311-x. eCollection 2020. Cancer Cell Int. 2020. PMID: 32536822 Free PMC article.
-
Combined Evaluation of mRNA and Protein Expression, Promoter Methylation, and Immune Infiltration of UBE2I in Pan-Digestive System Tumors.Oxid Med Cell Longev. 2022 Sep 20;2022:1129062. doi: 10.1155/2022/1129062. eCollection 2022. Oxid Med Cell Longev. 2022. PMID: 36193060 Free PMC article.
-
Activation of PI3K/AKT is involved in TINAG-mediated promotion of proliferation, invasion and migration of hepatocellular carcinoma.Cancer Biomark. 2018;23(1):33-43. doi: 10.3233/CBM-181277. Cancer Biomark. 2018. PMID: 29991125
-
Oncogene PLCE1 may be a diagnostic biomarker and prognostic biomarker by influencing cell cycle, proliferation, migration, and invasion ability in hepatocellular carcinoma cell lines.J Cell Physiol. 2020 Oct;235(10):7003-7017. doi: 10.1002/jcp.29596. Epub 2020 Feb 9. J Cell Physiol. 2020. PMID: 32037547
-
LncRNA H19 promotes the development of hepatitis B related hepatocellular carcinoma through regulating microRNA-22 via EMT pathway.Eur Rev Med Pharmacol Sci. 2019 Jun;23(12):5392-5401. doi: 10.26355/eurrev_201906_18208. Eur Rev Med Pharmacol Sci. 2019. PMID: 31298392
Cited by
-
Ubiquitin‑conjugating enzymes as potential biomarkers and therapeutic targets for digestive system cancers (Review).Oncol Rep. 2023 Mar;49(3):63. doi: 10.3892/or.2023.8500. Epub 2023 Feb 17. Oncol Rep. 2023. PMID: 36799184 Free PMC article.
-
Unraveling the Janus-Faced Role of Autophagy in Hepatocellular Carcinoma: Implications for Therapeutic Interventions.Int J Mol Sci. 2023 Nov 13;24(22):16255. doi: 10.3390/ijms242216255. Int J Mol Sci. 2023. PMID: 38003445 Free PMC article. Review.
-
NRIP1 aggravates lung injury caused by Pseudomonas aeruginosa in mice by increasing PIAS1 ubiquitination.Aging (Albany NY). 2022 Apr 23;14(8):3529-3539. doi: 10.18632/aging.204027. Epub 2022 Apr 23. Aging (Albany NY). 2022. PMID: 35460552 Free PMC article.
-
Bioinformatics analysis and experimental verification of the prognostic and biological significance mediated by fatty acid metabolism related genes for hepatocellular carcinoma.Front Oncol. 2022 Aug 2;12:972744. doi: 10.3389/fonc.2022.972744. eCollection 2022. Front Oncol. 2022. PMID: 35982956 Free PMC article.
-
Clinical significance of mitogen-activated protein kinase kinase kinases in hepatitis B virus -related hepatocellular carcinoma and underlying mechanism exploration.Bioengineered. 2022 Mar;13(3):6819-6838. doi: 10.1080/21655979.2022.2037224. Bioengineered. 2022. PMID: 35311629 Free PMC article.
References
LinkOut - more resources
Full Text Sources
Miscellaneous