. 2021 Jan 5;18(1):2.
doi: 10.1186/s12974-020-02041-7.

Mer regulates microglial/macrophage M1/M2 polarization and alleviates neuroinflammation following traumatic brain injury

Affiliations

Mer regulates microglial/macrophage M1/M2 polarization and alleviates neuroinflammation following traumatic brain injury

Haijian Wu et al. J Neuroinflammation. .

Abstract

Background: Traumatic brain injury (TBI) is a leading cause of death and disability worldwide. Microglial/macrophage activation and neuroinflammation are key cellular events following TBI, but the regulatory and functional mechanisms are still not well understood. Myeloid-epithelial-reproductive tyrosine kinase (Mer), a member of the Tyro-Axl-Mer (TAM) family of receptor tyrosine kinases, regulates multiple features of microglial/macrophage physiology. However, its function in regulating the innate immune response and microglial/macrophage M1/M2 polarization in TBI has not been addressed. The present study aimed to evaluate the role of Mer in regulating microglial/macrophage M1/M2 polarization and neuroinflammation following TBI.

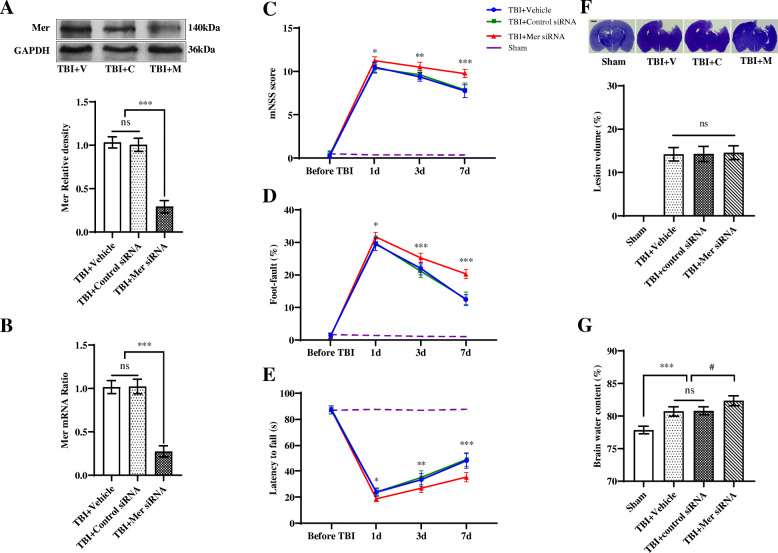
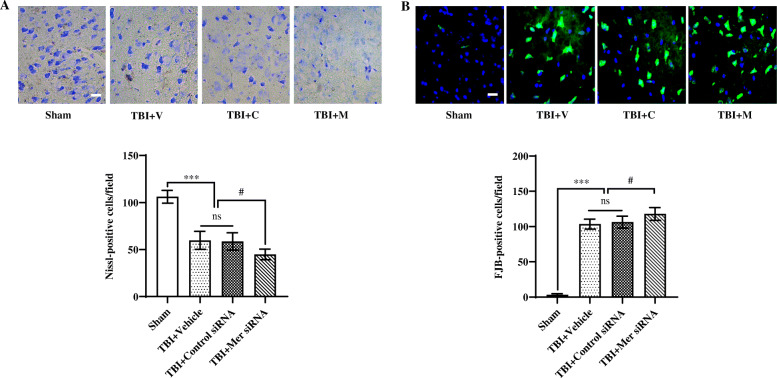
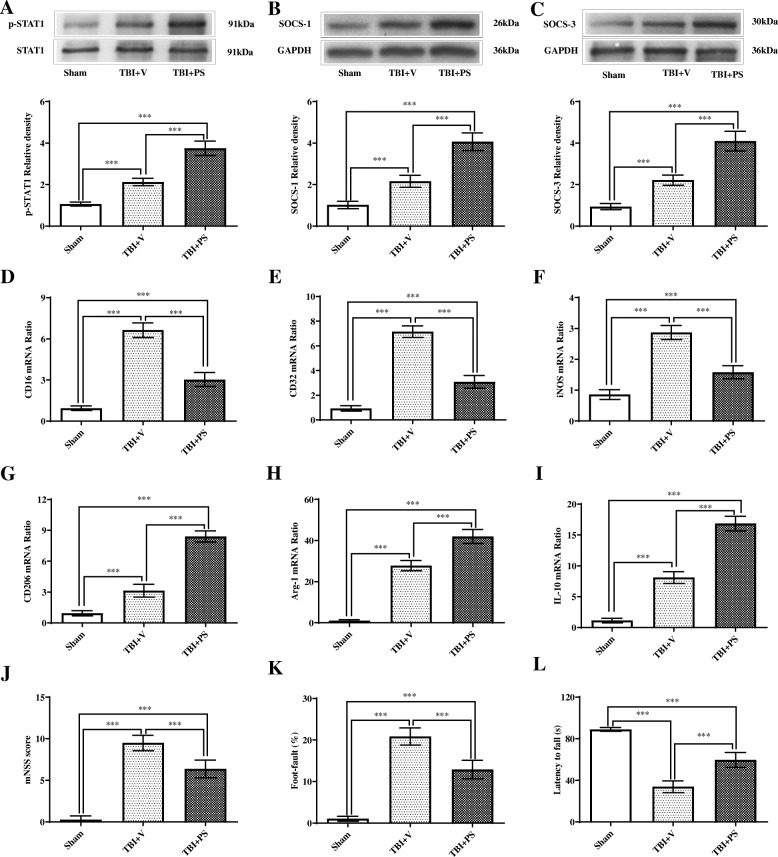
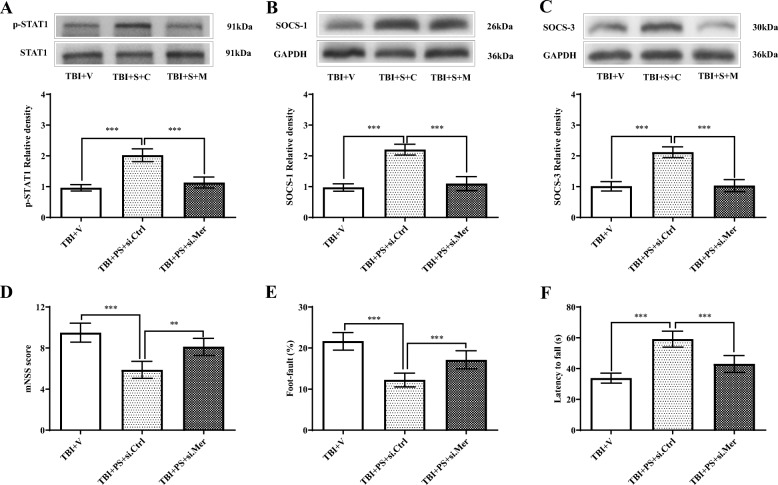
Methods: The controlled cortical impact (CCI) mouse model was employed. Mer siRNA was intracerebroventricularly administered, and recombinant protein S (PS) was intravenously applied for intervention. The neurobehavioral assessments, RT-PCR, Western blot, magnetic-activated cell sorting, immunohistochemistry and confocal microscopy analysis, Nissl and Fluoro-Jade B staining, brain water content measurement, and contusion volume assessment were performed.

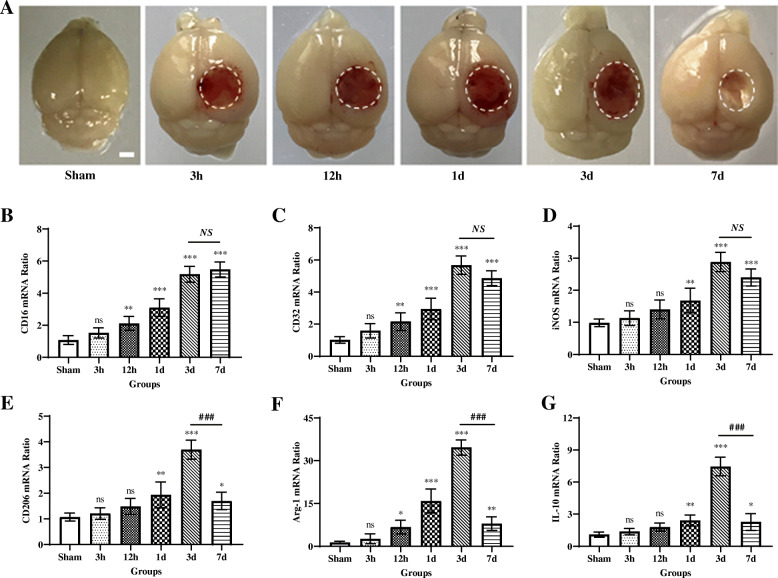
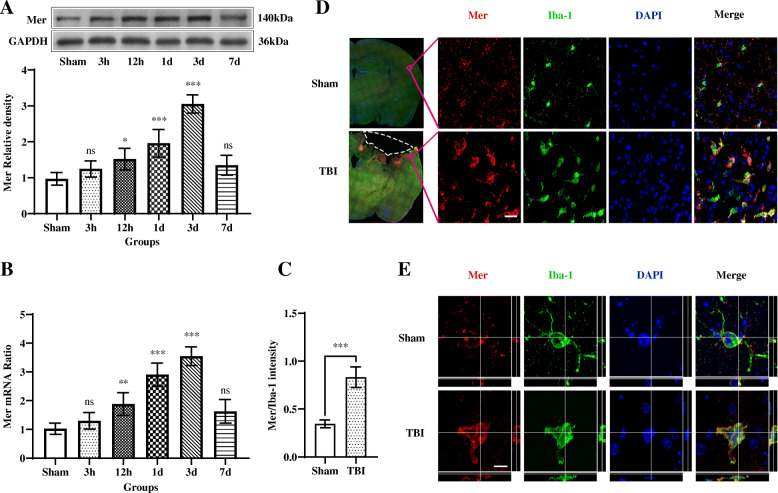
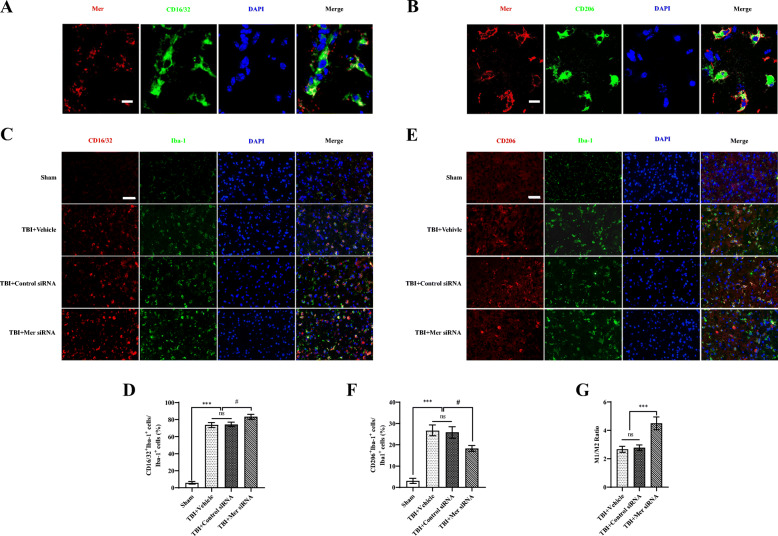
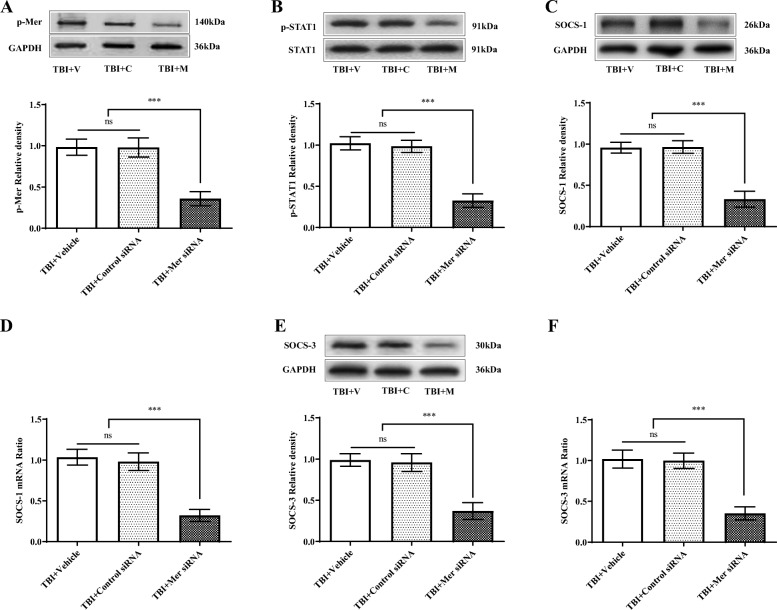
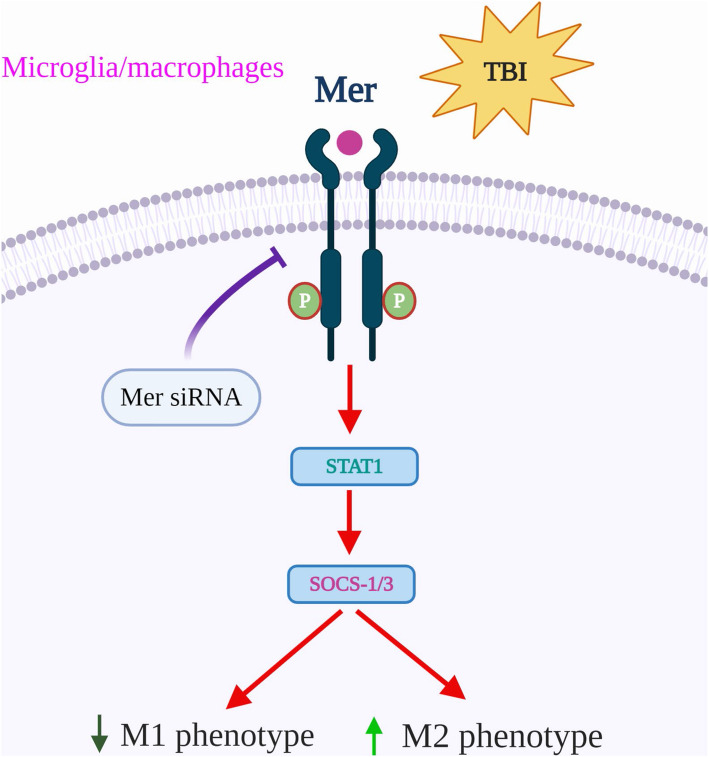
Results: Mer is upregulated and regulates microglial/macrophage M1/M2 polarization and neuroinflammation in the acute stage of TBI. Mechanistically, Mer activates the signal transducer and activator of transcription 1 (STAT1)/suppressor of cytokine signaling 1/3 (SOCS1/3) pathway. Inhibition of Mer markedly decreases microglial/macrophage M2-like polarization while increases M1-like polarization, which exacerbates the secondary brain damage and sensorimotor deficits after TBI. Recombinant PS exerts beneficial effects in TBI mice through Mer activation.

Conclusions: Mer is an important regulator of microglial/macrophage M1/M2 polarization and neuroinflammation, and may be considered as a potential target for therapeutic intervention in TBI.

Keywords: M1/M2 polarization; Mer; Microglia/macrophage; Neuroinflammation; TBI.


Conflict of interest statement

The authors declare that they have no conflict of interest.

Figures

Fig. 1
Fig. 1
Dynamic changes in mRNA expression of microglial/macrophage M1-like and M2-like phenotypic markers following TBI. a Representative photographs of whole brains in the sham and different traumatic brain injury (TBI) groups (at 3 h, 12 h, 1 day, 3 days, and 7 days post-insult, respectively). Scale bar = 1 mm. Quantitative reverse transcription-polymerase chain reaction (RT-PCR) was used to assess the mRNA expression levels of microglial/macrophage M1-like and M2-like phenotypic markers in the injured cortex at 3 h, 12 h, 1 day, 3 days, and 7 days after TBI or the equivalent area of the sham-operated brains. bd Expressions of mRNA of M1-like phenotypic markers, including CD16 (b), CD32 (c), and iNOS (d), were gradually increased over time from 12 h onward and remained elevated for at least 7 days after injury. eg Expressions of mRNA of M2-like phenotypic markers, including CD206 (e), Arg-1 (f), and IL-10 (g), were significantly upregulated at 1 day, 12 h, and 1 day after TBI, respectively, and all peaked around day 3 post-injury, then declined dramatically on day 7, even though they did not return to baseline levels. In bg, data are expressed as fold change. n = 6 mice per group. ns, nonsignificant, p > 0.05; *, p < 0.05; **, p < 0.01; ***, p < 0.001; versus sham-operated controls; NS, nonsignificant, p > 0.05; ###, p < 0.001; versus the TBI group on day 3. One-way ANOVA followed by Bonferroni’s post hoc tests
Fig. 2
Fig. 2
Expression patterns and cellular localization of Mer following TBI. a Representative immunoblots and quantification showing the expression level of Mer protein in the injured cortex at 3 h, 12 h, 1 day, 3 days, and 7 days after TBI or the equivalent area of the sham-operated brains. Data are expressed as fold change compared to sham-operated controls. n = 6 mice per group. b Quantitative RT-PCR was used to assess the mRNA expression level of Mer in the injured cortex at 3 h, 12 h, 1 day, 3 days, and 7 days after TBI or the equivalent area of the sham-operated brains. Data are expressed as fold change compared to sham-operated controls. n = 6 mice per group. Double immunofluorescent staining of Mer with the microglial/macrophage marker Iba-1 in the ipsilateral cerebral cortex was performed at 3 days post-TBI or sham operation. c Fluorescence intensity quantification of Mer expression in activated microglia/macrophages in the impacted cortical area at 3 days after TBI, compared to that in resting microglia/macrophages from sham-operated brains. n = 6 mice per group. d Low-magnification images of the brain (left) indicate the region of interest. Representative confocal images from the ipsilateral cortex (right) showing Mer was abundantly expressed in the plasma membrane of microglia/macrophages and substantially upregulated in activated microglia/macrophages following TBI. The dotted white area indicates contusion region. Scale bar = 15 μm. e Confocal microscopy analysis at a single-cell resolution showing Mer expression was substantially upregulated in the activated microglia/macrophages with phagocytotic morphology at 3 days post-TBI. Orthogonal views demonstrated the colocalization of Mer and Iba-1 in microglia/macrophages. Scale bar = 5 μm. In a, b, data are presented as mean ± SD; *, p < 0.05; **, p < 0.01; ***, p < 0.001; ns, nonsignificant, p > 0.05; versus sham-operated controls; one-way ANOVA followed by Bonferroni’s post hoc tests. In c, data are presented as mean ± SD; ***, p < 0.001 by Student’s t test
Fig. 3
Fig. 3
In vivo knockdown of Mer worsened the functional outcomes after TBI. a Western blot was used to assess the knockdown efficacy of Mer siRNA. Representative immunoblots and quantification showing Mer siRNA inhibited the expression of Mer protein in the injured cortex at 3 days post-TBI. TBI + vehicle: TBI + V, TBI + control siRNA: TBI + C, TBI + Mer siRNA: TBI + M. GAPDH: loading control. Data are expressed as fold change compared to the TBI + V group; n = 6 mice per group. b Quantitative RT-PCR analysis also showing Mer siRNA significantly inhibited the expression of Mer mRNA in the injured cortex at 3 days post-TBI. Data are expressed as fold change compared to the TBI + V group; n = 6 mice per group. ce Modified neurological severity scores (mNSS) (c), foot-fault test (d), and rotarod test (e) were performed before and 1, 3, and 7 days after TBI. n = 8 mice per group. f Quantification of TBI-induced lesion volume at 3 days post-insult. n = 6 mice per group. Scale bar = 1 mm. g Cerebral edema was measured by brain water content. Mer siRNA significantly elevated brain edema level at 3 days post-injury, when compared to both the vehicle and control siRNA group. n = 8 mice per group. In ag, data are presented as mean ± SD; *, #, p < 0.05; **, p < 0.01; ***, p < 0.001; ns, nonsignificant, p > 0.05. In a, b, f, g, one-way ANOVA followed by Bonferroni’s post hoc tests. In ce, two-way ANOVA followed by Bonferroni’s post hoc tests
Fig. 4
Fig. 4
Mer modulated microglial/macrophage M1/M2 polarization after TBI. a Representative images of immunofluorescent staining for Mer (red), CD16/32 (green), and DAPI (blue) showing Mer was expressed in CD16/32-positive cells in the perilesional area of cortex at 3 days post-TBI. Scale bar = 10 μm. b Representative images of immunofluorescent staining for Mer (red), CD206 (green), and DAPI (blue) showing Mer was expressed in CD206-positive cells in the perilesional area of cortex at 3 days post-TBI. Scale bar = 10  μm. c Representative images of immunofluorescent staining for CD16/32 (red), Iba-1 (green), and DAPI (blue) in the ipsilateral cortex at 3 days post-TBI. Scale bar = 50 μm. d Quantification showing the percentage of CD16/32 and Iba-1 double-positive cells was significantly increased in the cortex on day 3 after TBI, which was further elevated in the Mer siRNA group. n = 6 mice per group. e Representative images of immunofluorescent staining for Mer (red), CD206 (green), and DAPI (blue) in the ipsilateral cortex at 3 days post-TBI. Scale bar = 50 μm. f Quantification showing the percentage of CD206 and Iba-1 double-positive cells increased significantly in the ipsilateral cortex on day 3 after TBI; however, it significantly decreased following Mer siRNA administration. g The ratio between CD16/32+ Iba-1+ M1-like cells and CD206+ Iba-1+ M2-like cells nearly doubled after Mer siRNA administration. In d, f, and g, data are presented as mean ± SD; #, p < 0.05; ***, p < 0.001; ns, nonsignificant, p > 0.05. One-way ANOVA followed by Bonferroni’s post hoc tests
Fig. 5
Fig. 5
Inhibition of Mer aggravated neuronal damage and degeneration following TBI. a Representative images of Nissl staining in the ipsilateral cortex from the sham, TBI + vehicle (TBI + V), TBI + control siRNA (TBI + C), and TBI + Mer siRNA (TBI + M) groups, respectively. Quantification analysis showing TBI caused a significant decrease in the number of Nissl-positive cells in the ipsilateral cortex at 3 days post-TBI, and Mer siRNA application further decreased the number of Nissl-positive cells in the injured cortex after TBI. n = 6 mice per group. Scale bar = 20 μm. b Representative images of Fluoro-Jade B (FJB) staining in the ipsilateral cortex from the sham, TBI + V, TBI + C, and TBI + M groups, respectively. Quantification analysis showing TBI caused a significant increase in the number of FJB-positive cells in the ipsilateral cortex at 3 days post-TBI, and Mer siRNA application further increased the number of FJB-positive cells in the injured cortex after TBI. n = 6 mice per group. Scale bar = 15 μm. In a, b, data are presented as mean ± SD; #, p < 0.05; ***, p < 0.001; ns, nonsignificant, p > 0.05. One-way ANOVA followed by Bonferroni’s post hoc tests
Fig. 6.
Fig. 6.
Inhibition of Mer reduced STAT1 activation and SOCS expression following TBI. a, b, c, e Representative immunoblots and quantification showing the expression of phosphorylated Mer (p-Mer) (a), phosphorylated STAT1 (p-STAT1) (b), SOCS-1 (c), and SOCS-3 (e) was significantly inhibited by Mer siRNA administration on day 3 following TBI. TBI + vehicle: TBI + V, TBI + control siRNA: TBI + C; TBI + Mer siRNA: TBI + M. GAPDH: loading control. Data are expressed as fold change compared to the TBI + V group; n = 6 mice per group. d, f Quantitative RT-PCR analysis showing Mer siRNA application significantly inhibited the mRNA expression of SOCS-1 (d) and SOCS-3 (f) in the injured cortex at 3 days post-TBI. Data are expressed as fold change compared to the TBI + V group; n = 6 mice per group. In af, data are presented as Mean ± SD; ns, nonsignificant, p > 0.05; *** p < 0.001. One-way ANOVA followed by Bonferroni’s post hoc tests
Fig. 7
Fig. 7
Mer activation alleviated functional deficits following TBI. ac Representative immunoblots and quantification showing protein expression of p-STAT1 (a), SOCS-1 (b), and SOCS-3 (c) in the injured cortex at 3 days post-TBI; TBI + vehicle: TBI + V, TBI + recombinant protein S: TBI + PS. GAPDH: loading control. Data are expressed as fold change compared to the sham group; n = 6 mice per group. di Quantitative RT-PCR analysis of MACS-sorted CD11b-positive cells showing mRNA expression of CD16 (d), CD32 (e), iNOS (f), CD206 (g), Arg-1 (h), and IL-10 (i) in the injured cortex at 3 days post-TBI. GAPDH: loading control. Data are expressed as fold change compared to the sham group; n = 6 mice per group. jl Modified neurological severity scores (mNSS) (j), foot-fault test (k), and rotarod test (l) were performed at 3 days after TBI. n = 8 mice per group. In al, data are presented as mean ± SD; ***, p < 0.001. One-way ANOVA followed by Bonferroni’s post hoc tests
Fig. 8
Fig. 8
Inhibition of Mer abolished PS-mediated functional improvements following TBI. ac Representative immunoblots and quantification showing protein expression of p-STAT1 (a), SOCS-1 (b), and SOCS-3 (c) in the injured cortex at 3 days after TBI; TBI + vehicle: TBI + V, TBI + PS + control siRNA (si.Ctrl): TBI + S + C, TBI + S + Mer siRNA (si.Mer): TBI + S + M. GAPDH: loading control. Data are expressed as fold change compared to the TBI + V group; n = 6 mice per group. df Modified neurological severity scores (mNSS) (d), foot-fault test (e), and rotarod test (f) were performed at 3 days after TBI. n = 8 mice per group. In af, data are presented as mean ± SD; ***, p < 0.001. One-way ANOVA followed by Bonferroni’s post hoc tests
Fig. 9
Fig. 9
The proposed mechanism of Mer in regulating microglial/macrophage M1/M2 polarization and neuroinflammation following TBI. In the setting of TBI, Mer is upregulated and exerts protective effects via modulating microglial/macrophage M1/M2 polarization and neuroinflammation after injury. Specifically, activation of Mer signaling facilitates STAT1-mediated SOCS expression, which increases microglial/macrophage M2-like polarization while decreases M1-like polarization following TBI. In contrast, inhibition of Mer by siRNA markedly suppresses STAT1/SOCS signaling, thus decreasing microglial/macrophage M2-like polarization while increasing M1-like polarization after TBI

Similar articles

Cited by

References

    1. GBD 2016 Neurology Collaborators Global, regional, and national burden of neurological disorders, 1990-2016: a systematic analysis for the Global Burden of Disease Study 2016. Lancet Neurol. 2019;18:459–480. doi: 10.1016/S1474-4422(18)30499-X. - DOI - PMC - PubMed
    1. Capizzi A, Woo J, Verduzco-Gutierrez M. Traumatic brain injury: an overview of epidemiology, pathophysiology, and medical management. Med Clin North Am. 2020;104:213–238. doi: 10.1016/j.mcna.2019.11.001. - DOI - PubMed
    1. Dewan MC, Rattani A, Gupta S, Baticulon RE, Hung Y-C, Punchak M, et al. Estimating the global incidence of traumatic brain injury. J Neurosurg. 2019;130:1080–97. doi: 10.3171/2017.10.JNS17352. - DOI - PubMed
    1. Blennow K, Hardy J, Zetterberg H. The neuropathology and neurobiology of traumatic brain injury. Neuron. 2012;76:886–899. doi: 10.1016/j.neuron.2012.11.021. - DOI - PubMed
    1. Wilson L, Stewart W, Dams-O’Connor K, Diaz-Arrastia R, Horton L, Menon DK, et al. The chronic and evolving neurological consequences of traumatic brain injury. Lancet Neurol. 2017;16:813–825. doi: 10.1016/S1474-4422(17)30279-X. - DOI - PMC - PubMed