

Prescription Opioid Use and Laboratory Value Derangements: A Cross-Sectional Analysis of NHANES Data
- PMID: 33400442
- PMCID: PMC9810267
Prescription Opioid Use and Laboratory Value Derangements: A Cross-Sectional Analysis of NHANES Data
Abstract
Background: The use of opioids for the treatment of pain is a risk versus benefit analysis and metabolic disease is an often overlooked variable in the equation and may lead to increased risk of comorbidities of cardiovascular and cerebrovascular disease and diabetes.
Objectives: Our objective was to identify and describe abnormalities among the comprehensive metabolic and lipid panels of individuals taking prescription opioids.
Study design: We performed a cross-sectional study of the laboratory values with 3 cycles (2011-2016) of the National Health and Nutrition Examination Survey (NHANES) in March 2020.
Setting: NHANES sampling is conducted using a multistaged, stratified, cluster sampling technique to create a representative sample of the United States.
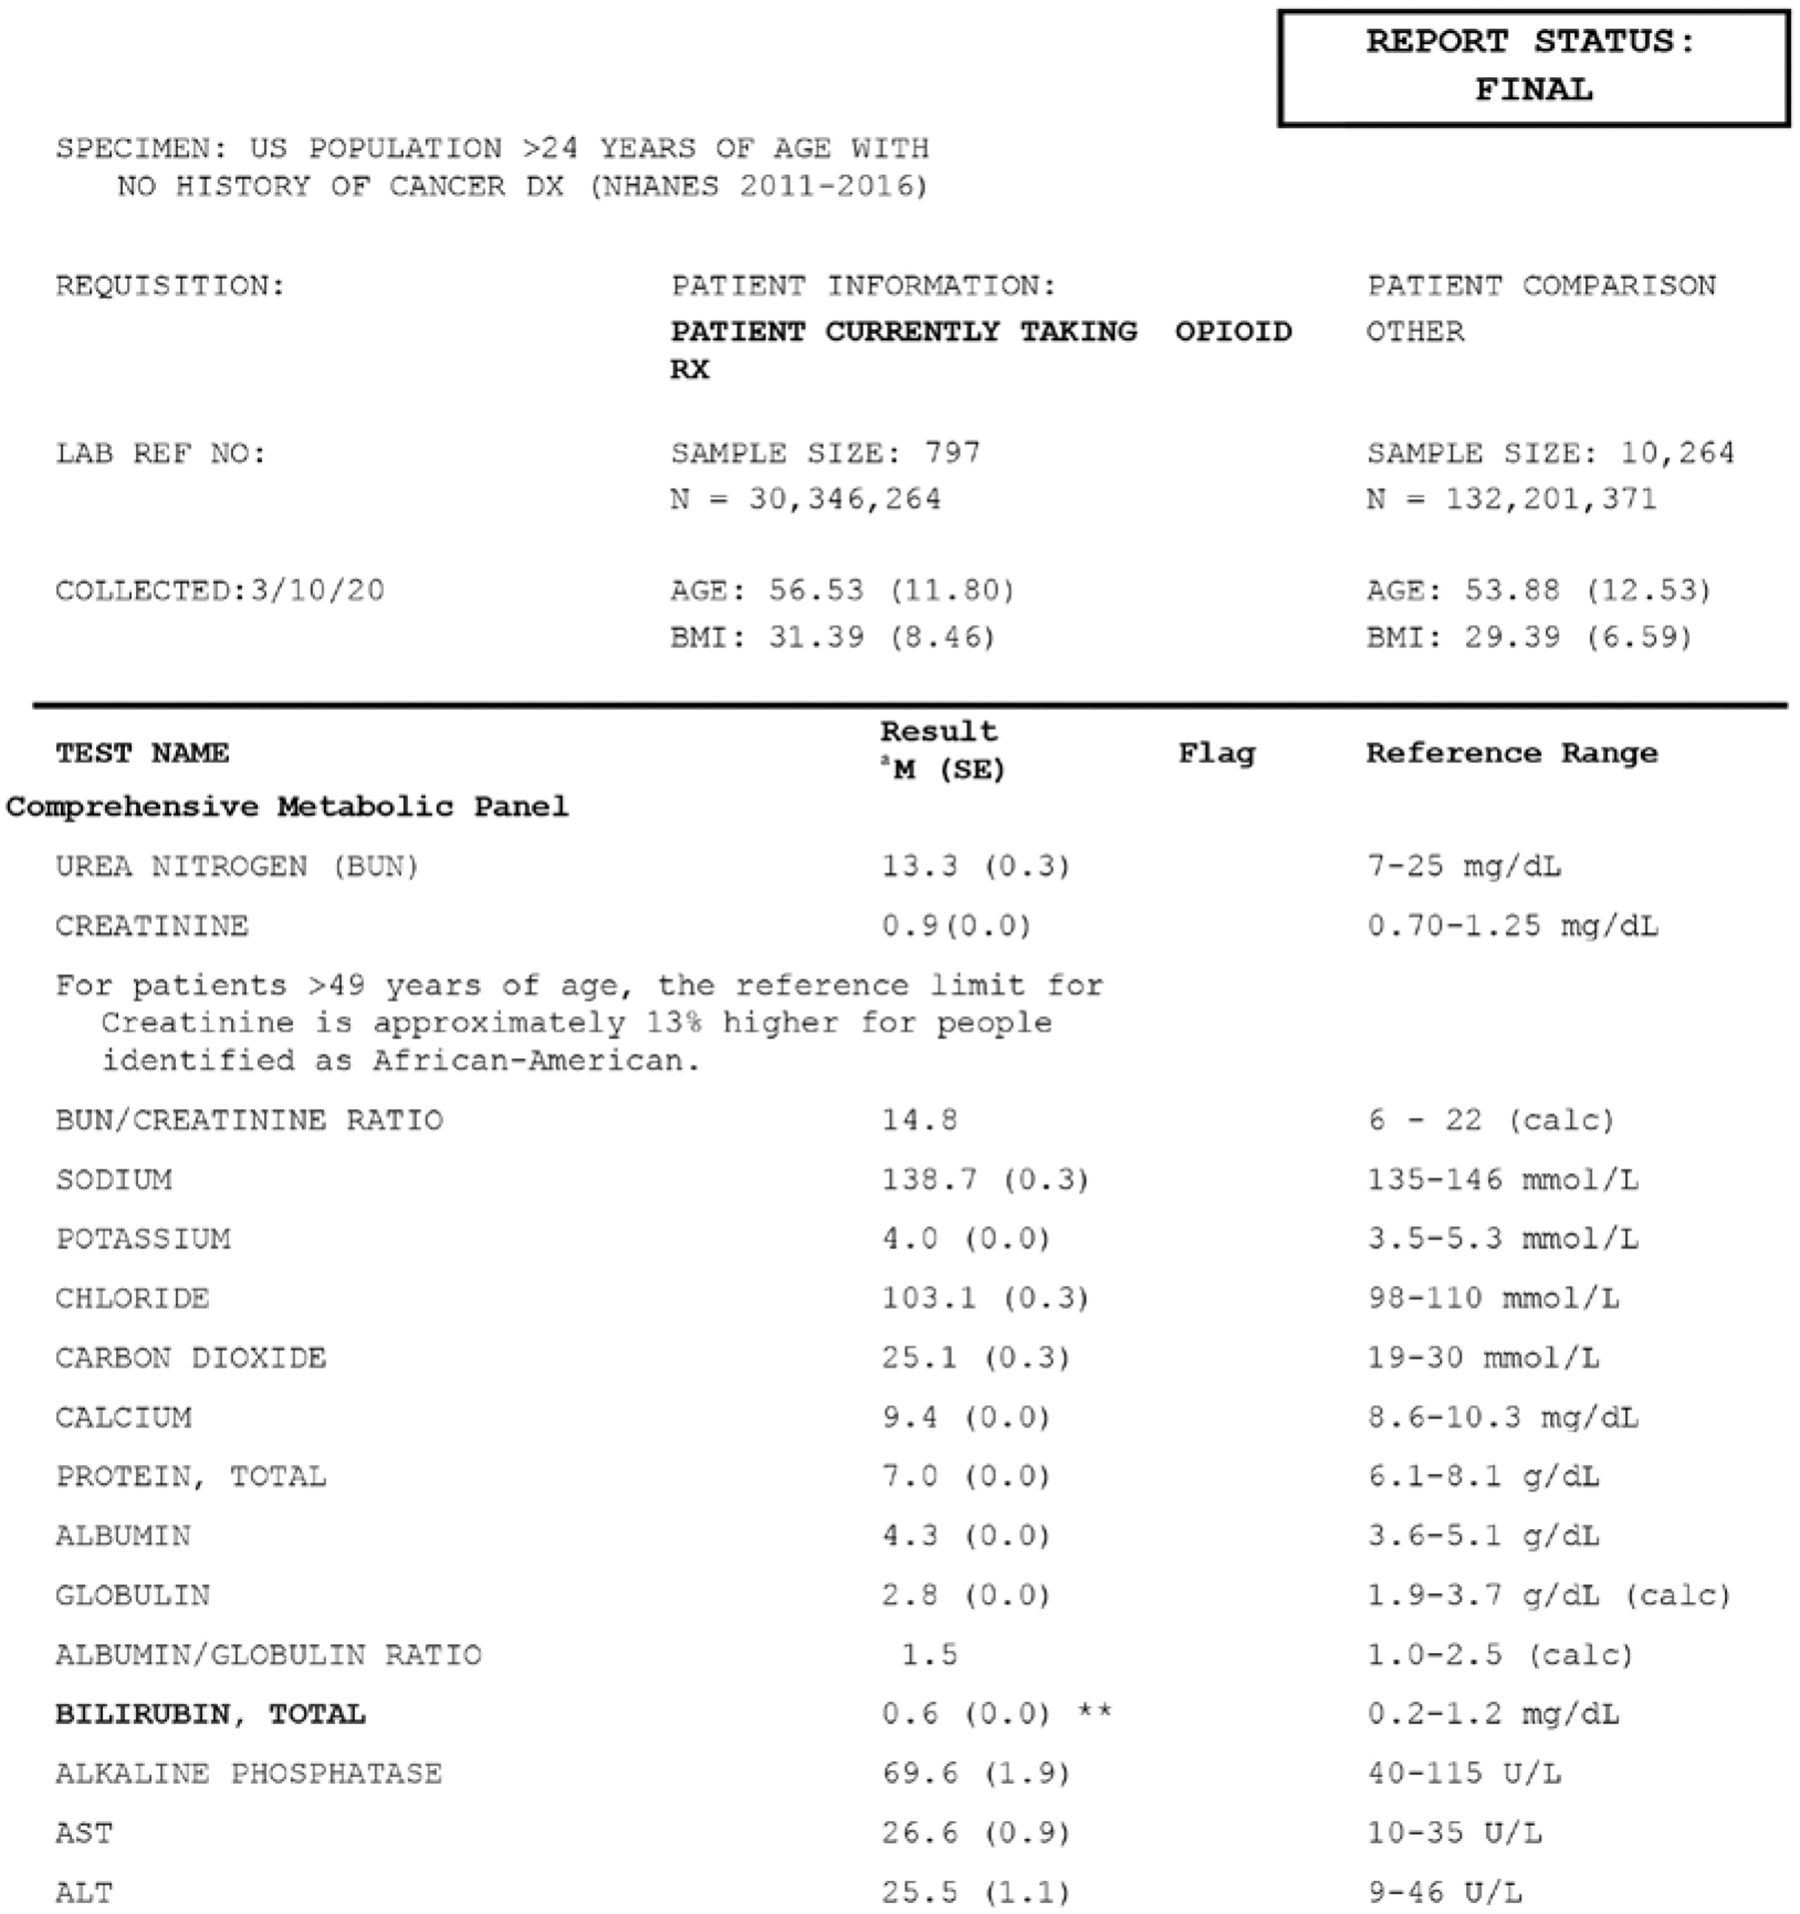
Methods: We excluded patients with histories of cancer and under the age of 25 years. Our final sample size was 11,061 (n = 162,547,635), with 797 reportedly using a prescription opioid in the past 30 days-a weighted percent representing 22.95% of the US population. Our analyses identified mean differences in biomarkers between individuals taking prescription opioids and the US population.
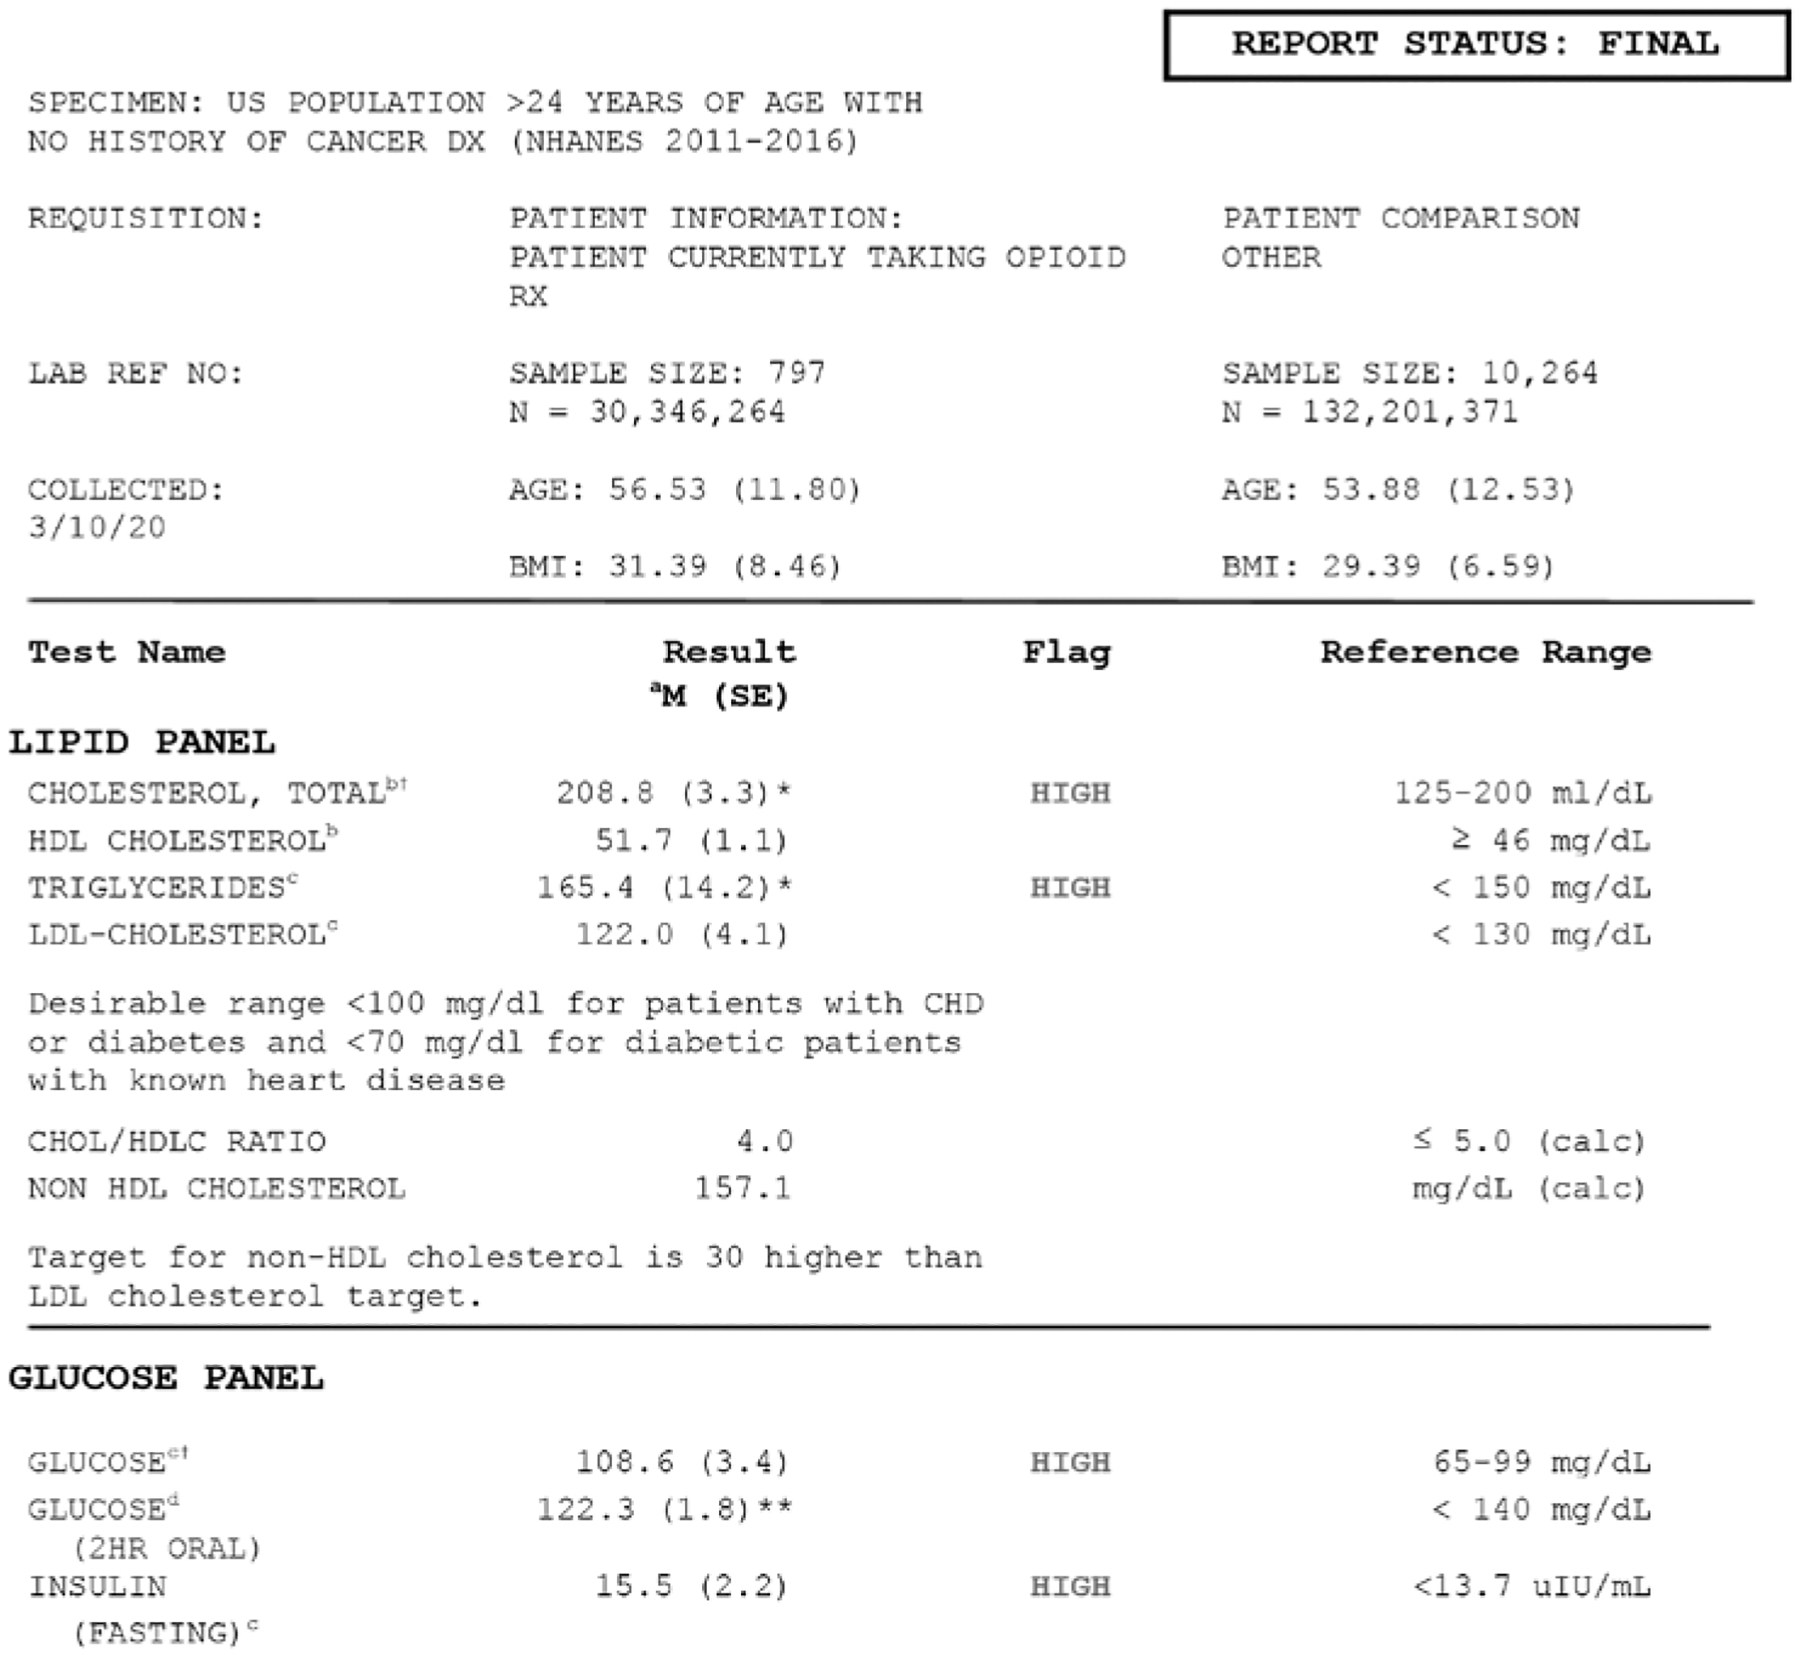
Results: Laboratory values from the comprehensive metabolic panel were all within reference ranges for both groups, with only bilirubin levels being statistically lower in the group currently taking prescription opioids. Values from the lipid panel of both the opioid using and comparison groups were above reference range for total cholesterol and fasting glucose. The opioid using group was also higher than the reference range for triglycerides (mean [M] = 165.4, standard deviation [SD] = 14.2) and insulin (M = 15.5, SD = 2.2), whereas the comparison group was not. The oral glucose measure was within normal ranges for both groups; however, the opioid using group was 13.7 points higher than the comparison group (M = 122.3, SD = 1.8; M = 108.6, SD = 4.0; P < 0.01).
Limitations: While our study uses a large sample for a robust generalizable analysis it is a correlation study and a longitudinal cohort would provide better evidence linking potential disease states to prescription opioid use.
Conclusions: Although all Americans should be alarmed at the lipid levels reported in this study, specific combinations of heightened lipid laboratory values among prescription opioid users accelerate the trajectories toward comorbidities-heart disease, cerebrovascular disease, and diabetes-leading to diminished quality of life. Therefore pain management and comprehensive drug recovery programs should include nutritional counseling and physical activity as part of their overall treatment plan.
Keywords: NHANES; analgesics; lab values; pain management; Opioid use.
Conflict of interest statement
Conflict of interest: AEE is an employee of Grünenthal Pharma, Spain.
Figures
Similar articles
-
Association Between Benzodiazepine Use With or Without Opioid Use and All-Cause Mortality in the United States, 1999-2015.JAMA Netw Open. 2020 Dec 1;3(12):e2028557. doi: 10.1001/jamanetworkopen.2020.28557. JAMA Netw Open. 2020. PMID: 33295972 Free PMC article.
-
Trends in Urine Drug Monitoring Among Persons Receiving Long-Term Opioids and Persons with Opioid Use Disorder in the United States.Pain Physician. 2021 Mar;24(2):E249-E256. Pain Physician. 2021. PMID: 33740362 Free PMC article.
-
The contribution of obesity to prescription opioid use in the United States.Pain. 2019 Oct;160(10):2255-2262. doi: 10.1097/j.pain.0000000000001612. Pain. 2019. PMID: 31149978 Free PMC article.
-
Association Between Opioid Prescriptions and Non-US-Born Status in the US.JAMA Netw Open. 2020 Jun 1;3(6):e206745. doi: 10.1001/jamanetworkopen.2020.6745. JAMA Netw Open. 2020. PMID: 32484555 Free PMC article.
-
Lipid Screening in Childhood for Detection of Multifactorial Dyslipidemia: A Systematic Evidence Review for the U.S. Preventive Services Task Force [Internet].Rockville (MD): Agency for Healthcare Research and Quality (US); 2016 Aug. Report No.: 14-05204-EF-1. Rockville (MD): Agency for Healthcare Research and Quality (US); 2016 Aug. Report No.: 14-05204-EF-1. PMID: 27559550 Free Books & Documents. Review.
Cited by
-
Substance use and common contributors to morbidity: A genetics perspective.EBioMedicine. 2022 Sep;83:104212. doi: 10.1016/j.ebiom.2022.104212. Epub 2022 Aug 12. EBioMedicine. 2022. PMID: 35970022 Free PMC article. Review.
References
-
- Gregorian RS Jr, Gasik A, Kwong WJ, Voeller S, Kavanagh S. Importance of side effects in opioid treatment: A trade-off analysis with patients and physicians. J Pain 2010; 11:1095–1108. - PubMed
-
- Atici S, Cinel I, Cinel L, Doruk N, Eskandari G, Oral U. Liver and kidney toxicity in chronic use of opioids: An experimental long term treatment model. J Biosci 2005; 30:245–252. - PubMed
-
- Elmanama AA, Abu NE, Essawaf HN. Tramadol-induced liver and kidney toxicity among abusers in Gaza Strip, Palestine. Jordan J Biol Sci 2015; 8:133–137.
Publication types
MeSH terms
Substances
Grants and funding
LinkOut - more resources
Full Text Sources
Medical
Miscellaneous