Genome-Scale Identification of SARS-CoV-2 and Pan-coronavirus Host Factor Networks
- PMID: 33382968
- PMCID: PMC7796900
- DOI: 10.1016/j.cell.2020.12.006
Genome-Scale Identification of SARS-CoV-2 and Pan-coronavirus Host Factor Networks
Abstract
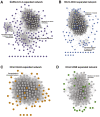
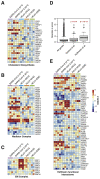
The coronavirus disease 2019 (COVID-19) pandemic has claimed the lives of over one million people worldwide. The causative agent, severe acute respiratory syndrome coronavirus 2 (SARS-CoV-2), is a member of the Coronaviridae family of viruses that can cause respiratory infections of varying severity. The cellular host factors and pathways co-opted during SARS-CoV-2 and related coronavirus life cycles remain ill defined. To address this gap, we performed genome-scale CRISPR knockout screens during infection by SARS-CoV-2 and three seasonal coronaviruses (HCoV-OC43, HCoV-NL63, and HCoV-229E). These screens uncovered host factors and pathways with pan-coronavirus and virus-specific functional roles, including major dependency on glycosaminoglycan biosynthesis, sterol regulatory element-binding protein (SREBP) signaling, bone morphogenetic protein (BMP) signaling, and glycosylphosphatidylinositol biosynthesis, as well as a requirement for several poorly characterized proteins. We identified an absolute requirement for the VMP1, TMEM41, and TMEM64 (VTT) domain-containing protein transmembrane protein 41B (TMEM41B) for infection by SARS-CoV-2 and three seasonal coronaviruses. This human coronavirus host factor compendium represents a rich resource to develop new therapeutic strategies for acute COVID-19 and potential future coronavirus pandemics.
Keywords: COVID-19; CRISPR; HCoV-229E; HCoV-NL63; HCoV-OC43; SARS-CoV-2; TMEM41B; coronavirus; genetic screens; host factors.
Copyright © 2020 Elsevier Inc. All rights reserved.
Conflict of interest statement
Declaration of Interests S.W.L. is an advisor for and has equity in the following biotechnology companies: ORIC Pharmaceuticals, Faeth Therapeutics, Blueprint Medicines, Geras Bio, Mirimus Inc., PMV Pharmaceuticals, and Constellation Pharmaceuticals. C.M.R. is a founder of Apath LLC; a Scientific Advisory Board member of Imvaq Therapeutics; Vir Biotechnology, and Arbutus Biopharma; and an advisor for Regulus Therapeutics and Pfizer.
Figures


Update of
-
Genome-scale identification of SARS-CoV-2 and pan-coronavirus host factor networks.bioRxiv [Preprint]. 2020 Oct 8:2020.10.07.326462. doi: 10.1101/2020.10.07.326462. bioRxiv. 2020. Update in: Cell. 2021 Jan 7;184(1):120-132.e14. doi: 10.1016/j.cell.2020.12.006 PMID: 33052332 Free PMC article. Updated. Preprint.
Similar articles
-
Genome-scale identification of SARS-CoV-2 and pan-coronavirus host factor networks.bioRxiv [Preprint]. 2020 Oct 8:2020.10.07.326462. doi: 10.1101/2020.10.07.326462. bioRxiv. 2020. Update in: Cell. 2021 Jan 7;184(1):120-132.e14. doi: 10.1016/j.cell.2020.12.006 PMID: 33052332 Free PMC article. Updated. Preprint.
-
Genetic Screens Identify Host Factors for SARS-CoV-2 and Common Cold Coronaviruses.Cell. 2021 Jan 7;184(1):106-119.e14. doi: 10.1016/j.cell.2020.12.004. Epub 2020 Dec 9. Cell. 2021. PMID: 33333024 Free PMC article.
-
Seasonal human coronaviruses OC43, 229E, and NL63 induce cell surface modulation of entry receptors and display host cell-specific viral replication kinetics.Microbiol Spectr. 2024 Jul 2;12(7):e0422023. doi: 10.1128/spectrum.04220-23. Epub 2024 Jun 12. Microbiol Spectr. 2024. PMID: 38864599 Free PMC article.
-
An overview on the seven pathogenic human coronaviruses.Rev Med Virol. 2022 Mar;32(2):e2282. doi: 10.1002/rmv.2282. Epub 2021 Aug 2. Rev Med Virol. 2022. PMID: 34339073 Review.
-
Antiviral strategies against human coronaviruses.Infect Disord Drug Targets. 2007 Mar;7(1):59-66. doi: 10.2174/187152607780090757. Infect Disord Drug Targets. 2007. PMID: 17346212 Review.
Cited by
-
Influenza A virus infection activates STAT3 to enhance SREBP2 expression, cholesterol biosynthesis, and virus replication.iScience. 2024 Jun 29;27(8):110424. doi: 10.1016/j.isci.2024.110424. eCollection 2024 Aug 16. iScience. 2024. PMID: 39108727 Free PMC article.
-
Minor intron-containing genes as an ancient backbone for viral infection?PNAS Nexus. 2024 Jan 18;3(1):pgad479. doi: 10.1093/pnasnexus/pgad479. eCollection 2024 Jan. PNAS Nexus. 2024. PMID: 38274120 Free PMC article.
-
COVID-19 Salivary Protein Profile: Unravelling Molecular Aspects of SARS-CoV-2 Infection.J Clin Med. 2022 Sep 22;11(19):5571. doi: 10.3390/jcm11195571. J Clin Med. 2022. PMID: 36233441 Free PMC article.
-
Autophagy in severe acute respiratory syndrome coronavirus 2 infection.Curr Opin Physiol. 2022 Oct;29:100596. doi: 10.1016/j.cophys.2022.100596. Epub 2022 Sep 27. Curr Opin Physiol. 2022. PMID: 36187896 Free PMC article. Review.
-
Published Anti-SARS-CoV-2 In Vitro Hits Share Common Mechanisms of Action that Synergize with Antivirals.bioRxiv [Preprint]. 2021 Mar 4:2021.03.04.433931. doi: 10.1101/2021.03.04.433931. bioRxiv. 2021. Update in: Brief Bioinform. 2021 Nov 5;22(6):bbab249. doi: 10.1093/bib/bbab249 PMID: 33688643 Free PMC article. Updated. Preprint.
References
-
- Aikawa J., Grobe K., Tsujimoto M., Esko J.D. Multiple isozymes of heparan sulfate/heparin GlcNAc N-deacetylase/GlcN N-sulfotransferase. Structure and activity of the fourth member, NDST4. J. Biol. Chem. 2001;276:5876–5882. - PubMed
-
- Baggen J., Persoons L., Jansen S., Vanstreels E., Jacquemyn M., Jochmans D., Neyts J., Dallmeier K., Maes P., Daelemans D. Identification of TMEM106B as proviral host factor for SARS-CoV-2. bioRxiv. 2020 doi: 10.1101/2020.09.28.316281. - DOI
-
- Bai X., Zhou D., Brown J.R., Crawford B.E., Hennet T., Esko J.D. Biosynthesis of the linkage region of glycosaminoglycans: cloning and activity of galactosyltransferase II, the sixth member of the beta 1,3-galactosyltransferase family (beta 3GalT6) J. Biol. Chem. 2001;276:48189–48195. - PubMed
Publication types
MeSH terms
Substances
Grants and funding
- R01 AI150275/AI/NIAID NIH HHS/United States
- R01 AI116943/AI/NIAID NIH HHS/United States
- P30 CA016087/CA/NCI NIH HHS/United States
- R01 AI091707/AI/NIAID NIH HHS/United States
- U01 CA213359/CA/NCI NIH HHS/United States
- R01 CA190261/CA/NCI NIH HHS/United States
- R01 AI124690/AI/NIAID NIH HHS/United States
- F32 AI133910/AI/NIAID NIH HHS/United States
- P01 AI138938/AI/NIAID NIH HHS/United States
- P30 CA008748/CA/NCI NIH HHS/United States
- R01 CA213448/CA/NCI NIH HHS/United States
- U19 AI111825/AI/NIAID NIH HHS/United States
- R03 AI141855/AI/NIAID NIH HHS/United States
- T32 CA160001/CA/NCI NIH HHS/United States
- R21 AI161212/AI/NIAID NIH HHS/United States
- R01 AI143295/AI/NIAID NIH HHS/United States
- R21 AI142010/AI/NIAID NIH HHS/United States
LinkOut - more resources
Full Text Sources
Other Literature Sources
Molecular Biology Databases
Research Materials
Miscellaneous

