

Characterization of Antigenic Relatedness Among GI Norovirus Genotypes Using Serum Samples From Norovirus-Infected Patients and Mouse Sera
- PMID: 33363528
- PMCID: PMC7752868
- DOI: 10.3389/fmicb.2020.607723
Characterization of Antigenic Relatedness Among GI Norovirus Genotypes Using Serum Samples From Norovirus-Infected Patients and Mouse Sera
Abstract
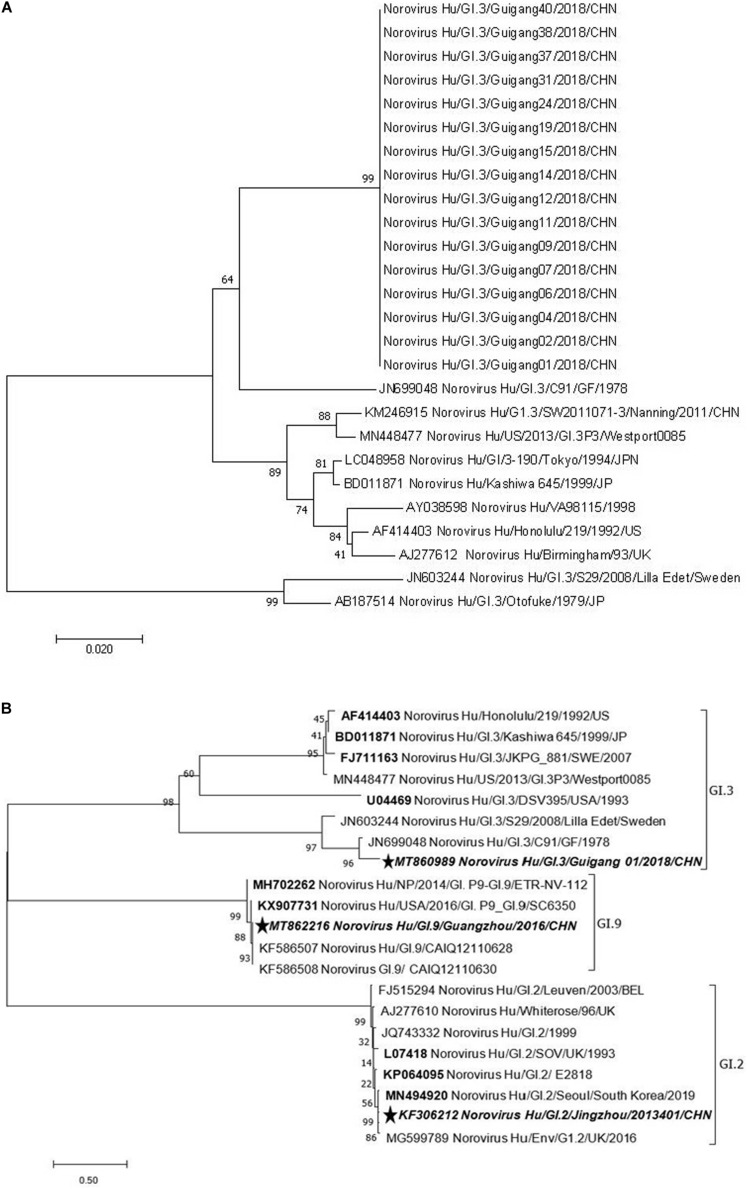
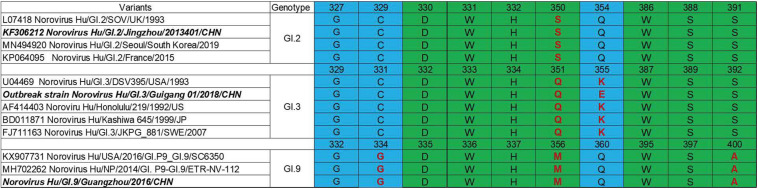
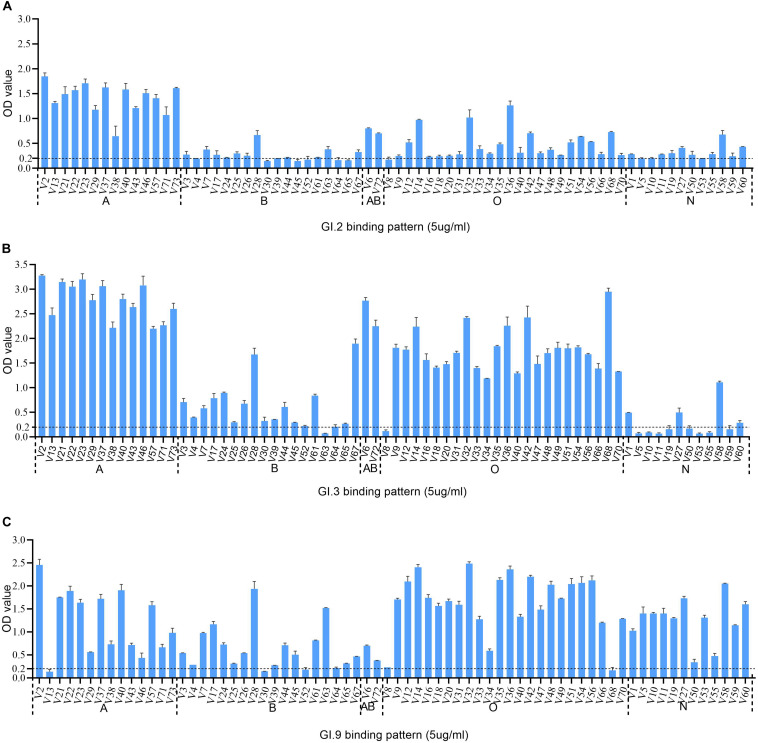
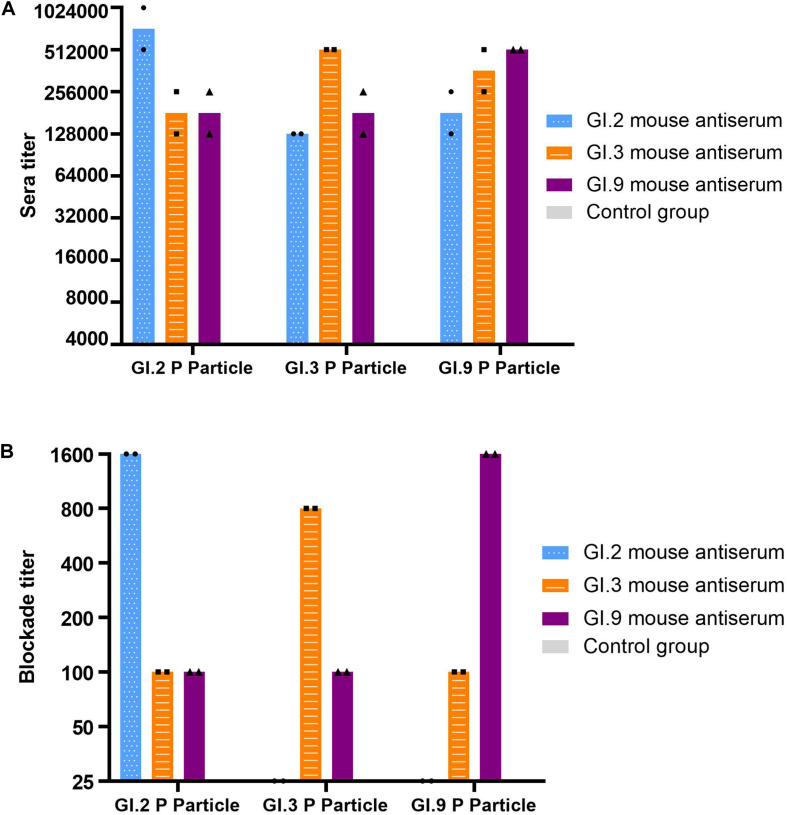
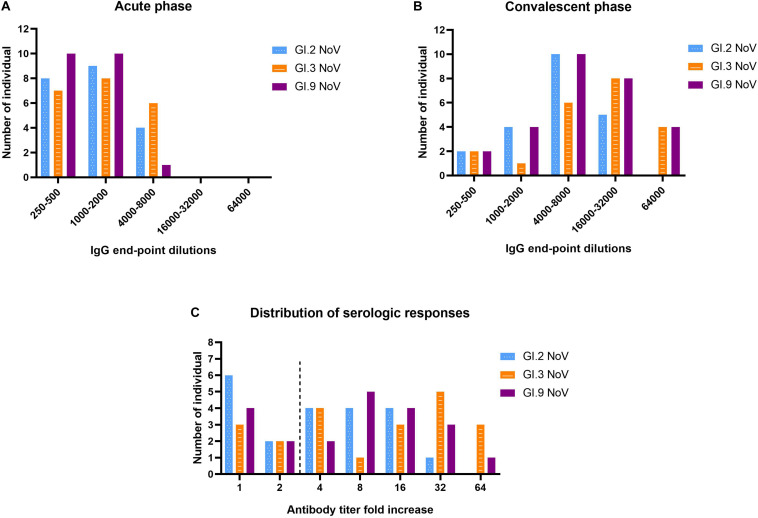
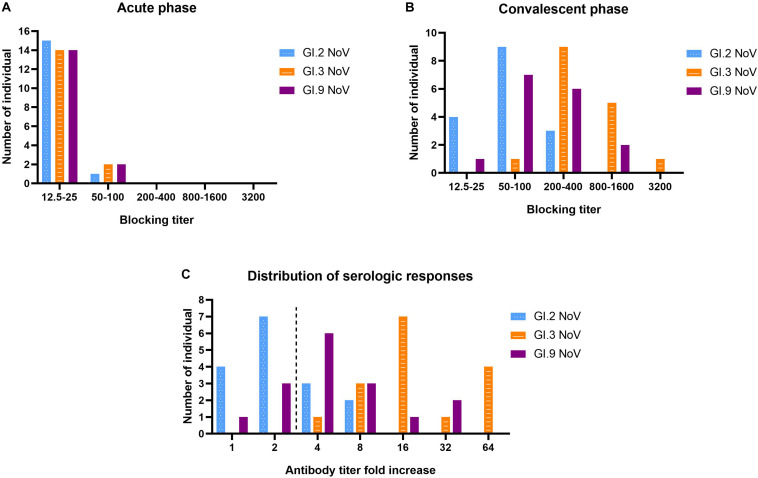
Characterizing diversity and the antigenic relatedness of norovirus remains a primary focus in understanding its biological properties and vaccine designs. The precise antigenic and serological features of GI genotypes have not been studied. The study represented an investigation on a gastroenteritis outbreak related to GI.3 norovirus and the three most detected GI genotypes, GI.2 (belonging to immunotype B), GI.3 and GI.9 (belonging to immunotype C), were selected to characterize their phylogenetic relationship, HBGA binding profiles and antigenic relatedness within (intra-immunotype), and between (inter-immunotypes) genotypes using mouse sera and patient's serum samples from the GI.3 related outbreak. Wide HBGA binding profiles and evolution of binding affinity were observed in the three GI genotypes studied. A low specific blockade antibody to GI.3 in the population generated the pool of susceptible individuals and supported virus spread in the outbreak. We found strong blockade immune response in homologous strains, moderate intra-immunotype blockade but weak inter-immunotypes blockade in humans following GI.3 norovirus infections. These findings further support the immunotypes grouping and will be valuable for optimizing the design of norovirus vaccine.
Keywords: GI genotypes; HBGA; cross-blockade; cross-reactivity; immunotypes; norovirus; vaccine strategy.
Copyright © 2020 Xie, Chen, Yu, Pei, Koroma, Wang, Qiu, Hou, Yu, Zhang and Dai.
Conflict of interest statement
The authors declare that the research was conducted in the absence of any commercial or financial relationships that could be construed as a potential conflict of interest.
Figures
Similar articles
-
Serological surveillance of GI norovirus reveals persistence of blockade antibody in a Jidong community-based prospective cohort, 2014-2018.Front Cell Infect Microbiol. 2023 Dec 18;13:1258550. doi: 10.3389/fcimb.2023.1258550. eCollection 2023. Front Cell Infect Microbiol. 2023. PMID: 38188632 Free PMC article.
-
Biological and immunological characterization of norovirus major capsid proteins from three different genotypes.Microb Pathog. 2016 Jan;90:78-83. doi: 10.1016/j.micpath.2015.11.022. Epub 2015 Nov 23. Microb Pathog. 2016. PMID: 26616166
-
Broad blockade antibody responses in human volunteers after immunization with a multivalent norovirus VLP candidate vaccine: immunological analyses from a phase I clinical trial.PLoS Med. 2015 Mar 24;12(3):e1001807. doi: 10.1371/journal.pmed.1001807. eCollection 2015 Mar. PLoS Med. 2015. PMID: 25803642 Free PMC article. Clinical Trial.
-
Characterization of a hospital-based gastroenteritis outbreak caused by GII.6 norovirus in Jinshan, China.Epidemiol Infect. 2020 Dec 9;148:e289. doi: 10.1017/S0950268820002538. Epidemiol Infect. 2020. PMID: 33292874 Free PMC article.
-
The Antigenic Topology of Norovirus as Defined by B and T Cell Epitope Mapping: Implications for Universal Vaccines and Therapeutics.Viruses. 2019 May 10;11(5):432. doi: 10.3390/v11050432. Viruses. 2019. PMID: 31083353 Free PMC article. Review.
Cited by
-
Serological surveillance of GI norovirus reveals persistence of blockade antibody in a Jidong community-based prospective cohort, 2014-2018.Front Cell Infect Microbiol. 2023 Dec 18;13:1258550. doi: 10.3389/fcimb.2023.1258550. eCollection 2023. Front Cell Infect Microbiol. 2023. PMID: 38188632 Free PMC article.
-
Development and evaluation of a new luciferase immunosorbent assay to detect GII.6 norovirus-specific IgG in different domestic and wild animals.Front Microbiol. 2023 Jul 20;14:1213007. doi: 10.3389/fmicb.2023.1213007. eCollection 2023. Front Microbiol. 2023. PMID: 37547694 Free PMC article.
-
Serological surveillance of noroviruses in a community-based prospective cohort: a study protocol.BMJ Open. 2021 Mar 4;11(3):e043228. doi: 10.1136/bmjopen-2020-043228. BMJ Open. 2021. PMID: 33664074 Free PMC article.
References
-
- Cannon J. L., Barclay L., Collins N. R., Wikswo M. E., Castro C. J., Magana L. C., et al. (2017). Genetic and epidemiologic trends of norovirus outbreaks in the United States from 2013 to 2016 demonstrated emergence of novel GII.4 recombinant viruses. J. Clin. Microbiol. 55 2208–2221. 10.1128/jcm.00455-17 - DOI - PMC - PubMed
LinkOut - more resources
Full Text Sources