Transcript assembly improves expression quantification of transposable elements in single-cell RNA-seq data
- PMID: 33355230
- PMCID: PMC7849386
- DOI: 10.1101/gr.265173.120
Transcript assembly improves expression quantification of transposable elements in single-cell RNA-seq data
Abstract
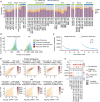
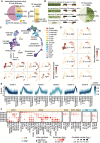
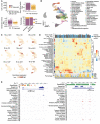
Transposable elements (TEs) are an integral part of the host transcriptome. TE-containing noncoding RNAs (ncRNAs) show considerable tissue specificity and play important roles during development, including stem cell maintenance and cell differentiation. Recent advances in single-cell RNA-seq (scRNA-seq) revolutionized cell type-specific gene expression analysis. However, effective scRNA-seq quantification tools tailored for TEs are lacking, limiting our ability to dissect TE expression dynamics at single-cell resolution. To address this issue, we established a TE expression quantification pipeline that is compatible with scRNA-seq data generated across multiple technology platforms. We constructed TE-containing ncRNA references using bulk RNA-seq data and showed that quantifying TE expression at the transcript level effectively reduces noise. As proof of principle, we applied this strategy to mouse embryonic stem cells and successfully captured the expression profile of endogenous retroviruses in single cells. We further expanded our analysis to scRNA-seq data from early stages of mouse embryogenesis. Our results illustrated the dynamic TE expression at preimplantation stages and revealed 146 TE-containing ncRNA transcripts with substantial tissue specificity during gastrulation and early organogenesis.
© 2021 Shao and Wang; Published by Cold Spring Harbor Laboratory Press.
Figures


Similar articles
-
Identifying transposable element expression dynamics and heterogeneity during development at the single-cell level with a processing pipeline scTE.Nat Commun. 2021 Mar 5;12(1):1456. doi: 10.1038/s41467-021-21808-x. Nat Commun. 2021. PMID: 33674594 Free PMC article.
-
RepExpress: A Novel Pipeline for the Quantification and Characterization of Transposable Element Expression from RNA-seq Data.Curr Protoc. 2021 Aug;1(8):e206. doi: 10.1002/cpz1.206. Curr Protoc. 2021. PMID: 34387946
-
SoloTE for improved analysis of transposable elements in single-cell RNA-Seq data using locus-specific expression.Commun Biol. 2022 Oct 6;5(1):1063. doi: 10.1038/s42003-022-04020-5. Commun Biol. 2022. PMID: 36202992 Free PMC article.
-
More than causing (epi)genomic instability: emerging physiological implications of transposable element modulation.J Biomed Sci. 2021 Aug 7;28(1):58. doi: 10.1186/s12929-021-00754-2. J Biomed Sci. 2021. PMID: 34364371 Free PMC article. Review.
-
The intertwining of transposable elements and non-coding RNAs.Int J Mol Sci. 2013 Jun 26;14(7):13307-28. doi: 10.3390/ijms140713307. Int J Mol Sci. 2013. PMID: 23803660 Free PMC article. Review.
Cited by
-
Cell-Specific Transposable Element and Gene Expression Analysis Across Systemic Lupus Erythematosus Phenotypes.ACR Open Rheumatol. 2024 Nov;6(11):769-779. doi: 10.1002/acr2.11713. Epub 2024 Aug 14. ACR Open Rheumatol. 2024. PMID: 39143499 Free PMC article.
-
Transposon control as a checkpoint for tissue regeneration.Development. 2022 Nov 15;149(22):dev191957. doi: 10.1242/dev.191957. Epub 2022 Nov 28. Development. 2022. PMID: 36440631 Free PMC article.
-
The landscape of hervRNAs transcribed from human endogenous retroviruses across human body sites.Genome Biol. 2022 Nov 3;23(1):231. doi: 10.1186/s13059-022-02804-w. Genome Biol. 2022. PMID: 36329469 Free PMC article.
-
Identification of SNPs Associated with Somatic Cell Score in Candidate Genes in Italian Holstein Friesian Bulls.Animals (Basel). 2021 Feb 1;11(2):366. doi: 10.3390/ani11020366. Animals (Basel). 2021. PMID: 33535694 Free PMC article.
-
LINE-1 retrotransposon expression in cancerous, epithelial and neuronal cells revealed by 5' single-cell RNA-Seq.Nucleic Acids Res. 2023 Mar 21;51(5):2033-2045. doi: 10.1093/nar/gkad049. Nucleic Acids Res. 2023. PMID: 36744437 Free PMC article.
References
-
- Attig J, Young GR, Hosie L, Perkins D, Encheva-Yokoya V, Stoye JP, Snijders AP, Ternette N, Kassiotis G. 2019. LTR retroelement expansion of the human cancer transcriptome and immunopeptidome revealed by de novo transcript assembly. Genome Res 29: 1578–1590. 10.1101/gr.248922.119 - DOI - PMC - PubMed
-
- Benadiba C, Magnani D, Niquille M, Morlé L, Valloton D, Nawabi H, Ait-Lounis A, Otsmane B, Reith W, Theil T, et al. 2012. The ciliogenic transcription factor RFX3 regulates early midline distribution of guidepost neurons required for corpus callosum development. PLoS Genet 8: e1002606 10.1371/journal.pgen.1002606 - DOI - PMC - PubMed
-
- Bendall ML, de Mulder M, Iñiguez LP, Lecanda-Sánchez A, Pérez-Losada M, Ostrowski MA, Jones RB, Mulder LCF, Reyes-Terán G, Crandall KA, et al. 2019. Telescope: characterization of the retrotranscriptome by accurate estimation of transposable element expression. PLoS Comput Biol 15: e1006453 10.1371/journal.pcbi.1006453 - DOI - PMC - PubMed
Publication types
MeSH terms
Substances
Grants and funding
LinkOut - more resources
Full Text Sources
Research Materials
