Magnetic resonance shear wave elastography using transient acoustic radiation force excitations and sinusoidal displacement encoding
- PMID: 33352538
- PMCID: PMC8217474
- DOI: 10.1088/1361-6560/abd5ce
Magnetic resonance shear wave elastography using transient acoustic radiation force excitations and sinusoidal displacement encoding
Abstract
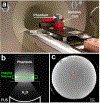
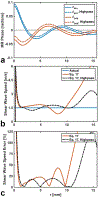
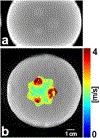
A magnetic resonance (MR) shear wave elastography technique that uses transient acoustic radiation force impulses from a focused ultrasound (FUS) transducer and a sinusoidal-shaped MR displacement encoding strategy is presented. Using this encoding strategy, an analytic expression for calculating the shear wave speed in a heterogeneous medium was derived. Green's function-based simulations were used to evaluate the feasibility of calculating shear wave speed maps using the analytic expression. Accuracy of simulation technique was confirmed experimentally in a homogeneous gelatin phantom. The elastography measurement was compared to harmonic MR elastography in a homogeneous phantom experiment and the measured shear wave speed values differed by less than 14%. This new transient elastography approach was able to map the position and shape of inclusions sized from 8.5 to 14 mm in an inclusion phantom experiment. These preliminary results demonstrate the feasibility of using a straightforward analytic expression to generate shear wave speed maps from MR images where sinusoidal-shaped motion encoding gradients are used to encode the displacement-time history of a transiently propagating wave-packet. This new measurement technique may be particularly well suited for performing elastography before, during, and after MR-guided FUS therapies since the same device used for therapy is also used as an excitation source for elastography.
Keywords: MRgFUS; acoustic radiation force; elastography; magnetic resonance elastography; shear wave elastography; transient MRE; viscoelastic simulations.
© 2021 Institute of Physics and Engineering in Medicine.
Figures


Similar articles
-
Efficient shear wave elastography using transient acoustic radiation force excitations and MR displacement encoding.Magn Reson Med. 2019 May;81(5):3153-3167. doi: 10.1002/mrm.27647. Epub 2019 Jan 21. Magn Reson Med. 2019. PMID: 30663806 Free PMC article.
-
A Scholte wave approach for ultrasonic surface acoustic wave elastography.Med Phys. 2023 Jul;50(7):4138-4150. doi: 10.1002/mp.16394. Epub 2023 Apr 5. Med Phys. 2023. PMID: 36971512 Free PMC article.
-
Monitoring MR-guided high intensity focused ultrasound therapy using transient supersonic shear wave MR-elastography.Phys Med Biol. 2023 Jan 24;68(3). doi: 10.1088/1361-6560/acac5e. Phys Med Biol. 2023. PMID: 36595333
-
Characterizing Musculoskeletal Tissue Mechanics Based on Shear Wave Propagation: A Systematic Review of Current Methods and Reported Measurements.Ann Biomed Eng. 2022 Jul;50(7):751-768. doi: 10.1007/s10439-022-02935-y. Epub 2022 Mar 31. Ann Biomed Eng. 2022. PMID: 35359250 Free PMC article. Review.
-
Ultrasonic surface acoustic wave elastography: A review of basic theories, technical developments, and medical applications.Med Phys. 2024 May;51(5):3220-3244. doi: 10.1002/mp.17063. Epub 2024 Apr 10. Med Phys. 2024. PMID: 38597908 Review.
Cited by
-
Simultaneous proton resonance frequency T1 - MR shear wave elastography for MR-guided focused ultrasound multiparametric treatment monitoring.Magn Reson Med. 2023 Jun;89(6):2171-2185. doi: 10.1002/mrm.29587. Epub 2023 Jan 19. Magn Reson Med. 2023. PMID: 36656135 Free PMC article.
-
Improving in situ acoustic intensity estimates using MR acoustic radiation force imaging in combination with multifrequency MR elastography.Magn Reson Med. 2022 Oct;88(4):1673-1689. doi: 10.1002/mrm.29309. Epub 2022 Jun 28. Magn Reson Med. 2022. PMID: 35762849 Free PMC article.
-
Wavelet MRE: Imaging propagating broadband acoustic waves with wavelet-based motion-encoding gradients.Magn Reson Med. 2024 May;91(5):1923-1935. doi: 10.1002/mrm.29972. Epub 2023 Dec 14. Magn Reson Med. 2024. PMID: 38098427
References
-
- Aki K and Richards PG 2002. Quantitative Seismology (Sausalito, CA: University Science Books; )
-
- Arnal B, Pernot M and Tanter M 2011. Monitoring of thermal therapy based on shear modulus changes: II. Shear wave imaging of thermal lesions IEEE Trans. Ultrason. Ferroelectr. Freq. Control 58 1603–11 - PubMed
-
- Bercoff J, Tanter M, Muller M and Fink M 2004. The role of viscosity in the impulse diffraction field of elastic waves induced by the acoustic radiation force IEEE Trans. Ultrason. Ferroelectr. Freq. Control 51 1523–36 - PubMed
-
- Bour P, Marquet F, Ozenne V, Toupin S, Dumont E, Aubry J-F, Lepetit-Coiffe M and Quesson B 2017. Real-time monitoring of tissue displacement and temperature changes during MR-guided high intensity focused ultrasound Magn. Reson. Med 78 1911–21 - PubMed
Publication types
MeSH terms
Grants and funding
LinkOut - more resources
Full Text Sources
Other Literature Sources
