. 2021 Mar;6(3):339-353.
doi: 10.1038/s41564-020-00846-z. Epub 2020 Dec 21.

The SARS-CoV-2 RNA-protein interactome in infected human cells

Affiliations

The SARS-CoV-2 RNA-protein interactome in infected human cells

Nora Schmidt et al. Nat Microbiol. 2021 Mar.

Abstract

Characterizing the interactions that SARS-CoV-2 viral RNAs make with host cell proteins during infection can improve our understanding of viral RNA functions and the host innate immune response. Using RNA antisense purification and mass spectrometry, we identified up to 104 human proteins that directly and specifically bind to SARS-CoV-2 RNAs in infected human cells. We integrated the SARS-CoV-2 RNA interactome with changes in proteome abundance induced by viral infection and linked interactome proteins to cellular pathways relevant to SARS-CoV-2 infections. We demonstrated by genetic perturbation that cellular nucleic acid-binding protein (CNBP) and La-related protein 1 (LARP1), two of the most strongly enriched viral RNA binders, restrict SARS-CoV-2 replication in infected cells and provide a global map of their direct RNA contact sites. Pharmacological inhibition of three other RNA interactome members, PPIA, ATP1A1, and the ARP2/3 complex, reduced viral replication in two human cell lines. The identification of host dependency factors and defence strategies as presented in this work will improve the design of targeted therapeutics against SARS-CoV-2.


Conflict of interest statement

The authors declare no competing interests.

Figures
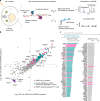
Fig. 1
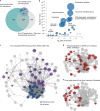
Fig. 1. RNA–protein interactome of SARS-CoV-2 in infected human cells.
a, Outline of the RAP–MS method to identify proteins bound to SARS-CoV-2 RNA and their crosslinked RNA sequences. b, Quantification of SARS-CoV-2 RNA-interacting proteins relative to RMRP-interacting proteins. The scatter plot of log2-transformed TMT ratios from two biological replicates is shown. The grey dots represent all proteins detected with two or more unique peptides. c, Proteins enriched in SARS-CoV-2 RNA purifications (Supplementary Table 1). Left: core SARS-CoV-2 RNA interactome (adjusted P < 0.05). Left and right: expanded SARS-CoV-2 RNA interactome. Significantly enriched proteins are highlighted in teal; SARS-CoV-2-encoded proteins are highlighted in magenta. Adjusted P value: two-tailed moderated t-test.
Fig. 2
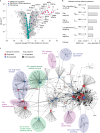
Fig. 2. Viral RNA contacts regulators of RNA metabolism and host response.
a, Intersection of the expanded SARS-CoV-2 RNA interactome with the poly(A)-RNA interactome and the Dengue/Zika virus interactome in Huh7 cells (Supplementary Table 2). b, GO enrichment analysis of SARS-CoV-2 RNA interactome proteins. Circle sizes scale to the number of detected proteins. SRP, signal recognition particle. Statistical test: Fisher’s exact test with Benjamini–Hochberg adjustment. c, Protein–protein association network of the expanded SARS-CoV-2 RNA interactome. Published virus-associated proteins are highlighted. Proteins without connections are not shown. d, As in c but proteins undergoing dynamic phosphorylation upon SARS-CoV-2 infection are highlighted. e, As in c but proteins that overlap known drug target genes (Drug Gene Interaction Database) are highlighted.
Fig. 3
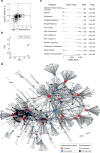
Fig. 3. Connecting the SARS-CoV-2 RNA interactome to perturbations in host cells.
a, Volcano plot of proteome abundance measurements in SARS-CoV-2-infected and uninfected Huh7 cells 24 h post-infection (n = 3) (Supplementary Table 5). Adjusted P value: two-tailed moderated t-test. SARS-CoV-2-encoded proteins are shown in magenta; human SARS-CoV-2 RNA interactome proteins are shown in teal; interferon response-related proteins are shown in purple. b, GSEA for the global proteome abundance measurements shown in a. Selected gene sets are shown; the full table displaying additional enriched gene sets is provided in Extended Data Fig. 3c. Statistical test: Kolmogorov–Smirnov test with Benjamini–Hochberg adjustment. NES, normalized enrichment score. c, Protein–protein association network of core SARS-CoV-2 RNA interactome proteins and their connections to differentially regulated proteins in SARS-CoV-2-infected cells based on curated interactions in STRING v.11 (ref. ). Upregulated proteins are shown in light grey; downregulated proteins are shown in dark grey. Circle sizes scale to the number of connections of each interactome protein. Selected GO enrichments for network communities are shown in the transparent circles (Methods). Full GO term analysis is provided in Supplementary Table 8.
Fig. 4
Fig. 4. CNBP contacts SARS-CoV-2 viral RNA.
a, SARS-CoV-2 RNA interactome proteins overlaid on genome-wide CRISPR perturbation data from SARS-CoV-2-infected Vero E6 cells. Members of the expanded RNA interactome with significant (adjusted P < 0.05, two-sided z-test with Benjamini–Hochberg correction) changes in CRISPR z-scores are highlighted in magenta. The y axis is capped at 1 × 10−19, excluding 4 genes. b, Western blot of Huh7 CNBP knockout and control cell lines (top). RT–qPCR measurements of intracellular SARS-CoV-2 RNA (RdRP gene) at 48 h post-infection in Huh7 CNBP knockout and control cells (bottom). Quantification relative to 18S rRNA and control cells is shown. Values are the mean ± s.d. (n = 3 independent infections). P values were determined using an unpaired two-tailed t-test. ****P < 0.0001. c, Distribution of CNBP eCLIP peaks to different RNA types and transcript regions. d, Meta-gene analysis of CNBP eCLIP signal across mature mRNAs. e, CNBP eCLIP data aligned to the SARS-CoV-2 RNA genome. The fold change relative to the size-matched input is shown. MACS2-enriched peaks are shown below the fold change track. Source data
Fig. 5
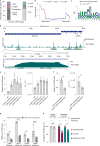
Fig. 5. LARP1 binds SARS-CoV-2 RNAs and restricts viral replication.
a, Distribution of LARP1 eCLIP peaks to different RNA types and transcript regions. b, Meta-gene analysis of LARP1 eCLIP signal across mature mRNAs. c, Oligopyrimidine-rich sequence motif discovered de novo in LARP1 peaks mapping to 5′-UTRs (Methods). d, LARP1 eCLIP data aligned to the SARS-CoV-2 RNA genome. The fold change relative to the size-matched input is shown. MACS2-enriched peaks are shown above the fold change track. Oligopyrimidine-rich sequences that coincide with strongly enriched LARP1 peaks are highlighted. A zoom-in to the SARS-CoV-2 5′-leader sequence is shown below the genomic alignment. e, Left: RT–qPCR measurements of intracellular SARS-CoV-2 RNA at 24 h post-infection in WT HEK293 cells or 4 different LARP1 knockout cell lines. Quantification relative to 18S rRNA and WT cells is shown. Right: Infectious viral titres in the supernatants of infected cells quantified by plaque assays at 24 h post-infection. P values were determined using an unpaired two-tailed t-test. f, Left: RT–qPCR measurements of intracellular SARS-CoV-2 RNA at 24 h post-infection in HEK293 cells transiently overexpressing GFP or LARP1–GFP proteins. Quantification relative to 18S rRNA and GFP-overexpressing cells is shown. Right: Infectious viral titres in the supernatants of infected cells quantified by plaque assays at 24 h post-infection. P values were determined using an unpaired one-tailed t-test. g, RT–qPCR measurements of intracellular SARS-CoV-2 RNA at 24 h post-infection in LARP1 knockout cells complemented with either GFP or LARP1–GFP plasmids. Quantification relative to 18S rRNA and GFP-transfected WT cells is shown. P values were determined using an unpaired two-tailed t-test. eg, All values are the mean ± s.d. (n = 3 independent infections) h, Quantification of ribosomal frameshifting efficiency using a dual-fluorescence translation reporter (Extended Data Fig. 4d) in HEK293 cells is shown. Data were normalized to cells transfected with eCFP (n = 6 independent transfections, except for control RNA n = 4). Values are the mean ± s.d. ****P < 0.0001, ***P < 0.001, **P < 0.01, *P < 0.05; NS, not significant; FSE, frameshift element.
Fig. 6
Fig. 6. RNA interactome inhibitors reduce virus replication.
a, Top: RT–qPCR measurements of intracellular SARS-CoV-2 RNA at 24 h post-infection in Calu3 cells after inhibitor treatment. Inhibitors were used at the indicated concentrations (left to right). Values were normalized to 18S rRNA measurements and compared to DMSO-treated cells. Bottom: Infectious viral titres in the supernatants of infected Calu3 cells quantified by plaque assays at 24 h post-infection. b, As in a but for Huh7 cells and at 48 h post-infection. All values are the mean ± s.d. (n = 3 independent infections). P values were determined using an unpaired two-tailed t-test. ***P < 0.001, **P < 0.01, *P < 0.05.
Extended Data Fig. 1
Extended Data Fig. 1. Capturing SARS-CoV-2 RNAs and bound proteins with RAP-MS.
a, Alignment of protein-crosslinked RNA fragments to the SARS-CoV-2 genome following RNA antisense purification of SARS-CoV-2 RNAs from infected Huh7 cells. Two replicate experiments are shown. b, Fraction of crosslinked RNA fragments mapping to the human or SARS-CoV-2 genomes in pilot RAP-MS experiments. c, Correlation plot for two replicate RAP experiments. CPM values for SARS-CoV-2 genes are shown. CPM: counts per million. d, As in b, but for full-scale SARS-CoV-2 RNA RAP-MS and RMRP RAP-MS experiments. e, Western blot of two replicate SARS-CoV-2 RNA and RMRP RAP-MS experiments. Indicated antibodies were used for protein detection. Source data
Extended Data Fig. 2
Extended Data Fig. 2. Connectivity in RAP-MS protein-protein association network.
Total number of connections observed in protein-protein association network constructed based on expanded SARS-CoV-2 RNA interactome (red bar, 1,534 connections), compared to number of connections observed in random networks of equal size (grey bars, mean 60 connections, z-score 76) using random sampling of proteins detected in proteome measurements.
Extended Data Fig. 3
Extended Data Fig. 3. Proteome abundance changes in SARS-CoV-2 infected cells.
a, Correlation of protein abundance measurements reported in Klann et al. and this study (r = 0.411). Proteins displayed are significant at an adjusted P value threshold of 0.01 in both studies (n = 712). b, Principle component analysis for proteome measurements of SARS-CoV-2 (SCoV2) infected or mock infected Huh7 cells. c, GSEA for proteins significantly regulated in global proteome measurements. Gene sets enriched in addition to those shown in Figure 3b are presented. Statistical test: Kolmogorov-Smirnov test with Benjamini-Hochberg adjustment. d, Protein-protein association network of expanded SARS-CoV-2 RNA interactome proteins (blue: interactome protein, not regulated; red: interactome protein, regulated) and their connections to differentially regulated proteins upon SARS-CoV-2 infection. Upregulated proteins are shown in light grey; downregulated proteins are shown in dark grey. Circle sizes scale to the number of connections of each interactome protein.
Extended Data Fig. 4
Extended Data Fig. 4. Functional validation of SARS-CoV-2 RNA binders.
a, Western blot of WT HEK293 cells and four different HEK293 LARP1 knockout (KO) cell lines generated with CRISPR-Cas9 (see Methods). Expression of LARP1 was evaluated relative to Tubulin. b, Western blot of HEK293 cells transiently overexpressing (OE) GFP or LARP1-GFP proteins at 48 h post transfection. Arrows indicate endogenous LARP1 proteins and GFP-tagged LARP1. c, Western blot of four different HEK293 LARP1 knockout cell lines transiently transfected with plasmids encoding GFP or LARP1-GFP proteins at 48 h post transfection. Experiments were repeated at least two times. d, Schematic of dual-fluorescence translation reporter to quantify ribosomal frameshifting efficiency. The depicted control construct contains enhanced GFP (eGFP) and mCherry in an in-frame orientation, leading to the production of both fluorescent proteins separated by a self-cleaving 2A peptide when the 0 reading frame is translated. In the frameshift construct depicted below, eGFP and mCherry are separated by an in-frame stop codon, preventing the production of mCherry when the 0 reading frame is translated. −1FS leads to the production of eGFP and mCherry and the ratio between both fluorescent proteins is a direct measure of frameshifting efficacy. −1FS: –1 ribosomal frameshifting. Source data
Extended Data Fig. 5
Extended Data Fig. 5. Pharmacological inhibition of SARS-CoV-2 RNA interactome proteins.
a, RT-qPCR measurements of intracellular SARS-CoV-2 RNA (RdRP gene) in infected Calu3, Huh7 and A549-ACE2 cells after inhibitor treatment. Inhibitors were used at indicated concentration (left to right). Calu3 cells were assayed 24 h post-infection, Huh7 and A549-ACE2 cells were assayed 48 h post-infection. Values are normalized to 18S rRNA measurements and compared to untreated or DMSO treated cells. b, Infectious viral titers in the supernatants of infected Calu3, Huh7 and A549-ACE2 cells after inhibitor treatment. Inhibitors were used at indicated concentration (left to right). Calu3 cells were assayed 24 h post-infection, Huh7 and A549-ACE2 cells were assayed 48 h post-infection. All values in a-b are mean ± s.d. (n = 3 independent infections) c-d, Cell viability assay in inhibitor-treated and untreated cells. Values are the mean ± s.d. (n = 3 independent treatments). P values determined in unpaired two-tailed t-test. ***P < 0.001; **P < 0.01; *P < 0.05; ns, not significant.

Similar articles

Cited by

References

    1. Guan W-J, et al. Clinical characteristics of coronavirus disease 2019 in China. N. Engl. J. Med. 2020;382:1708–1720. - PMC - PubMed
    1. Tay MZ, Poh CM, Rénia L, MacAry PA, Ng LFP. The trinity of COVID-19: immunity, inflammation and intervention. Nat. Rev. Immunol. 2020;20:363–374. - PMC - PubMed
    1. Sola I, Almazán F, Zúñiga S, Enjuanes L. Continuous and discontinuous RNA synthesis in coronaviruses. Ann. Rev. Virol. 2015;2:265–288. - PMC - PubMed
    1. Chan YK, Gack MU. Viral evasion of intracellular DNA and RNA sensing. Nat. Rev. Microbiol. 2016;14:360–373. - PMC - PubMed
    1. Blanco-Melo D, et al. Imbalanced host response to SARS-CoV-2 drives development of COVID-19. Cell. 2020;181:1036–1045. - PMC - PubMed

Publication types