

Cell Sheet Comprised of Mesenchymal Stromal Cells Overexpressing Stem Cell Factor Promotes Epicardium Activation and Heart Function Improvement in a Rat Model of Myocardium Infarction
- PMID: 33339427
- PMCID: PMC7766731
- DOI: 10.3390/ijms21249603
Cell Sheet Comprised of Mesenchymal Stromal Cells Overexpressing Stem Cell Factor Promotes Epicardium Activation and Heart Function Improvement in a Rat Model of Myocardium Infarction
Abstract
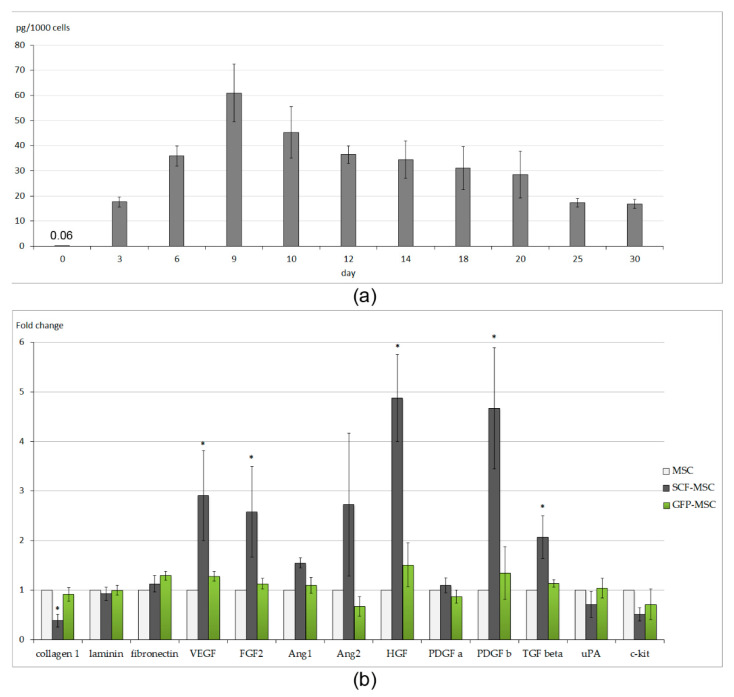
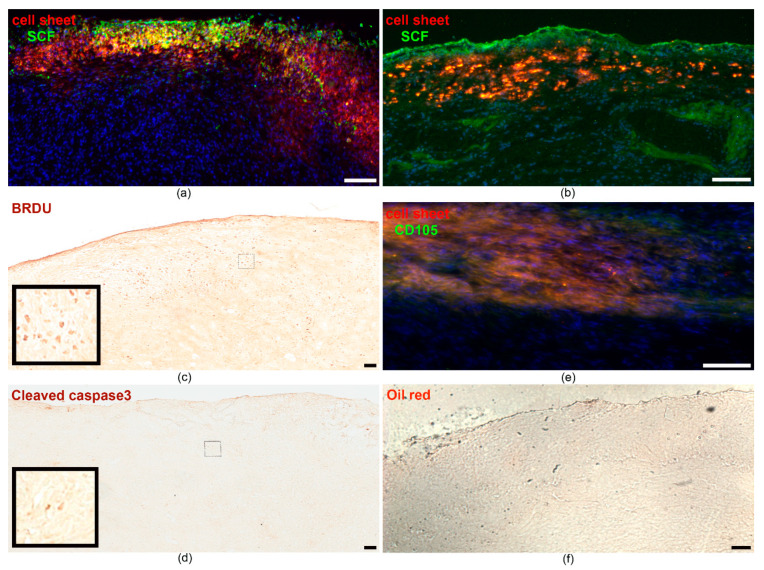
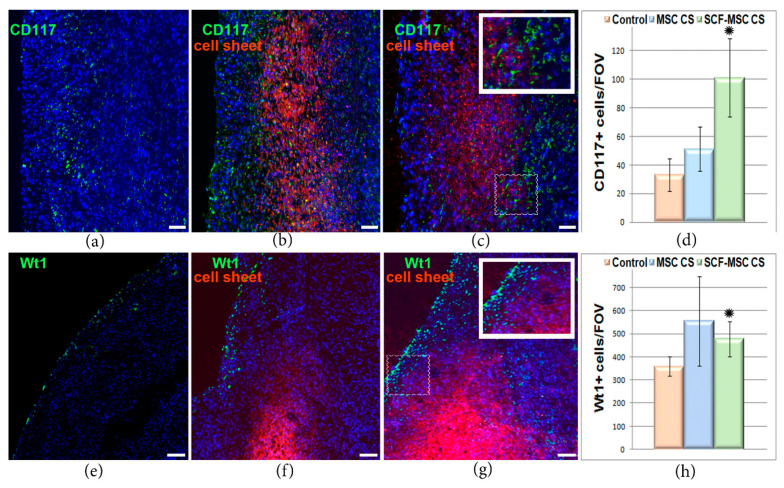
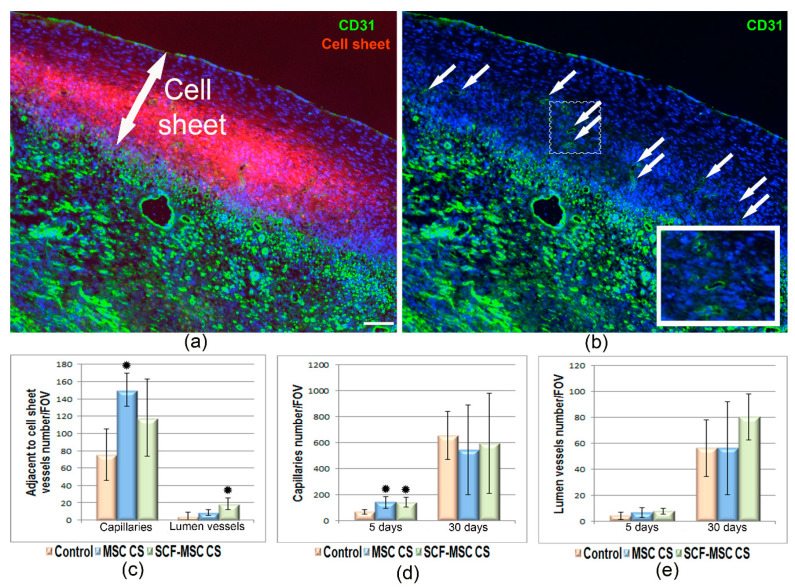
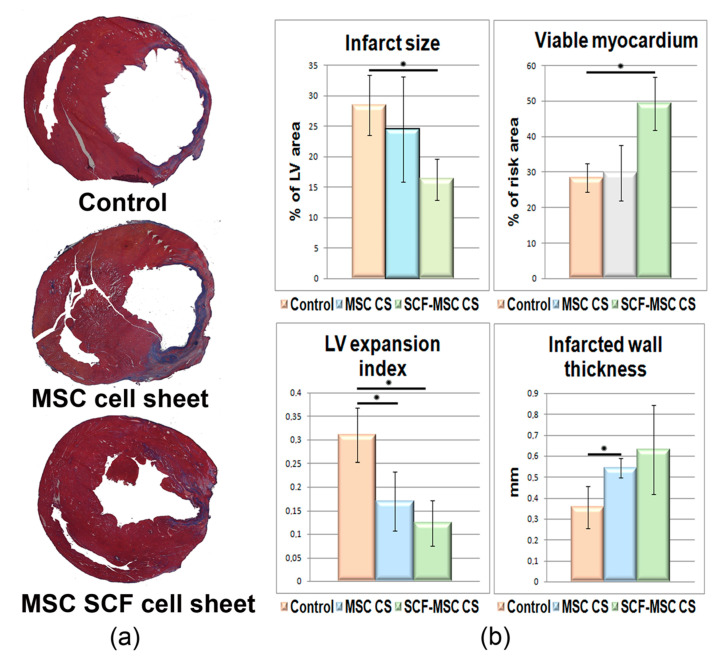
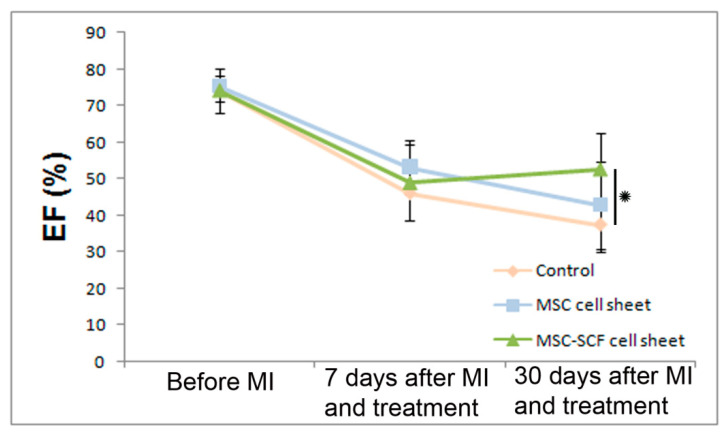
Cell therapy of the post-infarcted myocardium is still far from clinical use. Poor survival of transplanted cells, insufficient regeneration, and replacement of the damaged tissue limit the potential of currently available cell-based techniques. In this study, we generated a multilayered construct from adipose-derived mesenchymal stromal cells (MSCs) modified to secrete stem cell factor, SCF. In a rat model of myocardium infarction, we show that transplantation of SCF producing cell sheet induced activation of the epicardium and promoted the accumulation of c-kit positive cells in ischemic muscle. Morphometry showed the reduction of infarct size (16%) and a left ventricle expansion index (0.12) in the treatment group compared to controls (24-28%; 0.17-0.32). The ratio of viable myocardium was more than 1.5-fold higher, reaching 49% compared to the control (28%) or unmodified cell sheet group (30%). Finally, by day 30 after myocardium infarction, SCF-producing cell sheet transplantation increased left ventricle ejection fraction from 37% in the control sham-operated group to 53%. Our results suggest that, combining the genetic modification of MSCs and their assembly into a multilayered construct, we can provide prolonged pleiotropic effects to the damaged heart, induce endogenous regenerative processes, and improve cardiac function.
Keywords: adipose derived mesenchymal stromal cells; cell sheet; heart function; myocardial infarction; stem cell factor.
Conflict of interest statement
The authors declare no conflict of interest.
Figures
Similar articles
-
Preparation of high bioactivity multilayered bone-marrow mesenchymal stem cell sheets for myocardial infarction using a 3D-dynamic system.Acta Biomater. 2018 May;72:182-195. doi: 10.1016/j.actbio.2018.03.052. Epub 2018 Apr 6. Acta Biomater. 2018. PMID: 29627677
-
Chitosan/silk fibroin modified nanofibrous patches with mesenchymal stem cells prevent heart remodeling post-myocardial infarction in rats.Acta Biomater. 2018 Oct 15;80:154-168. doi: 10.1016/j.actbio.2018.09.013. Epub 2018 Sep 13. Acta Biomater. 2018. PMID: 30218777
-
Mesenchymal stem cell-loaded cardiac patch promotes epicardial activation and repair of the infarcted myocardium.J Cell Mol Med. 2017 Sep;21(9):1751-1766. doi: 10.1111/jcmm.13097. Epub 2017 Feb 28. J Cell Mol Med. 2017. PMID: 28244640 Free PMC article.
-
Genetically modified mesenchymal stromal cells: a cell-based therapy offering more efficient repair after myocardial infarction.Stem Cell Res Ther. 2024 Sep 27;15(1):323. doi: 10.1186/s13287-024-03942-7. Stem Cell Res Ther. 2024. PMID: 39334266 Free PMC article. Review.
-
Therapeutic application of adipose derived stem cells in acute myocardial infarction: lessons from animal models.Stem Cell Rev Rep. 2014 Jun;10(3):389-98. doi: 10.1007/s12015-014-9502-7. Stem Cell Rev Rep. 2014. PMID: 24577790 Review.
Cited by
-
Advanced Cardiac Patches for the Treatment of Myocardial Infarction.Circulation. 2024 Jun 18;149(25):2002-2020. doi: 10.1161/CIRCULATIONAHA.123.067097. Epub 2024 Jun 17. Circulation. 2024. PMID: 38885303 Free PMC article. Review.
-
Scaffold-free 3D culture systems for stem cell-based tissue regeneration.APL Bioeng. 2024 Oct 1;8(4):041501. doi: 10.1063/5.0225807. eCollection 2024 Dec. APL Bioeng. 2024. PMID: 39364211 Free PMC article. Review.
-
Analysis of MicroRNA Profile Alterations in Extracellular Vesicles From Mesenchymal Stromal Cells Overexpressing Stem Cell Factor.Front Cell Dev Biol. 2021 Nov 15;9:754025. doi: 10.3389/fcell.2021.754025. eCollection 2021. Front Cell Dev Biol. 2021. PMID: 34869342 Free PMC article.
-
Possible Treatment of Myocardial Infarct Based on Tissue Engineering Using a Cellularized Solid Collagen Scaffold Functionalized with Arg-Glyc-Asp (RGD) Peptide.Int J Mol Sci. 2021 Nov 22;22(22):12563. doi: 10.3390/ijms222212563. Int J Mol Sci. 2021. PMID: 34830447 Free PMC article. Review.
-
Extracellular vesicles in cardiac repair and regeneration: Beyond stem-cell-based approaches.Front Cell Dev Biol. 2022 Sep 2;10:996887. doi: 10.3389/fcell.2022.996887. eCollection 2022. Front Cell Dev Biol. 2022. PMID: 36120584 Free PMC article. Review.
References
-
- Lalu M.M., Mazzarello S., Zlepnig J., Dong Y.Y., Montroy J., McIntyre L., Devereaux P.J., Stewart D.J., Mazer C.D., Barron C.C., et al. Safety and Efficacy of Adult Stem Cell Therapy for Acute Myocardial Infarction and Ischemic Heart Failure (SafeCell Heart): A Systematic Review and Meta-Analysis. Stem Cells Transl. Med. 2018;7:857–866. doi: 10.1002/sctm.18-0120. - DOI - PMC - PubMed
MeSH terms
Substances
Grants and funding
LinkOut - more resources
Full Text Sources
Medical
