. 2021 Jan;20(1):e13289.
doi: 10.1111/acel.13289. Epub 2020 Dec 18.

Photobiomodulation suppresses JNK3 by activation of ERK/MKP7 to attenuate AMPA receptor endocytosis in Alzheimer's disease

Affiliations

Photobiomodulation suppresses JNK3 by activation of ERK/MKP7 to attenuate AMPA receptor endocytosis in Alzheimer's disease

Qi Shen et al. Aging Cell. 2021 Jan.

Abstract

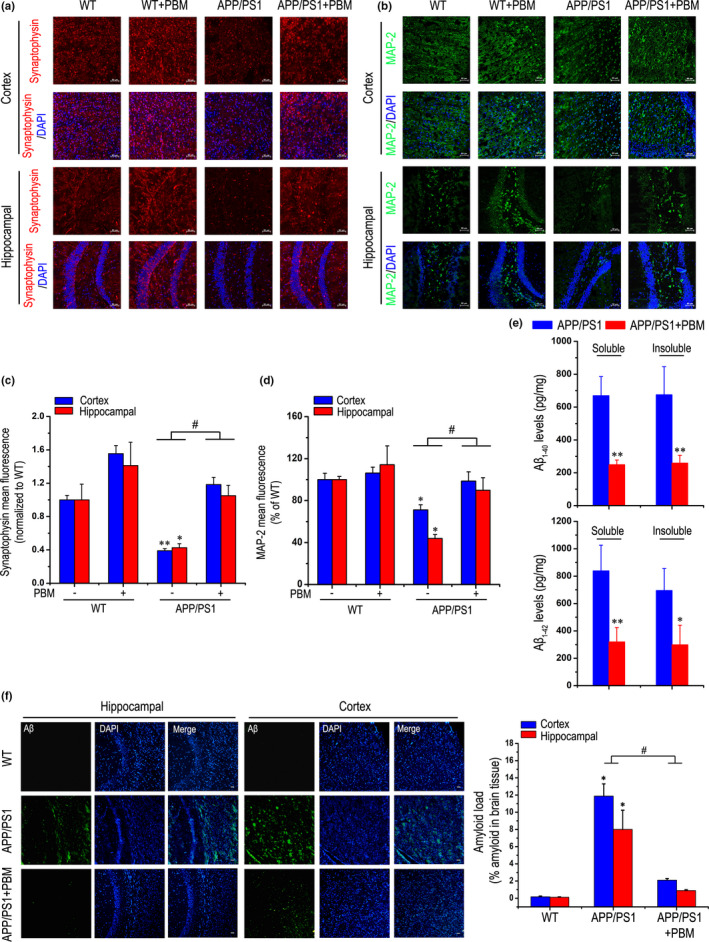
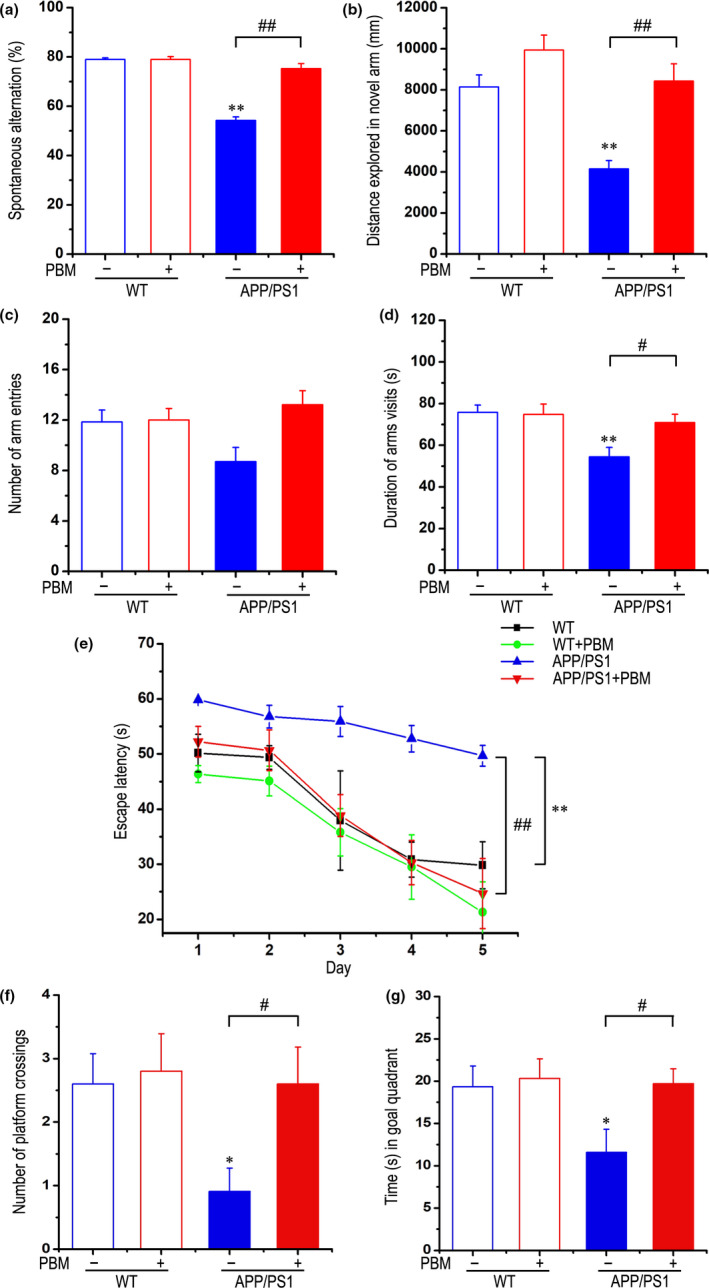
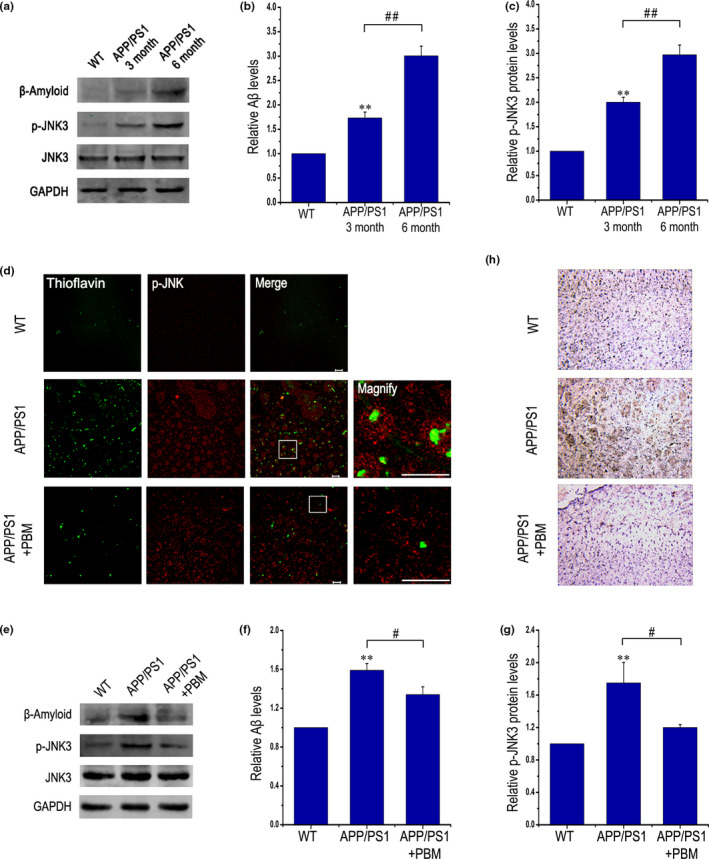
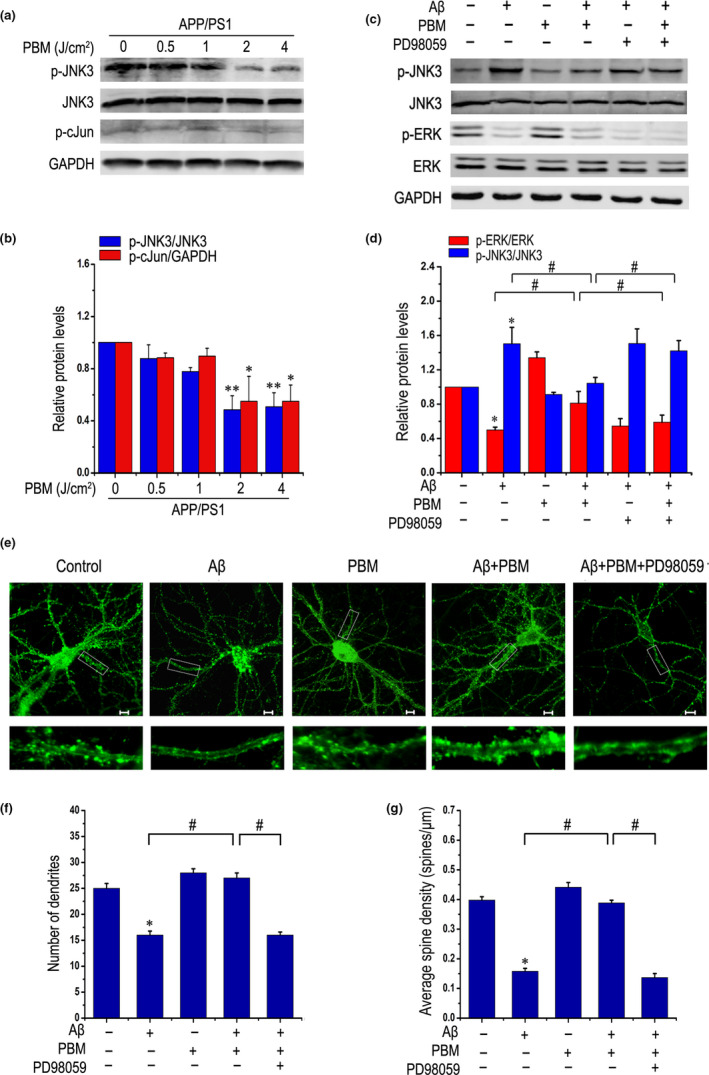
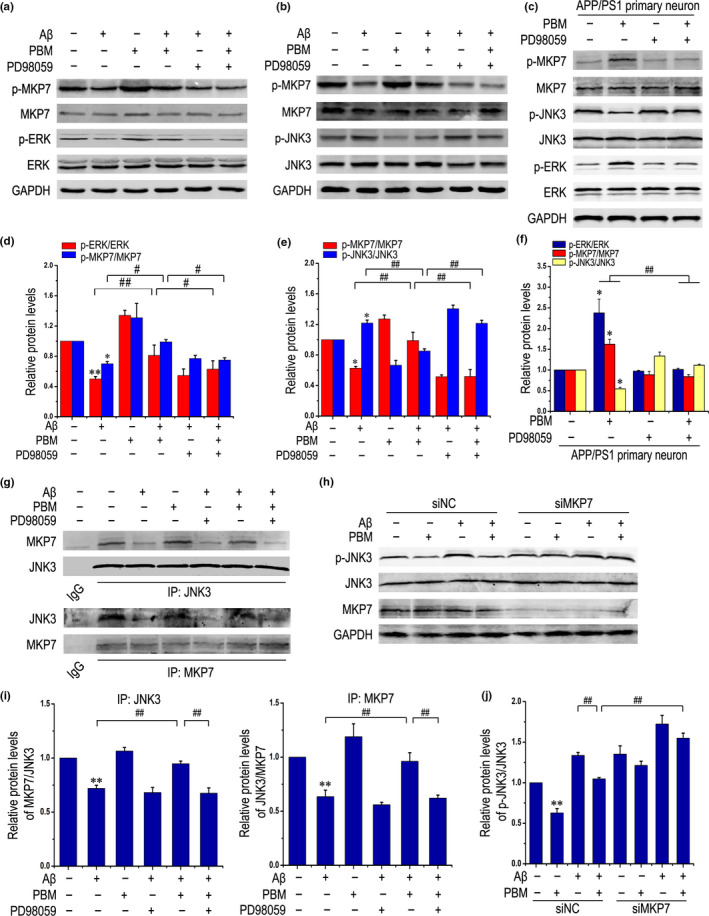
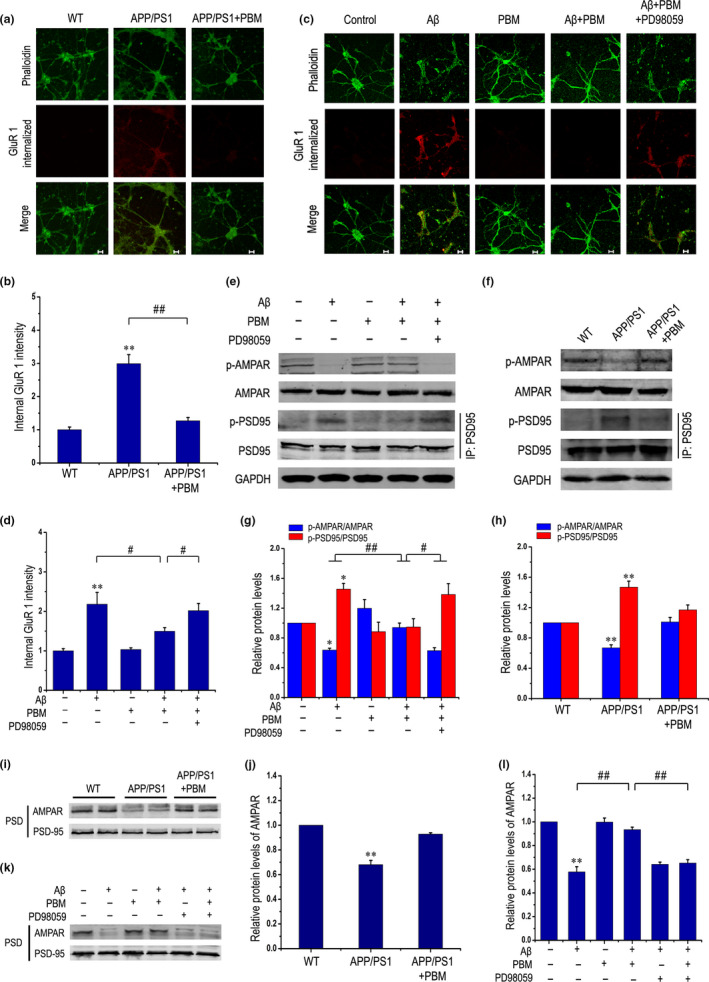
Alzheimer's disease (AD), a severe age-related neurodegenerative disorder, lacks effective therapeutic methods at present. Physical approaches such as gamma frequency light flicker that can effectively reduce amyloid load have been reported recently. Our previous research showed that a physical method named photobiomodulation (PBM) therapy rescues Aβ-induced dendritic atrophy in vitro. However, it remains to be further investigated the mechanism by which PBM affects AD-related multiple pathological features to improve learning and memory deficits. Here, we found that PBM attenuated Aβ-induced synaptic dysfunction and neuronal death through MKP7-dependent suppression of JNK3, a brain-specific JNK isoform related to neurodegeneration. The results showed PBM-attenuated amyloid load, AMPA receptor endocytosis, dendrite injury, and inflammatory responses, thereby rescuing memory deficits in APP/PS1 mice. We noted JNK3 phosphorylation was dramatically decreased after PBM treatment in vivo and in vitro. Mechanistically, PBM activated ERK, which subsequently phosphorylated and stabilized MKP7, resulting in JNK3 inactivation. Furthermore, activation of ERK/MKP7 signaling by PBM increased the level of AMPA receptor subunit GluR 1 phosphorylation and attenuated AMPA receptor endocytosis in an AD pathological model. Collectively, these data demonstrated that PBM has potential therapeutic value in reducing multiple pathological features associated with AD, which is achieved by regulating JNK3, thus providing a noninvasive, and drug-free therapeutic strategy to impede AD progression.

Keywords: AMPA receptor endocytosis; Alzheimer's disease; JNK3; Photobiomodulation therapy; synaptic dysfunction.


Conflict of interest statement

The authors declare that they have no conflict of interest.

Figures

Figure 1
Figure 1
Effects of PBM on neuronal damage in cortex and hippocampus of APP/PS1 transgenic mice. (a) Representative images of synaptophysin (red) in hippocampal and cortex regions of each group; and DAPI labeling of cell nuclei (blue). Scale bar represents 50 μm. (b) Typical staining of MAP‐2 (green) in cortex and hippocampal regions from APP/PS1 or WT groups with or without PBM. Nuclei were counterstained with DAPI (blue). Scale bar: 50 μm. (c) Quantitative analyses of the synaptophysin mean fluorescence in the hippocampal and cortex regions of different group, respectively. The synaptophysin mean fluorescence was analyzed by ImageJ (n = 6 for each group, at least three individual experiments, mean ±SEM, two‐way ANOVA, *p < 0.05 vs. WT group; **p < 0.01 vs. WT group; #p < 0.05 vs. indicated group). (d) Quantification of MAP‐2 density in hippocampal and cortex regions of different groups. MAP‐2 mean fluorescence was analyzed by ImageJ software (n = 6 for each group, at least three individual experiments, mean ±SEM, two‐way ANOVA, *p < 0.05 vs. WT group; #p < 0.05 vs. indicated group). (e) Soluble and insoluble Aβ1‐40/Aβ1‐42 levels in APP/PS1 group with or without PBM. The Aβ measurements were performed by ELISA (n = 4 for each group, at least three individual experiments, mean ± SEM, Student's t test, *p < 0.05 vs. control transgenic group; **p < 0.01 vs. control transgenic group). (f) Histochemical and quantitative analyses of Aβ levels in the cortex and hippocampal regions of each group (n = 4–5 for each group, at least three individual experiments, mean ± SEM, two‐way ANOVA, *p < 0.05 vs. WT group; #p < 0.05 vs. indicated group). Nuclei were counterstained with DAPI (blue). Scale bar, 50 μm. See Figure S1 for effects of PBM on Aβ load and neuroinflammation in APP/PS1 mice
Figure 2
Figure 2
Effects of PBM on memory impairment of APP/PS1 transgenic mice. Y‐maze task: (a) Spontaneous alternation behavior was measured in APP/PS1 or WT groups with or without PBM. (b–d) The distance explored (b), duration time (d) in novel arm, and number of arm entries (c) of each group were measured. Morris water maze task: (e) The escape latency of mice to find the hidden platform was recorded on each training trial day. (f) Number of platform crossings during a 60 s probe trial of MWM test. (g) Time spent swimming in the goal quadrant during the probe trial. All data are presented as mean ± SEM from 12–14 mice in each group. *p < 0.05 vs. WT group, **p < 0.01 vs. WT group, #p < 0.05 vs. indicated group, ##p < 0.01 vs. indicated group by two‐way ANOVA. See Figure S2 for effects of PBM on the average speed in the Y‐maze task and the Morris water maze
Figure 3
Figure 3
PBM inhibits JNK3 phosphorylation in APP/PS1 transgenic mice. (a–c) Western blot analysis of cortex lysates from WT mice and APP/PS1 transgenic mice at three and 6 months of age (n = 3 for each group, at least three individual experiments, mean ± SEM, one‐way ANOVA, **p < 0.01 vs. age‐matched WT group, ##p < 0.01 vs. indicated group). (d) Representative immunofluorescent images of p‐JNK in the cortex. Also shown are images of thioflavin T staining from the frontal cortex. Scale bar, 20 μm. (e–g) Aβ and p‐JNK expression were detected by Western blot in cortex lysates from APP/PS1 transgenic mice with or without PBM (6 J/cm2) and age‐matched WT mice (n = 5, at least three individual experiments, mean ± SEM, two‐way ANOVA, *p < 0.05 vs. control group, **p < 0.01 vs. control group, #p < 0.05 vs. indicated group, ##p < 0.01 vs. indicated group). (h) Immunohistochemical test performed to detect p‐JNK in sections of brain from APP/PS1 transgenic mice with or without PBM (6 J/cm2) and age‐matched WT mice; original magnification of 20 times. See Figure S3 for inhibition of PBM on JNK3 phosphorylation and APP Thr668 phosphorylation in an AD transgenic mouse model. And also please refer to Figure S4 to view that the potential disease‐modifying therapeutic mechanism of PBM on memory impairment and Aβ load, which is likely achieved by regulate JNK3, in APP/PS1 mice
Figure 4
Figure 4
Activated ERK induced by PBM inactivates JNK3 under treatment with Aβ. (a, b) Representative Western blot assay for detecting dose response of PBM (0.5, 1, 2, 4 J/cm2) on p‐JNK3, JNK3, and p‐c‐Jun levels in primary neurons derived from APP/PS1 mice (at least three individual experiments, mean ± SEM, one‐way ANOVA, *p < 0.05 vs. control group; **p < 0.01 vs. control group). (c, d) Representative Western blot assay of p‐ERK, ERK, p‐JNK3, and JNK3 stimulated with Aβ1‐42 and/or PBM in the presence of PD98059 (1 μM) in primary neurons (at least three individual experiments, mean ± SEM, one‐way ANOVA, *p < 0.05 vs. control group; #p < 0.05 vs. indicated group). (e) Representative photomicrographs of FITC‐phalloidin labeling in primary neurons on 14 DIV under treatment with Aβ1‐42 and/or PBM in the presence of PD98059. Scale bar: 10 μm. (f) Quantification of the number of dendrites per neuron under indicated treatments. For each group, >20 neurons were measured. (g) Quantification of spine density under indicated treatments. For each group, we measured >20 dendrites. All data are presented as means ± SEM for at least three individual experiments. *p < 0.05 vs. control group, #p < 0.05 vs. indicated group by one‐way ANOVA procedure. Please refer to Figure S5 to view that PBM inhibits phosphorylated form of JNK3 in Aβ‐treated primary neurons through ERK‐mediated signaling pathway. And also refer to Figure S7 to view the effect of PBM on dendritic spine density of APP/PS1 mice by Golgi‐Cox staining
Figure 5
Figure 5
ERK activated by PBM promotes MKP7 phosphorylation, and MKP7 interacts with and inactivates JNK3. (a, d) Primary neurons were treated with Aβ1‐42 and/or PBM, or pretreated with PD98059. Representative Western blots for detecting the levels of p‐MKP7, total‐MKP7, p‐ERK, and ERK are shown. All data are presented as means ± SEM for at least three individual experiments. *p < 0.05 vs. control group, **p < 0.01 vs. control group, #p < 0.05 vs. indicated group, ##p < 0.01 vs. indicated group by one‐way ANOVA. (b, e) Representative Western blot analysis was performed to detect p‐MKP7, MKP7, p‐JNK3, JNK3 stimulated with Aβ1‐42 and/or PBM in the presence of PD98059 in primary neurons (at least three individual experiments, mean ±SEM, one‐way ANOVA, *p < 0.05 vs. control group, ##p < 0.01 vs. indicated group). (c, f) p‐MKP7, MKP7, p‐JNK3, JNK3, p‐ERK, and ERK protein levels were detected by Western blots in primary neurons derived from APP/PS1 mice on 14 DIV under the indicated treatments (at least three individual experiments, mean ± SEM, one‐way ANOVA, *p < 0.05 vs. APP/PS1 group, ##p < 0.01 vs. indicated group). (g, i) Representative Western blots showing co‐immunoprecipitation of JNK3 with MKP7 from primary neurons stimulated with Aβ1‐42 and/or PBM in the presence of PD98059 (at least three individual experiments, mean ± SEM, one‐way ANOVA, **p < 0.01 vs. control group, ##p < 0.01 vs. indicated group). (h, j) Representative Western blot analysis of p‐JNK3, JNK3, and MKP7 under the indicated treatments (at least three individual experiments, mean ± SEM, two‐way ANOVA, **p < 0.01 vs. control group, ##p < 0.01 vs. indicated group). See Figure S9 for siRNAs used in this study
Figure 6
Figure 6
PBM inhibits phosphorylation of PSD‐95 and AMPA receptor endocytosis, thereby alleviating synaptic dysfunction. (a, b) Representative images (a) and quantitation (b) of total endocytosis of AMPARs (GluR1 internalized) in primary neurons derived from APP/PS1 mice under treatment with or without PBM (five individual experiments, mean ± SEM, two‐way ANOVA, **p < 0.01 vs. control group, ##p < 0.01 vs. indicated group). Scale bar: 20 μm. (c) Representative images of total endocytosis of AMPARs (GluR1 internalized) in response to different treatments. Scale bar: 20 μm. (d) Quantitation of total endocytosis of AMPARs stimulated with various treatments in primary neurons (at least three individual experiments, mean ± SEM, one‐way ANOVA, **p < 0.01 vs. control group, #p < 0.05 vs. indicated group). (e, g) Representative Western blot analysis was performed to detect p‐AMPAR, and AMPAR stimulated with Aβ1‐42 and/or PBM in the presence of PD98059 in primary neurons. Immunoprecipitates were analyzed for detecting p‐PSD95, and PSD95 stimulated with various treatments in primary neurons (at least three individual experiments, mean ± SEM, one‐way ANOVA, *p < 0.05 vs. control group, #p < 0.05 vs. indicated group, ##p < 0.01 vs. indicated group). (f, h) Representative Western blot assay of p‐AMPAR, and AMPAR, and immunoprecipitation of p‐PSD95 and PSD95 in neurons derived from APP/PS1 mice under treatment with or without PBM (at least three individual experiments, mean ± SEM, two‐way ANOVA, **p < 0.01 vs. control group). (i, j) Representative immunoblots of PSD proteins from APP/PS1 mice treated with or without PBM (at least three individual experiments, mean ± SEM, two‐way ANOVA, **p < 0.01 vs. control group). (k) Representative Western blots of PSD proteins from cultured neurons in response to different treatments. (l) Quantification of (k). Data are presented as means ± SEM for at least three individual experiments. **p < 0.01 vs. control group; ##p < 0.01 vs. indicated group. Please refer to Figure S10 to see that inhibition of JNK3 can alleviate AMPA receptor endocytosis

Similar articles

Cited by

References

    1. Anders, J. J. , Lanzafame, R. J. , & Arany, P. R. (2015). Low‐level light/laser therapy versus photobiomodulation therapy. Photomed Laser Surg., 33, 183–184. - PMC - PubMed
    1. Antoniou, X. , Falconi, M. , Marino, D. D. , & Borsello, T. (2011). JNK3 as a therapeutic target for neurodegenerative diseases. Journal of Alzheimers Disease, 24, 633–642. - PubMed
    1. Arany, P. R. , Cho, A. , Hunt, T. D. , Sidhu, G. , Shin, K. , Hahm, E. , Huang, G. X. , Weaver, J. , Chen, A.‐ C.‐H. , Padwa, B. L. , Hamblin, M. R. , Barcellos‐Hoff, M. H. , Kulkarni, A. B. , & Mooney, D. (2014). Photoactivation of Endogenous Latent Transforming Growth Factor‐β1 Directs Dental Stem Cell Differentiation for Regeneration. Science Translational Medicine, 6, 238ra269. - PMC - PubMed
    1. Bhattacharyya, S. , Biou, V. , Xu, W. , Schlüter, O. , & Malenka, R. C. (2009). A critical role for PSD‐95/AKAP interactions in endocytosis of synaptic AMPA receptors. Nature Neuroscience, 12, 172–181. - PMC - PubMed
    1. Birnbaum, J. H. , Bali, J. , Rajendran, L. , Nitsch, R. M. , & Tackenberg, C. (2015). Calcium flux‐independent NMDA receptor activity is required for Aβ oligomer‐induced synaptic loss. Cell Death & Disease., 6, e1791. - PMC - PubMed

Publication types

Substances