. 2020 Dec 15;11(6):e02630-20.
doi: 10.1128/mBio.02630-20.

Nitric Oxide Circumvents Virus-Mediated Metabolic Regulation during Human Cytomegalovirus Infection

Affiliations

Nitric Oxide Circumvents Virus-Mediated Metabolic Regulation during Human Cytomegalovirus Infection

Rebekah L Mokry et al. mBio. .

Abstract

Nitric oxide is a versatile and critical effector molecule that can modulate many cellular functions. Although recognized as a regulator of infections, the inhibitory mechanism of nitric oxide against human cytomegalovirus (HCMV) replication remains elusive. We demonstrate that nitric oxide attenuates viral replication by interfering with HCMV-mediated modulation of several cellular processes. Nitric oxide exposure reduced HCMV genome synthesis and infectious viral progeny with cell-type-dependent differences observed. Mitochondrial respiration was severely reduced in both uninfected and HCMV-infected cells during exposure with little impact on ATP levels indicating changes in cellular metabolism. Metabolomics identified significantly altered small molecules in multiple pathways during nitric oxide exposure including nucleotide biosynthesis, tricarboxylic acid (TCA) cycle, and glutamine metabolism. Glutathione metabolites were increased coinciding with a reduction in the glutathione precursor glutamine. This shift was accompanied by increased antioxidant enzymes. Glutamine deprivation mimicked defects in HCMV replication and mitochondrial respiration observed during nitric oxide exposure. These data suggest that nitric oxide limits glutaminolysis by shuttling glutamine to glutathione synthesis. In addition, lipid intermediates were severely altered, which likely contributes to the observed increase in defective viral particles. Nitric oxide disrupts multiple cellular processes, and we had limited success in rescuing replication defects by supplementing with metabolic intermediates. Our studies indicate that nitric oxide attenuation of HCMV is multifactorial with interference in viral manipulation of cellular metabolism playing a central role.IMPORTANCE Human cytomegalovirus is a prevalent pathogen that can cause serious disease in patients with compromised immune systems, including transplant patients and during congenital infection. HCMV lytic replication likely occurs in localized sites of infection with immune cells infiltrating and releasing nitric oxide with other effector molecules. This nonspecific immune response results in both uninfected and infected cells exposed to high levels of nitric oxide. The absence of nitric oxide synthase has been associated with lethal HCMV infection. We demonstrate that nitric oxide inhibition of HCMV replication is multifactorial and cell type dependent. Our results indicate that nitric oxide controls replication by interfering with viral modulation of cellular metabolism while also affecting proliferation and mitochondrial respiration of neighboring uninfected cells. These studies identify the mechanism and contribution of nitric oxide during immune control of HCMV infection and provide insight into its role in other viral infections.

Keywords: TCA cycle; cytomegalovirus; glutaminolysis; metabolism; mitochondrial respiration; nitric oxide.


Figures

FIG 1
FIG 1
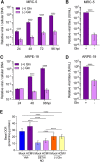
Physiological levels of nitric oxide attenuate HCMV genome replication and reduce infectious virion production from MRC-5 fibroblasts. (A) MRC-5 cells were plated at subconfluence, serum starved for 24 h, and infected with HCMV strain TB40/E encoding GFP (TB40/E-GFP) at an MOI of 3 infectious units/cell (IU/cell). Cells were treated at 2 hpi with the indicated concentrations of the nitric oxide donor diethylenetriamine NONOate (DETA/NO) or vehicle control. Relative viral to cellular DNA levels were measured at 24 hpi using quantitative PCR with primers to HCMV UL123 and cellular TP53 genes. P = 0.002, **; P < 0.0001, ****. (B to D) MRC-5 cells were infected as described above and treated at 2 hpi and every 24 h with 500 μM DETA/NO. Relative viral to cellular DNA levels were determined at the indicated time points (B and C), and viral titers were quantified by a TCID50 assay using culture supernatant collected at 96 hpi (D). (E) MRC-5 cells were infected as described above and treated starting at 24 hpi with 500 μM DETA/NO, and relative viral to cellular DNA levels were determined. P > 0.05, ns; P = 0.004, **; P = 0.0002, ***; P < 0.0001, ****. Data are the results of three biological replicates and two technical replicates. Error bars represent standard deviation from the mean. Statistical analyses were performed on transformed data for panels A to C and E. One-way ANOVA (A), two-way ANOVA (B, C, and E), or paired t test (D) was used to determine significance. (F) Estimated steady-state nitric oxide levels from various concentrations of DETA/NO were modeled using COPASI software. DETA/NO rate of decay was calculated using the t1/2 at 37°C (20 h). A fixed concentration of oxygen was estimated to be 220 μM, and the rate of nitric oxide and oxygen forming NO2 was set at 2.4 × 106 M−2 s−1 (41). The rate of nitric oxide with NO2 forming nitrite was set at 1 × 109 M−2 s−1.
FIG 2
FIG 2
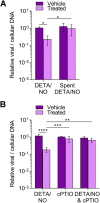
Nitric oxide release from DETA/NO but not nitric oxide oxidation products attenuates viral genome replication. MRC-5 cells were plated at subconfluence, serum starved for 24 h, and infected with TB40/E-GFP at an MOI of 3 IU/cell. Cells were treated at 2 hpi with 500 μM DETA/NO, spent DETA/NO (A), nitric oxide scavenger cPTIO (B), or vehicle control. Cells were collected at 24 hpi, and relative viral to cellular DNA levels were determined by quantitative PCR using primers to HCMV UL123 and cellular TP53 genes. Data are the results of three biological replicates and two technical replicates. Error bars represent standard deviation from the mean. Statistical analyses were performed on transformed data, and two-way ANOVA was used to determine significance. P < 0.05, *; P = 0.001, **; P = 0.0005, ***; P < 0.0001, ****.
FIG 3
FIG 3
Infected ARPE-19 epithelial cells exhibit altered HCMV replication characteristics compared to fibroblasts after nitric oxide exposure. Confluent ARPE-19 cells were infected with HCMV strain TB40/E-GFP at an MOI of 5 IU/cell. At 2 hpi, cells were treated with 500 μM DETA/NO or vehicle control. Relative viral to cellular DNA levels were determined at the indicated time points using primers to HCMV UL123 and cellular TP53 genes (A and B), and viral titers were quantified by a TCID50 assay on MRC-5 cells using culture supernatant collected at 96 hpi (C). Data are the results of three biological replicates and two technical replicates. Statistical analyses were performed on transformed data for panel B. Two-way ANOVA with multiple comparisons (B) and paired t test (C) were used to determine significance. P = 0.001, **; P = 0.0002, ***; P < 0.0001, ****.
FIG 4
FIG 4
Nitric oxide promotes cytostasis and disrupts expression of cell cycle regulators. (A and B) Uninfected MRC-5 and ARPE-19 cells were plated at subconfluence and treated every 24 h with DETA/NO or vehicle control. Cell viability and live cell number were quantified at the indicated time points using an automated cell counter and trypan blue exclusion. Data represent two biological replicates. (C) MRC-5 cells were plated at subconfluence and treated every 24 h with 500 μM DETA/NO or vehicle control. Whole-cell lysates were collected at the indicated time points and analyzed by Western blotting using antibodies against the indicated cellular proteins. The asterisk (*) denotes the band for cyclin E. Total protein was used as a loading control. Data represent two biological replicates.
FIG 5
FIG 5
Differential effects of nitric oxide on viral gene expression between cell types. (A to C) MRC-5 cells were plated at subconfluence, serum starved for 24 h, and infected with HCMV strain TB40/E-GFP at an MOI of 3 IU/cell. Confluent ARPE-19 cells were infected at an MOI of 5 IU/cell. MRC-5 and ARPE-19 cells were treated at 2 hpi and every 24 h with 500 μM DETA/NO or vehicle control. Total RNA was isolated at the indicated time points, and HCMV UL123 (A), UL44 (B), and UL99 (C) levels relative to cellular β-tubulin RNA levels were determined by quantitative RT-PCR using gene-specific primers. Data are the results of three biological replicates and two technical replicates. Statistical analyses were performed on transformed data, and two-way ANOVA with multiple comparisons was used to determine significance. P = 0.02, *; P = 0.001, **; P < 0.001, ***; P < 0.0001, ****. (D) MRC-5 and ARPE-19 cells were infected and treated as described above. Whole-cell lysates were collected at the indicated time points (hours postinfection, above blot). Lysates were analyzed by Western blotting using antibodies against the indicated viral proteins. Total protein was used as a loading control. Data represent three biological replicates.
FIG 6
FIG 6
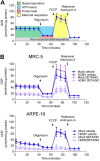
Nitric oxide reduces mitochondrial function. (A) Schematic of mitochondrial stress analysis using extracellular flux technology to measure cellular oxygen consumption. Sequential injections of oligomycin, FCCP, and rotenone/antimycin A allow the measurement of basal (green), ATP-linked (blue), maximal (yellow), proton leak (red), and nonmitochondrial (gray) oxygen consumption rates. (B) Confluent MRC-5 or ARPE-19 cells in a 96-well Seahorse Bioscience dish were infected at an MOI of 3 or 5 U/cell, respectively, or mock infected. At 2 hpi, cells were treated with 500 μM DETA/NO or vehicle control. Mitochondrial stress analysis was performed at 24 hpi as described above and normalized to total micrograms of protein.
FIG 7
FIG 7
Basal, ATP-linked, and maximal oxygen consumption is reduced during nitric oxide exposure. (A to C) Basal (A), ATP-linked (B), and maximal (C) cellular oxygen consumption was measured for MRC-5 and ARPE-19 cells during mitochondrial stress analysis as described in the legend to Fig. 6. Data are the results of two (ARPE-19) or three (MRC-5) biological replicates and 7 to 8 technical replicates. P < 0.0001, ****. (D) MRC-5 cells were plated at subconfluence, serum starved, and infected an MOI of 3 IU/cell or mock infected. Cells were treated at 2 hpi with 500 μM DETA/NO, and ATP was measured at 24 hpi using HPLC. Data are the results of three biological replicates. P < 0.03, *; P = 0.01, **. (E) MRC-5 cells were plated at subconfluence, serum starved for 24 h, and infected with HCMV strain TB40/E-GFP at an MOI of 3 IU/cell. Cells were treated at 2 hpi with 500 μM DETA/NO, 1 μM rotenone, or vehicle control. Relative viral to cellular DNA levels were determined at 24 hpi using primers to HCMV UL123 and cellular TP53 genes. Data represent two biological and two technical replicates. P < 0.03, *; P = 0.002, **; P = 0.0008, ***. Error bars represent standard deviation from the mean. Statistical analyses were performed on transformed data for panels A to C and E. One-way ANOVA (A to D) or two-way ANOVA (E) was used to determine significance. Black circles represent individual data points.
FIG 8
FIG 8
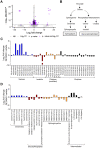
Lipid metabolites relevant to virion production are altered in response to nitric oxide exposure during HCMV infection. MRC-5 cells were plated at subconfluence, serum starved for 24 h, infected at an MOI of 3 IU/cell, and treated at 2 hpi with 500 μM DETA/NO. Cells were washed, collected at 24 hpi into liquid nitrogen, and analyzed using untargeted LC-MS to measure metabolites. (A) Volcano plot of altered metabolites during infection in DETA/NO- versus vehicle-treated groups. Each circle represents one metabolite. Purple indicates significantly (P < 0.05) altered metabolites with fold change greater than 1.5. (B) An abridged schematic of lipid pathways relevant to observed changes. (C and D) Significantly altered levels of sphingolipids (C) and glycerophospholipids (D) after nitric oxide exposure compared to vehicle during infection. Data are from three biological replicates and three technical replicate injections with significance determined using unpaired t test (P < 0.05).
FIG 9
FIG 9
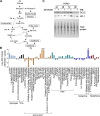
Metabolites in glutamine, TCA cycle, and nucleotide biosynthesis pathways are altered in response to nitric oxide exposure during HCMV infection. (A) Schematic of metabolic pathways during infection (5). (B) As described in the legend to Fig. 8, MRC-5 cells were plated at subconfluence, serum starved for 24 h, infected at an MOI of 3 IU/cell, and treated at 2 hpi with 500 μM DETA/NO. Cells were washed, collected at 24 hpi into liquid nitrogen, and analyzed using untargeted LC-MS to measure metabolites. The graph displays relative abundance of significantly altered metabolites from a subset of metabolic pathways during nitric oxide exposure: glycolysis (light blue), TCA cycle (black), amino acid (orange), pentose phosphate pathway (PPP) (blue/green), glutamine (dark blue), and glutathione (red). Data are from three biological replicates and three technical replicate injections with significance determined using unpaired t test (P < 0.05). # indicates that the metabolite was identified in only one treatment group. (C) MRC-5 cells were infected and treated as described above. Whole-cell lysates were collected at the indicated time points (hours postinfection, above blot). Lysates were analyzed by Western blotting using antibodies against the indicated cellular proteins. Total protein was used as a loading control. Data represent three biological replicates.
FIG 10
FIG 10
Nitric oxide inhibition of HCMV infection is phenotypically similar to glutamine deprivation. (A to D) MRC-5 cells were plated at subconfluence, serum starved for 24 h, and infected at an MOI of 3 IU/cell (A and B). Confluent ARPE-19 cells were infected at an MOI of 5 IU/cell (C and D). At 2 hpi, cells were washed, and medium was replaced with high glucose with or without 2 mM glutamine. Medium was changed every 24 h to match nitric oxide exposure conditions. Relative viral to cellular DNA levels were determined using quantitative PCR at the indicated time points using primers to HCMV UL123 and cellular TP53 genes (A and C). Viral titers were quantified at 96 hpi by a TCID50 assay (B and D). Data are the results of three biological replicates and two technical replicates. (E) MRC-5 cells were plated in a 96-well Seahorse Bioscience dish, grown to confluence, and infected at an MOI of 3 IU/cell or mock infected. At 2 hpi, cells were treated in medium containing high glucose and 2 mM glutamine with 500 μM DETA/NO or vehicle control or with high glucose in glutamine-free medium. Basal oxygen consumption rates were measured at 24 hpi and normalized to total micrograms of protein. Data are the results of two biological replicates and 7 to 8 technical replicates. Data from one replicate were previously displayed in Fig. 7A. Error bars represent standard deviation from the mean. Statistical analyses were performed on transformed data for panels A and C. Two-way ANOVA (A and C), paired t test (B and D), or one-way ANOVA (E) was used to determine significance. P < 0.0001, ****.
FIG 11
FIG 11
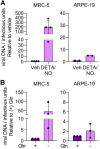
Cell-type-dependent differences in infectivity during nitric oxide exposure and glutamine deprivation. MRC-5 cells were plated at subconfluence, serum starved for 24 h, and infected at an MOI of 3 IU/cell. Confluent ARPE-19 cells were infected at an MOI of 5 IU/cell. At 2 hpi, cells were treated with 500 μM DETA/NO or vehicle control every 24 h (A), or medium was replaced with high glucose with or without 2 mM glutamine (B). Medium was changed every 24 h. Virus infectivity was measured by quantifying relative viral DNA levels to infectious units at 96 hpi. Total DNA was isolated from DNase-treated culture supernatants and measured using quantitative PCR, and viral titers were quantified by a TCID50 assay. Data are graphed relative to vehicle (A) or with addition of glutamine (B).
FIG 12
FIG 12
Addition of specific intermediates during nitric oxide exposure partially restores viral DNA synthesis and infectious virion production. (A) MRC-5 cells were plated subconfluently, serum starved for 24 h, and infected at an MOI of 3 IU/cell. At 2 hpi, cells were treated with 500 μM DETA/NO, 1 mM deoxyribonucleosides (dN), or vehicle control. Relative viral to cellular DNA levels were measured at 24 hpi using quantitative PCR with primers to HCMV UL123 and cellular TP53 genes. Data are the results of three biological and two technical replicates. Statistical analyses were performed on transformed data, and two-way ANOVA was used to determine significance. P < 0.005, **; P < 0.0001, ****. (B to F) Cells were plated subconfluently, serum starved for 24 h, and infected at an MOI of 3 IU/cell. At 2 hpi, cells in high-glucose and 2 mM glutamine medium were treated with 500 μM DETA/NO, or vehicle control, and the addition of 1 mM uridine (B), 2 mM glutamine (C), 7 mM α-ketoglutarate (α-KG) (D), 4 mM pyruvate (E), 4 mM oxaloacetate (Oxa) (F), or vehicle control. (B) Relative viral to cellular DNA levels were measured at 24 and 96 hpi using quantitative PCR with primers to HCMV UL123 and cellular TP53 genes. (B to F) Viral titers were quantified by a TCID50 assay using culture supernatants from 96 hpi. Error bars represent standard deviations from the means. Data are the results of two to three biological replicates and two technical replicates. Statistical analyses were performed on transformed data, and one-way ANOVA was used to determine significance. P ≤ 0.02, *; P ≤ 0.003, **; P ≤ 0.0005, ***; P < 0.0001, ****. ns, not significant.

Similar articles

Cited by

References

    1. Mocarski E, Shenk T, Pass R. 2007. Cytomegaloviruses, p 2701–2772. In Knipe DM, Howley PM, Griffin DE, Lamb RA, Martin MA, Roizman B, Straus SE (ed), Fields virology, 5th ed. Lippincott Williams & Wilkins, Philadelphia, PA.
    1. Schleiss MR. 2018. Congenital cytomegalovirus: impact on child health. Contemp Pediatr 35:16–24. - PMC - PubMed
    1. Sinzger C, Digel M, Jahn G. 2008. Cytomegalovirus cell tropism, p 63–83. In Shenk TE, Stinski MF (ed), Human cytomegalovirus. Springer, Berlin, Germany. - PubMed
    1. Landini MP. 1984. Early enhanced glucose uptake in human cytomegalovirus-infected cells. J Gen Virol 65:1229–1232. doi:10.1099/0022-1317-65-7-1229. - DOI - PubMed
    1. Munger J, Bennett BD, Parikh A, Feng X-J, McArdle J, Rabitz HA, Shenk T, Rabinowitz JD. 2008. Systems-level metabolic flux profiling identifies fatty acid synthesis as a target for antiviral therapy. Nat Biotechnol 26:1179–1186. doi:10.1038/nbt.1500. - DOI - PMC - PubMed

Publication types