Regulation of Oncogenic Targets by the Tumor-Suppressive miR-139 Duplex (miR-139-5p and miR-139-3p) in Renal Cell Carcinoma
- PMID: 33322675
- PMCID: PMC7764717
- DOI: 10.3390/biomedicines8120599
Regulation of Oncogenic Targets by the Tumor-Suppressive miR-139 Duplex (miR-139-5p and miR-139-3p) in Renal Cell Carcinoma
Abstract
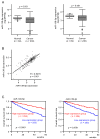
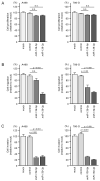
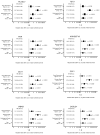
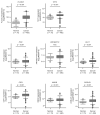
We previously found that both the guide and passenger strands of the miR-139 duplex (miR-139-5p and miR-139-3p, respectively) were downregulated in cancer tissues. Analysis of TCGA datasets revealed that low expression of miR-139-5p (p < 0.0001) and miR-139-3p (p < 0.0001) was closely associated with 5-year survival rates of patients with renal cell carcinoma (RCC). Ectopic expression assays showed that miR-139-5p and miR-139-3p acted as tumor-suppressive miRNAs in RCC cells. Here, 19 and 22 genes were identified as putative targets of miR-139-5p and miR-139-3p in RCC cells, respectively. Among these genes, high expression of PLXDC1, TET3, PXN, ARHGEF19, ELK1, DCBLD1, IKBKB, and CSF1 significantly predicted shorter survival in RCC patients according to TCGA analyses (p < 0.05). Importantly, the expression levels of four of these genes, PXN, ARHGEF19, ELK1, and IKBKB, were independent prognostic factors for patient survival (p < 0.05). We focused on PXN (paxillin) and investigated its potential oncogenic role in RCC cells. PXN knockdown significantly inhibited cancer cell migration and invasion, possibly by regulating epithelial-mesenchymal transition. Involvement of the miR-139-3p passenger strand in RCC molecular pathogenesis is a new concept. Analyses of tumor-suppressive-miRNA-mediated molecular networks provide important insights into the molecular pathogenesis of RCC.
Keywords: miR-139-3p; miR-139-5p; microRNA; paxillin (PXN); renal cell carcinoma (RCC); tumor suppressor.
Conflict of interest statement
The authors declare no conflict of interest.
Figures



Similar articles
-
Role of pre-miR-532 (miR-532-5p and miR-532-3p) in regulation of gene expression and molecular pathogenesis in renal cell carcinoma.Am J Clin Exp Urol. 2019 Feb 18;7(1):11-30. eCollection 2019. Am J Clin Exp Urol. 2019. PMID: 30906802 Free PMC article.
-
Identification of miR-199-5p and miR-199-3p Target Genes: Paxillin Facilities Cancer Cell Aggressiveness in Head and Neck Squamous Cell Carcinoma.Genes (Basel). 2021 Nov 27;12(12):1910. doi: 10.3390/genes12121910. Genes (Basel). 2021. PMID: 34946859 Free PMC article.
-
Anti-tumor roles of both strands of the miR-455 duplex: their targets SKA1 and SKA3 are involved in the pathogenesis of renal cell carcinoma.Oncotarget. 2018 Jun 1;9(42):26638-26658. doi: 10.18632/oncotarget.25410. eCollection 2018 Jun 1. Oncotarget. 2018. PMID: 29928475 Free PMC article.
-
Dual strands of the miR-223 duplex (miR-223-5p and miR-223-3p) inhibit cancer cell aggressiveness: targeted genes are involved in bladder cancer pathogenesis.J Hum Genet. 2018 May;63(5):657-668. doi: 10.1038/s10038-018-0437-8. Epub 2018 Mar 14. J Hum Genet. 2018. PMID: 29540855
-
Versatile role of miR-24/24-1*/24-2* expression in cancer and other human diseases.Am J Transl Res. 2022 Jan 15;14(1):20-54. eCollection 2022. Am J Transl Res. 2022. PMID: 35173828 Free PMC article. Review.
Cited by
-
Lactylation stabilizes DCBLD1 activating the pentose phosphate pathway to promote cervical cancer progression.J Exp Clin Cancer Res. 2024 Jan 31;43(1):36. doi: 10.1186/s13046-024-02943-x. J Exp Clin Cancer Res. 2024. PMID: 38291438 Free PMC article.
-
Molecular Pathogenesis of Colorectal Cancer: Impact of Oncogenic Targets Regulated by Tumor Suppressive miR-139-3p.Int J Mol Sci. 2022 Oct 1;23(19):11616. doi: 10.3390/ijms231911616. Int J Mol Sci. 2022. PMID: 36232922 Free PMC article.
-
Identification of Tumor-Suppressive miR-30e-3p Targets: Involvement of SERPINE1 in the Molecular Pathogenesis of Head and Neck Squamous Cell Carcinoma.Int J Mol Sci. 2022 Mar 30;23(7):3808. doi: 10.3390/ijms23073808. Int J Mol Sci. 2022. PMID: 35409173 Free PMC article.
-
Editorial to the Special Issue "MicroRNA in Solid Tumor and Hematological Diseases".Biomedicines. 2021 Nov 12;9(11):1678. doi: 10.3390/biomedicines9111678. Biomedicines. 2021. PMID: 34829905 Free PMC article.
-
MicroRNAs Possibly Involved in the Development of Bone Metastasis in Clear-Cell Renal Cell Carcinoma.Cancers (Basel). 2021 Mar 28;13(7):1554. doi: 10.3390/cancers13071554. Cancers (Basel). 2021. PMID: 33800656 Free PMC article.
References
Grants and funding
LinkOut - more resources
Full Text Sources
Research Materials
Miscellaneous

