. 2020 Dec 15:9:e57457.
doi: 10.7554/eLife.57457.

Therapeutic genetic variation revealed in diverse Hsp104 homologs

Affiliations

Therapeutic genetic variation revealed in diverse Hsp104 homologs

Zachary M March et al. Elife. .

Abstract

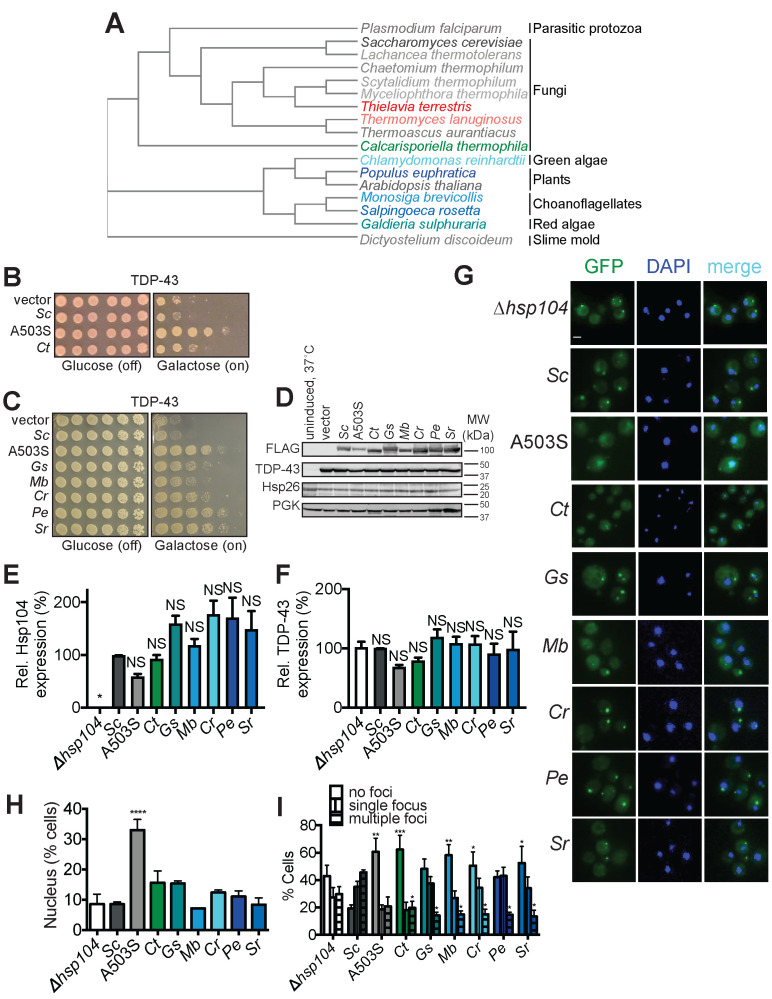
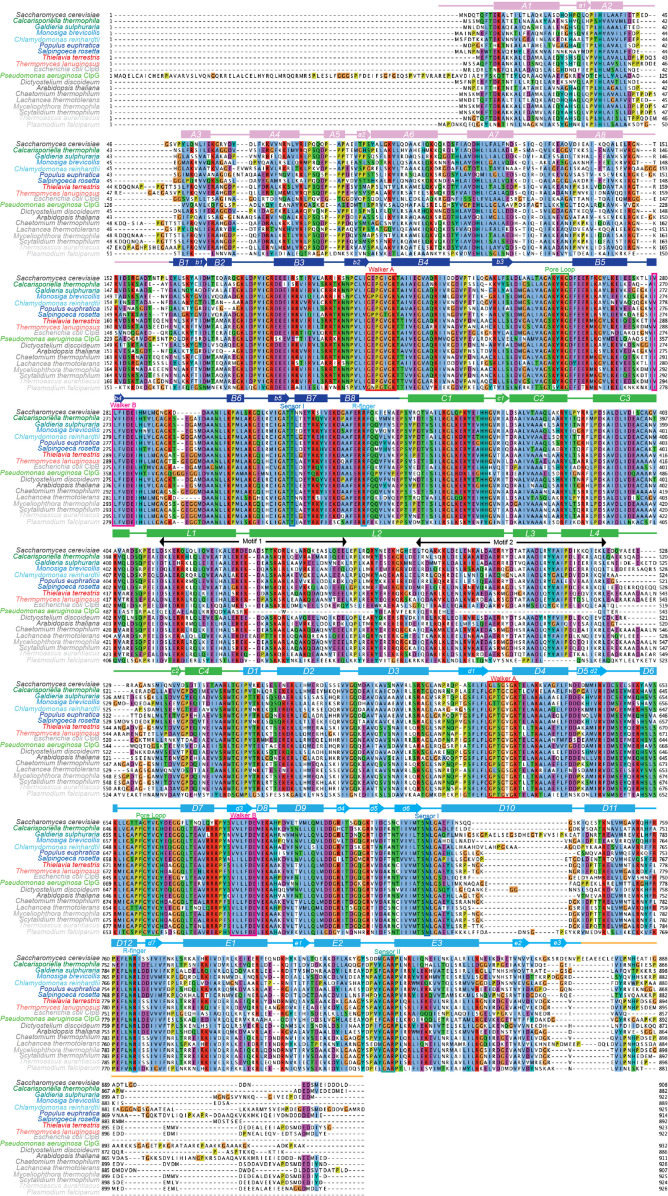
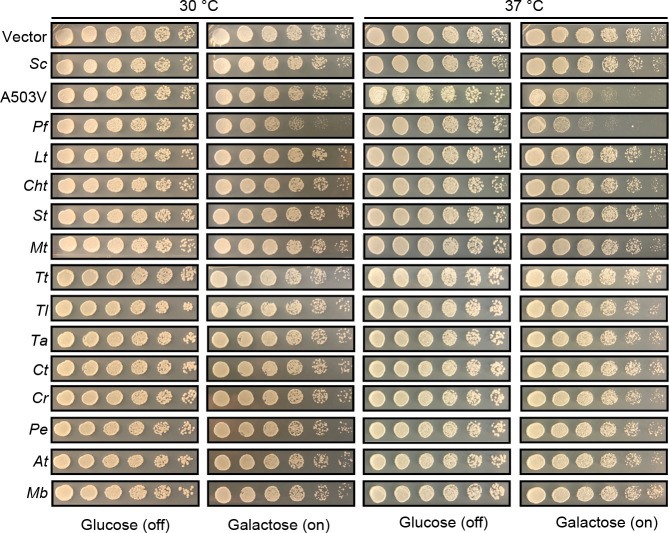
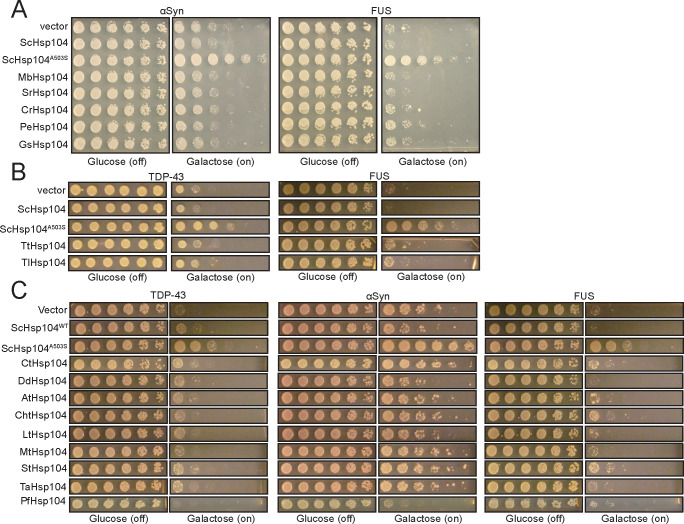
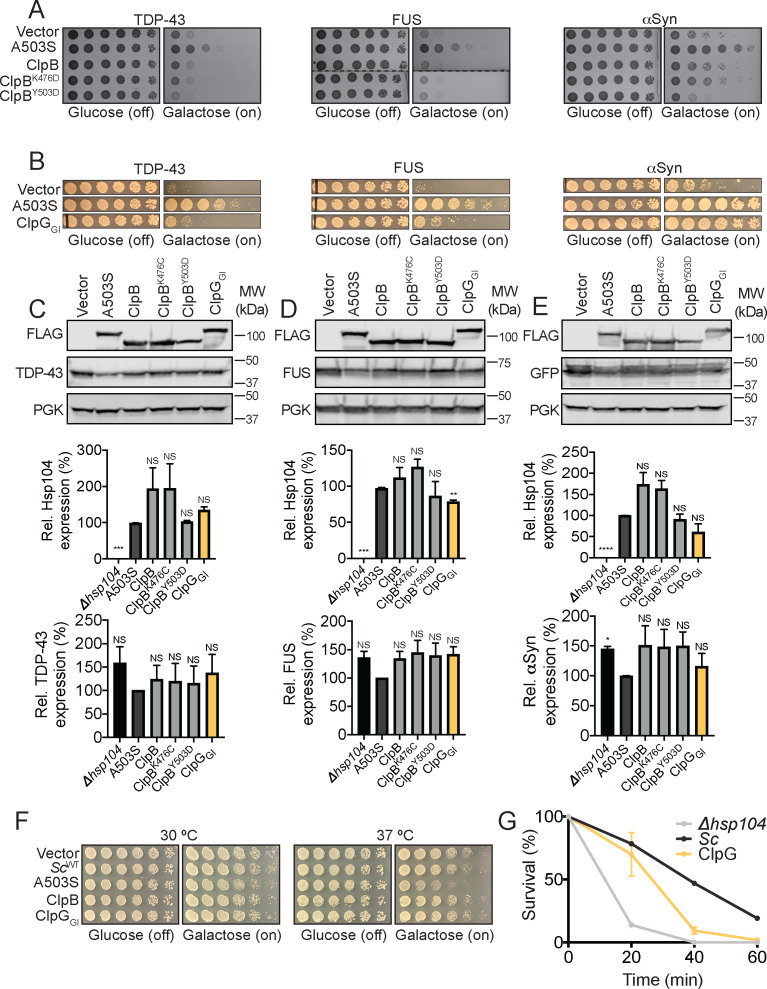
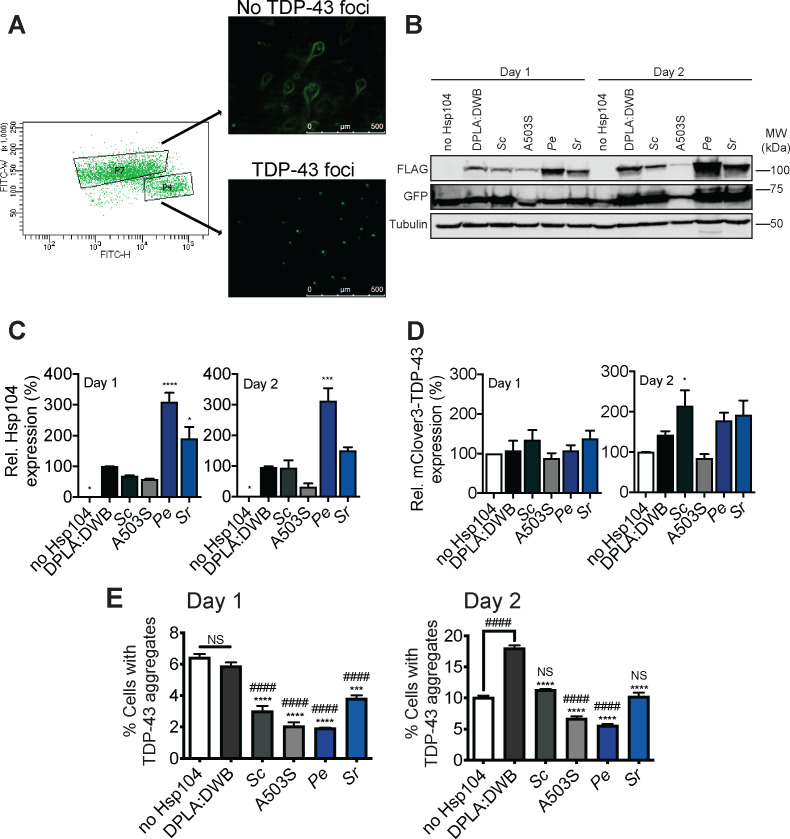
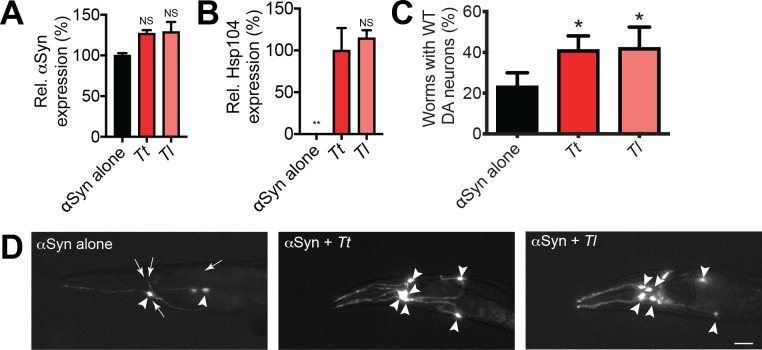
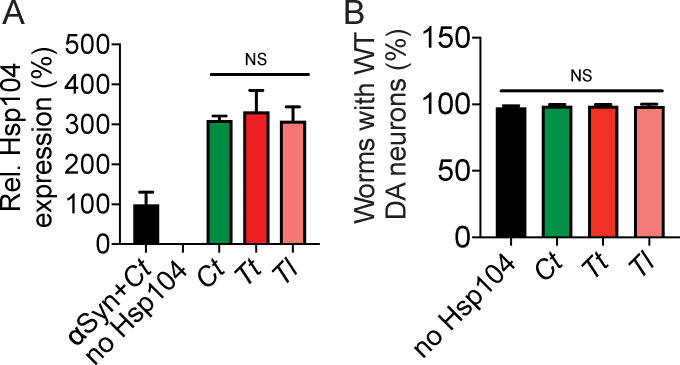
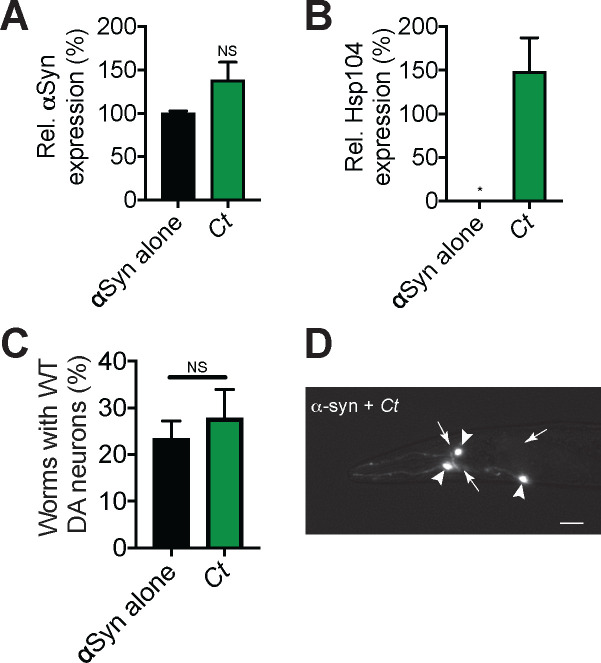
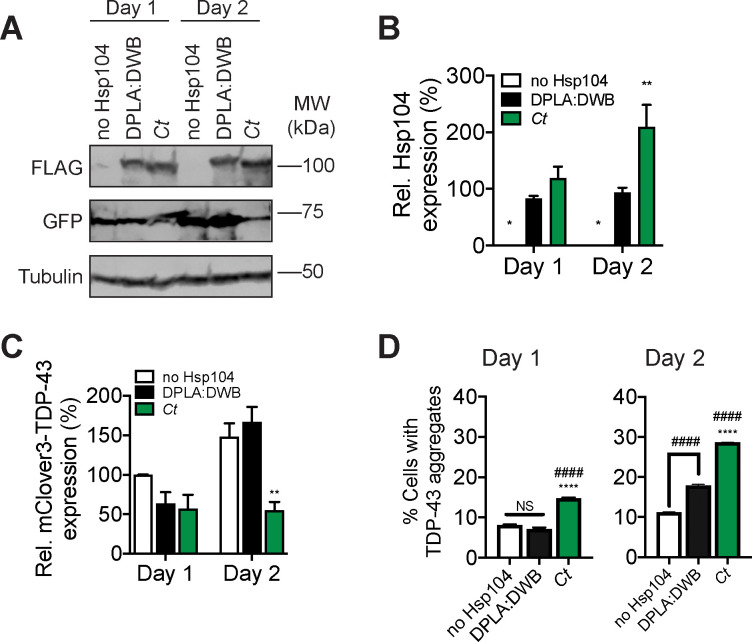
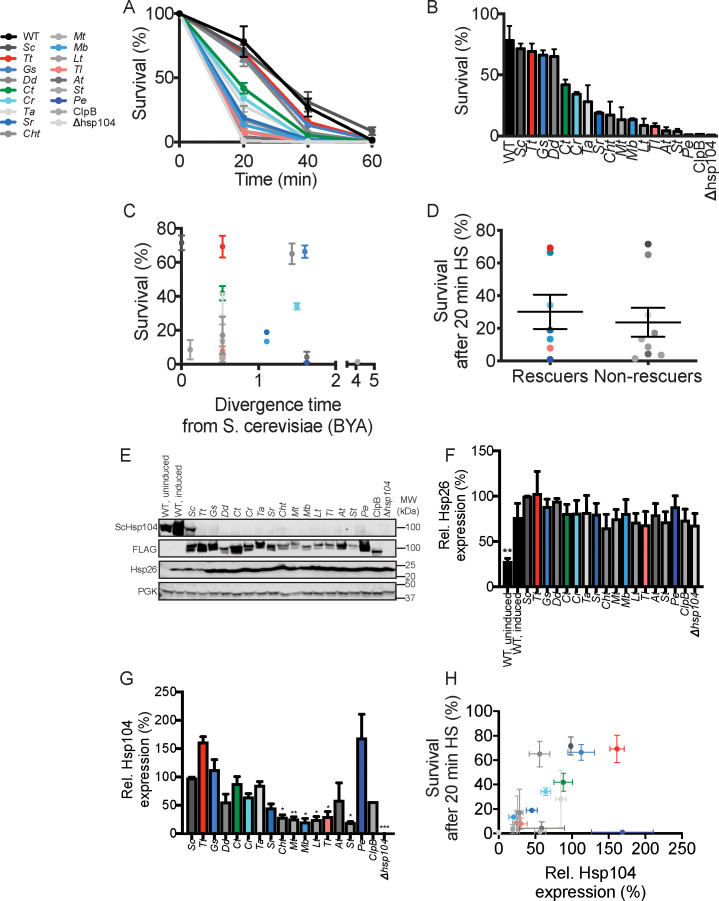
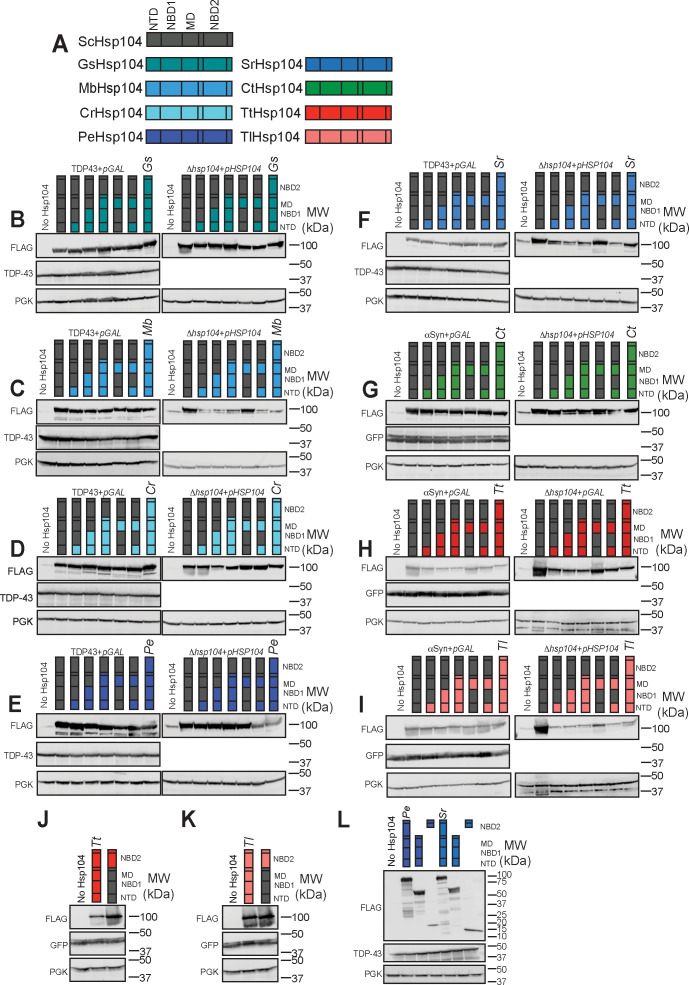
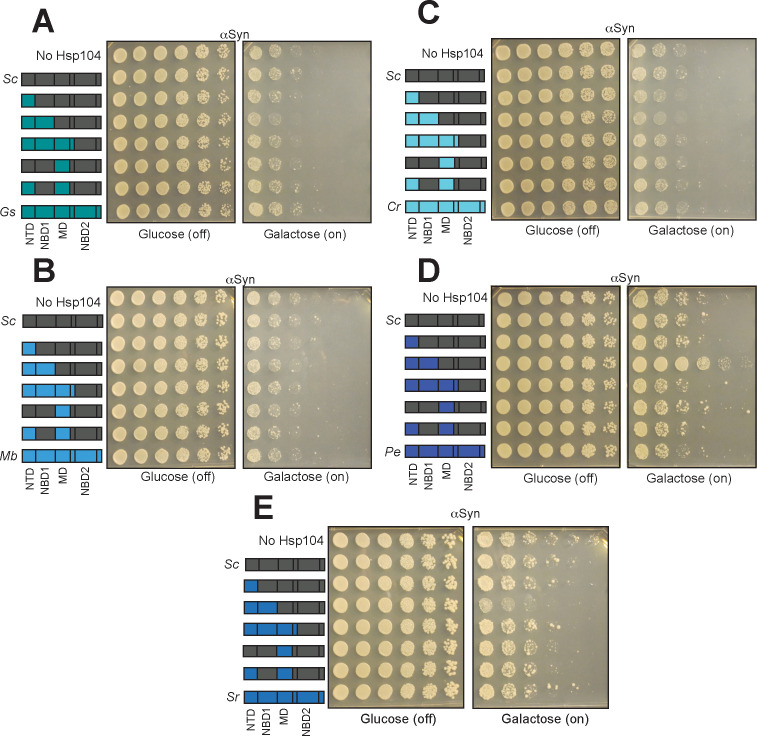
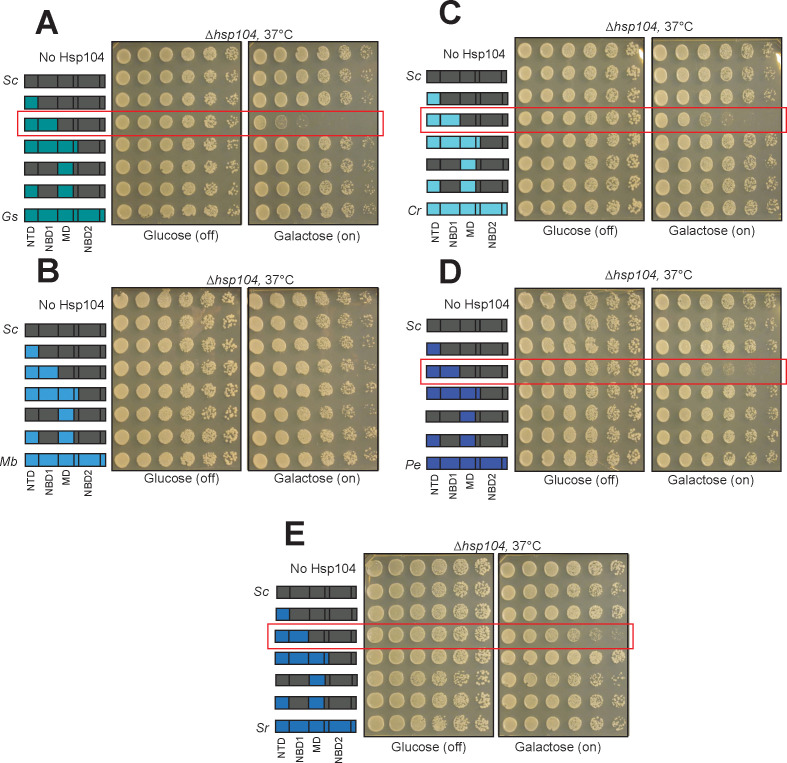
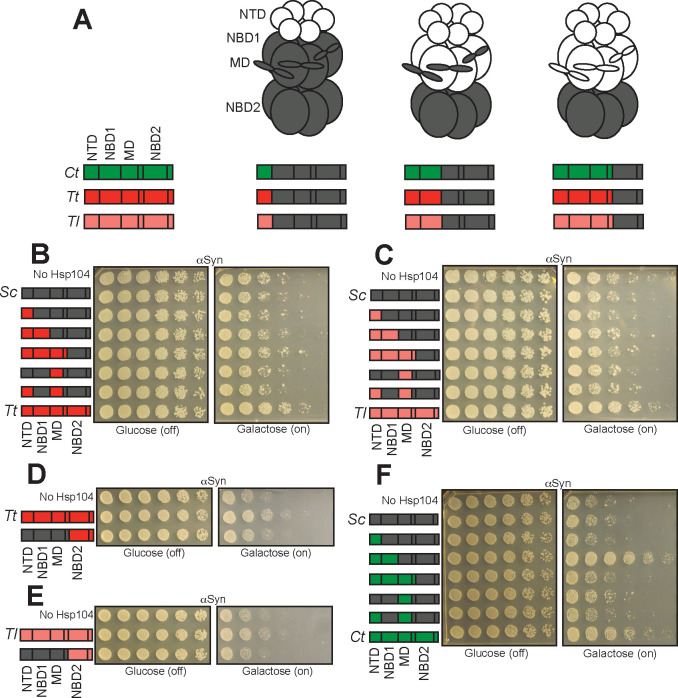
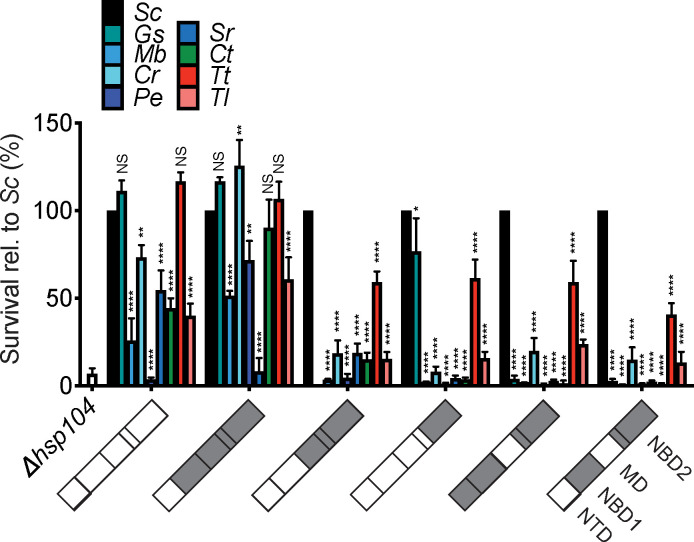
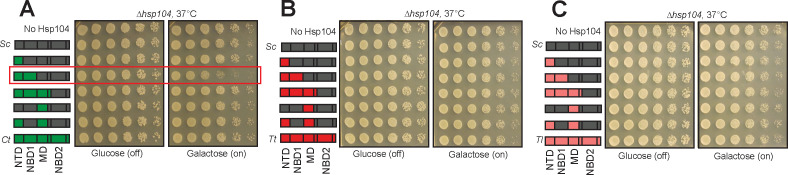
The AAA+ protein disaggregase, Hsp104, increases fitness under stress by reversing stress-induced protein aggregation. Natural Hsp104 variants might exist with enhanced, selective activity against neurodegenerative disease substrates. However, natural Hsp104 variation remains largely unexplored. Here, we screened a cross-kingdom collection of Hsp104 homologs in yeast proteotoxicity models. Prokaryotic ClpG reduced TDP-43, FUS, and α-synuclein toxicity, whereas prokaryotic ClpB and hyperactive variants were ineffective. We uncovered therapeutic genetic variation among eukaryotic Hsp104 homologs that specifically antagonized TDP-43 condensation and toxicity in yeast and TDP-43 aggregation in human cells. We also uncovered distinct eukaryotic Hsp104 homologs that selectively antagonized α-synuclein condensation and toxicity in yeast and dopaminergic neurodegeneration in C. elegans. Surprisingly, this therapeutic variation did not manifest as enhanced disaggregase activity, but rather as increased passive inhibition of aggregation of specific substrates. By exploring natural tuning of this passive Hsp104 activity, we elucidated enhanced, substrate-specific agents that counter proteotoxicity underlying neurodegeneration.

Keywords: C. elegans; Hsp104; S. cerevisiae; TDP-43; alpha-synuclein; biochemistry; chaperone; chemical biology; disaggregase; genetics; genomics; protein misfolding.


Conflict of interest statement

ZM, KS, HK, XY, LC, MJ, JL, EC, EG, CW, KM, RJ, AJ, KC, GC, OS No competing interests declared, JS JS is a consultant for Dewpoint Therapeutics and Maze Therapeutics.

Figures

Figure 1.
Figure 1.. Diverse Hsp104 homologs suppress TDP-43 toxicity in yeast.
(A) Phylogenetic tree constructed using EMBL-EBI Simple Phylogeny tool from a multiple sequence alignment of the indicated Hsp104 homologs generated in Clustal Omega (see also Supplemental Information for alignments) showing evolutionary relationships between Hsp104 homologs studied in this paper. C. thermophila is in green, TDP-43-specific homologs are colored in shades of blue, αSyn-specific homologs are colored in red, and non-rescuing homologs are colored in shades of gray. (B) Δhsp104 yeast transformed with plasmids encoding galactose-inducible TDP-43 and the indicated galactose-inducible Hsp104 (either wild-type Hsp104 from Saccharomyces cerevisiae, the potentiated variant A503S, or the Hsp104 homolog from Calcarisporiella thermophila (Ct)) were serially diluted 5-fold and spotted onto glucose (expression off) or galactose (expression on). (C) Δhsp104 yeast transformed with plasmids encoding galactose-inducible TDP-43 and the indicated galactose-inducible Hsp104 (either wild-type Hsp104 from S. cerevisiae, the potentiated variant A503S, or homologs from Galdieria sulphuraria (Gs), Monosiga brevicollis (Mb), Chlamydomonas reinhardtii (Cr), Populus euphratica (Pe), and Salpingoeca rosetta (Sr)) were serially diluted 5-fold and spotted onto glucose (expression off) or galactose (expression on). (D) Western blots confirm consistent expression of FLAG-tagged Hsp104s and proteotoxic protein substrates in yeast, and that neither Hsp104 expression nor TDP-43 expression induces upregulation of the endogenous heat-shock protein Hsp26. The first lane are isogenic yeast that have not been grown in galactose to induce Hsp104 and TDP-43 expression but instead have been pretreated at 37°C for 30 min to upregulate endogenous heat-shock proteins. 3-phosphoglycerate kinase (PGK) is used as a loading control. Molecular weight markers are indicated (right). (E) Expression of the indicated Hsp104-FLAG relative to PGK was quantified for each strain. Values are means ± SEM (n = 3). One-way ANOVA with Dunnett’s multiple comparisons test was used to compare expression of ScHsp104-FLAG (Sc) to all other conditions. *p<0.05; NS, not significant. (F) TDP-43 expression relative to PGK was quantified for each strain. Values are means ± SEM (n = 3). One-way ANOVA with Dunnett’s multiple comparisons test was used to compare TDP-43 levels in the ∆hsp104 control to all other conditions. NS, not significant. (G) Representative images of yeast co-expressing TDP-43-GFPS11 (and separately GFPS1-10 to promote GFP reassembly) and the indicated Hsp104 homologs. Cells were stained with DAPI to visualize nuclei (blue). Scale bar, 2.5 µm. (H) Quantification of cells where TDP-43 displays nuclear localization. Values represent means ± SEM (n = 3 trials with >200 cells counted per trial). One-way ANOVA with Dunnett’s multiple comparisons test was used to compare Δhsp104 to all other conditions. ****p<0.0001. (I) Quantification of cells with no, single, or multiple TDP-43 foci. Values represent means ± SEM (n = 3). Two-way ANOVA with Tukey’s multiple comparisons test was used to compare the proportion of cells with either no or multiple TDP-43 foci between strains expressing different Hsp104 homologs and a control strain expressing ScHsp104. *p<0.05; **p<0.01; ***p<0.001.
Figure 1—figure supplement 1.
Figure 1—figure supplement 1.. Alignment of all Hsp104 homologs investigated in this study.
Amino acid sequences of Hsp104 homologs were aligned using Clustal Omega, and the multiple sequence alignment was visualized with JalView. Positions in the alignment are colored by Clustal X convention: conserved hydrophobic positions (A,I,L,M,F,W,V,C) are blue; conserved basic residues (K,R) are red; acidic residues (E,D) are magenta; polar residues (N,Q,S,T) are green; aromatic residues (H,Y) are cyan; conserved cysteines are pink; glycines are orange, prolines are yellow. Structural elements of Hsp104 are indicated. C. thermophila and ClpG are in green, TDP-43-specific homologs are colored in shades of blue, αSyn-specific homologs are colored in red, and non-rescuing homologs are colored in shades of gray.
Figure 1—figure supplement 2.
Figure 1—figure supplement 2.. Hsp104 homologs do not typically induce temperature-dependent toxicity.
Spotting assay showing that yeast strains expressing the indicated Hsp104 homolog do not show a temperature-dependent growth defect. None of the Hsp104 homologs were toxic at 30 or 37°C with the exception of PfHsp104, which was toxic at both temperatures. PfHsp104 was even more toxic than the potentiated Hsp104 variant, Hsp104A503V, at 37°C. Unlike PfHsp104, Hsp104A503V was not toxic at 30°C.
Figure 1—figure supplement 3.
Figure 1—figure supplement 3.. Suppression of TDP-43 or αSyn toxicity by select Hsp104 homologs is a substrate-specific effect.
(A) Spotting assay showing that MbHsp104, SrHsp104, CrHsp104, PeHsp104, and GsHsp104, which all suppress TDP-43 toxicity, have minimal effect on αSyn or FUS toxicity. ScHsp104A503S is included as a positive control and empty vector and ScHsp104WT are included as negative controls. (B) Spotting assay showing that TtHsp104 and TlHsp104 have minimal effect on TDP-43 or FUS toxicity. (C) Spotting assay showing that other Hsp104 homologs investigated in this study have minimal effect on TDP-43 (left), αSyn (middle), or FUS (right) toxicity.
Figure 1—figure supplement 4.
Figure 1—figure supplement 4.. Alignment comparing ScHsp104 to Hsp104 homologs that rescue TDP-43 toxicity.
Amino acid sequences of the indicated Hsp104 homologs were aligned using Clustal Omega, and the multiple sequence alignment was visualized with JalView. Positions in the alignment are colored by Clustal X convention: conserved hydrophobic positions (A,I,L,M,F,W,V,C) are blue; conserved basic residues (K,R) are red; acidic residues (E,D) are magenta; polar residues (N,Q,S,T) are green; aromatic residues (H,Y) are cyan; conserved cysteines are pink; glycines are orange, prolines are yellow. Structural elements of Hsp104 are indicated.
Figure 2.
Figure 2.. Hsp104 homologs from thermophilic fungi suppress αSyn toxicity in yeast.
(A) Δhsp104 yeast transformed with plasmids encoding galactose-inducible αSyn and the indicated galactose-inducible Hsp104 (either wild-type Hsp104 from Saccharomyces cerevisiae, the potentiated variant A503S, or the Hsp104 homolog from Calcarisporiella thermophila (Ct)) were serially diluted 5-fold and spotted onto glucose (expression off) or galactose (expression on). (B) Δhsp104 yeast transformed with plasmids encoding galactose-inducible αSyn and the indicated galactose-inducible Hsp104 (either wild-type Hsp104 from S. cerevisiae, the potentiated variant A503S, or homologs from Thielavia terrestris (Tt), and Thermomyces lanuginosus (Tl)) were serially diluted 5-fold and spotted onto glucose (expression off) or galactose (expression on). (C) Western blots confirm consistent expression of FLAG-tagged Hsp104s and proteotoxic protein substrates in yeast, and that neither Hsp104 expression nor αSyn-GFP expression induces upregulation of the endogenous heat-shock protein Hsp26. The first lane are isogenic yeast that have not been grown in galactose to induce Hsp104 and αSyn expression but instead have been pretreated at 37°C for 30 min to upregulate heat-shock proteins. PGK is used as a loading control. Molecular weight markers are indicated (right). (D) Expression of the indicated Hsp104-FLAG relative to PGK was quantified for each strain. Values are means ± SEM (n = 3). One-way ANOVA with Dunnett’s multiple comparisons test was used to compare expression of ScHsp104-FLAG (Sc) to all other conditions. ***p<0.001; NS, not significant. (E) αSyn-GFP expression relative to PGK was quantified for each strain. Values are means ± SEM (n = 3). One-way ANOVA with Dunnett’s multiple comparisons test was used to compare αSyn-GFP levels the ∆hsp104 control to all other conditions. NS, not significant. (F–G) Fluorescence microscopy of cells coexpressing αSyn-GFP and vector, ScHsp104WT, ScHsp104A503S, CtHsp104, TtHsp104, or TlHsp104. Scale bar, 2.5 µm. αSyn localization was quantified as the number of cells with fluorescence at the plasma membrane or cytoplasmic inclusions. Values are means ± SEM (n = 3 trials with >200 cells counted per trial). One-way ANOVA with Dunnett’s multiple comparisons test was used to compare Δhsp104 to all other conditions. ***p<0.001; ****p<0.0001.
Figure 2—figure supplement 1.
Figure 2—figure supplement 1.. Alignment comparing ScHsp104 to Hsp104 homologs that rescue αSyn toxicity.
Amino acid sequences of the indicated Hsp104 homologs were aligned using Clustal Omega, and the multiple sequence alignment was visualized with JalView. Amino acids are colored according to Clustal X convention: conserved hydrophobic positions (A,I,L,M,F,W,V,C) are blue; conserved basic residues (K,R) are red; acidic residues (E,D) are magenta; polar residues (N,Q,S,T) are green; aromatic residues (H,Y) are cyan; conserved cysteines are pink; glycines are orange, prolines are yellow. Structural elements of Hsp104 are indicated.
Figure 2—figure supplement 2.
Figure 2—figure supplement 2.. Alignment comparing Hsp104 homologs that rescue TDP-43 toxicity to those that rescue αSyn toxicity.
(A) Amino acid sequences of the indicated Hsp104 homologs were aligned using Clustal Omega, and the multiple sequence alignment was visualized with JalView. Amino acids are colored according to Clustal X convention: conserved hydrophobic positions (A,I,L,M,F,W,V,C) are blue; conserved basic residues (K,R) are red; acidic residues (E,D) are magenta; polar residues (N,Q,S,T) are green; aromatic residues (H,Y) are cyan; conserved cysteines are pink; glycines are orange, prolines are yellow. Structural elements of Hsp104 are indicated. TDP-43-specific Hsp104 homologs are boxed in blue and alpha-synuclein-specific homologs are boxed in red. (B) Bar chart comparing average pairwise sequence identities between Hsp104 homologs with different toxicity-suppression phenotypes (none: does not mitigate TDP-43 or αSyn toxicity; CtHsp104: mitigates TDP-43 and αSyn toxicity; αSyn: mitigates αSyn toxicity but not TDP-43 toxicity; TDP-43: mitigates TDP-43 toxicity but not αSyn toxicity).
Figure 2—figure supplement 3.
Figure 2—figure supplement 3.. ClpGGI robustly suppresses αSyn toxicity and confers thermotolerance to Δhsp104 yeast, whereas ClpB and hyperactive variants do not.
(A) Spotting assay demonstrating that neither ClpB nor hyperactive ClpB variants suppress TDP-43, FUS, or αSyn toxicity. Dashed line indicates splicing of FUS plate. (B) Spotting assay demonstrating slight suppression of TDP-43 and FUS toxicity, and robust suppression of αSyn toxicity by ClpGGI. (C) Western blots (top) show consistent expression of FLAG-tagged ClpB, ClpB variants, ClpG, and TDP-43 in yeast. Expression of the indicated FLAG-tagged Hsp104, ClpB, or ClpG variant relative to PGK was quantified for each strain (middle). Values are means ± SEM (n = 3). One-way ANOVA with Dunnett’s multiple comparisons test was used to compare expression of A503S-FLAG to all other conditions. ***p<0.001; NS, not significant. TDP-43 expression relative to PGK was quantified for each strain (bottom). One-way ANOVA with Dunnett’s multiple comparisons test was used to compare TDP-43 levels in strains coexpressing A503S-FLAG to all other conditions. NS, not significant. (D) Western blots (top) show consistent expression of FLAG-tagged ClpB, ClpB variants, ClpG, and FUS in yeast. Expression of the indicated FLAG-tagged Hsp104, ClpB, or ClpG variant relative to PGK was quantified for each strain (middle). Values are means ± SEM (n = 3). One-way ANOVA with Dunnett’s multiple comparisons test was used to compare expression of A503S-FLAG to all other conditions. **p<0.01; ***p<0.001; NS, not significant. FUS expression relative to PGK was quantified for each strain (bottom). One-way ANOVA with Dunnett’s multiple comparisons test was used to compare FUS levels in strains coexpressing A503S-FLAG to all other conditions. NS, not significant. (E) Western blots (top) show consistent expression of FLAG-tagged ClpB, ClpB variants, ClpG, and αSyn-GFP in yeast. Expression of the indicated FLAG-tagged Hsp104, ClpB, or ClpG variant relative to PGK was quantified for each strain (middle). Values are means ± SEM (n = 3). One-way ANOVA with Dunnett’s multiple comparisons test was used to compare expression of A503S-FLAG to all other conditions. ****p<0.0001; NS, not significant. αSyn-GFP expression relative to PGK was quantified for each strain (bottom). One-way ANOVA with Dunnett’s multiple comparisons test was used to compare αSyn-GFP levels in strains coexpressing A503S-FLAG to all other conditions. *p<0.05; NS, not significant. (F) Neither ClpB nor ClpGGI cause temperature-dependent toxicity when expressed in yeast. (G) Δhsp104 yeast carrying a plasmid encoding empty vector or the indicated Hsp104 homolog were pre-treated at 37°C for 30 min, treated at 50°C for 0–60 min, and plated. Surviving colonies were quantified after 2d recovery. Values represent means ± SEM (n = 3 independent transformations).
Figure 3.
Figure 3.. Hsp104 homologs reduce TDP-43 aggregation in HEK293T cells.
(A) HEK293T cells were cotransfected with doxycycline-inducible constructs encoding mClover3-TDP-43ΔNLS. Protein expression was induced with 1 µg/ml doxycycline 6 hr post-transfection. At varying times, cells were sorted by FACS into populations lacking TDP-43 foci (P7) or cells with TDP-43 foci (P4). Representative fluorescent microscopy of sorted cells is shown at right. Scale bar, 500 µm. (B) At days 1 and 2 post-transfection, cells were processed for Western blot to confirm Hsp104-FLAG expression and mClover3-TDP-43ΔNLS (detected with a GFP antibody) expression. Tubulin is used as a loading control. Molecular weight markers are indicated (right). (C) Expression of the indicated Hsp104-FLAG relative to tubulin was quantified for each condition at day 1 (left) and day 2 (right) post-transfection. Values are means ± SEM (n = 3). One-way ANOVA with Dunnett’s multiple comparisons test was used to compare expression of DPLA:DWB to all other conditions. *p<0.01; ***p<0.001. (D) mClover3-TDP43ΔNLS expression relative to tubulin was quantified for each condition at day 1 (left) and day 2 (right) post-transfection. Values are means ± SEM (n = 3). One-way ANOVA with Dunnett’s multiple comparisons test was used to compare mClover3-TDP43ΔNLS levels in cells expressing no Hsp104 to all other conditions. *p<0.05. (E) At day 1 post-transfection, cells were analyzed by flow cytometry to quantify cells bearing TDP-43 aggregates (E, left). Cells were also analyzed by flow cytometry at day 2 post-transfection (E, right) Values are means ± SEM (n = 3 independent transfections with 10,000 cells counted per trial). One-way ANOVA with Tukey’s multiple comparisons test was used to compare no Hsp104 (#) and DPLA:DWB (*) to all other conditions, and to each other. ###/***p<0.001; ####/****p<0.0001; NS, not significant.
Figure 3—figure supplement 1.
Figure 3—figure supplement 1.. Pulse-shape plots for HEK293T TDP-43ΔNLS co-transfection experiments.
HEK293T cells were cotransfected with doxycycline-inducible constructs encoding mClover3-TDP-43ΔNLS. Protein expression was induced with 1 µg/ml doxycycline 6 hr post-transfection. At varying times, cells were sorted by FACS. Flow cytometry plots for each co-transfection experiment are shown. Each condition (no Hsp104, DPLA:DWB, ScHsp104, A530S, PeHsp104, and SrHsp104) is shown in three replicates (R1–R3) on day 1 (upper panels) and day 2 (lower panels). In each plot, the x-axis shows the pulse height and y-axis the pulse width. A small separate population of cells with low width and high height is observed in the bottom right of most plots representing the group of cells where the measured fluorophore is aggregated.
Figure 4.
Figure 4.. Hsp104 homologs protect against αSyn-mediated dopaminergic neurodegeneration in C. elegans.
(A) qRT-PCR for the expression of αSyn and various Hsp104 homologs in transgenic C. elegans. αSyn expression was normalized to transgenic worms expressing αSyn alone. Values represent means ± SEM (N = 100 worms per transgenic line, three independent transgenic lines examined for each genotype). The expression of αSyn among all genotypes was not significantly different, as assessed by one-way ANOVA with Dunnett’s multiple comparisons test to compare αSyn alone to all other conditions. (B) qRT-PCR for the expression of various Hsp104 homologs in transgenic C. elegans. Hsp104 expression was normalized to transgenic worms expressing both αSyn and TtHsp104 (Tt). Values represent means ± SEM (N = 100 worms per transgenic line, three independent transgenic lines examined for each genotype). One-way ANOVA with Dunnett’s multiple comparisons test was used to compare TtHsp104 to all other conditions. **p<0.01; NS, not significant. (C) αSyn and the indicated Hsp104 homolog were coexpressed in the dopaminergic (DA) neurons of C. elegans. Hermaphrodite nematodes have six anterior DA neurons, which were scored at day seven posthatching. Worms are considered WT if they have all six anterior DA neurons intact (see methods for more details). TtHsp104 and TlHsp104 significantly protect dopaminergic neurons compared to αSyn alone. Values represent means ± SEM (n = 30 worms per genotype per replicate, three independent replicates). One-way ANOVA with Dunnett’s multiple comparisons test was used to compare αSyn alone to all other conditions. *p<0.05. (D) Photomicrographs of the anterior region of C. elegans coexpressing GFP with αSyn. Worms expressing αSyn alone (left) exhibit an age-dependent loss of DA neurons. Worms expressing αSyn plus either Tt (middle) or Tl (right) exhibit greater neuronal integrity. Arrows indicate degenerating or missing neurons. Arrowheads indicate normal neurons. Scale bar, 10 µm.
Figure 4—figure supplement 1.
Figure 4—figure supplement 1.. Hsp104 homologs are not intrinsically toxic to C. elegans DA neurons.
(A) qRT-PCR for the expression of CtHsp104 in transgenic C. elegans. Hsp104 expression was normalized to transgenic worms expressing both αSyn and CtHsp104 (αSyn+Ct). Values represent means ± SEM (N = 100 worms per transgenic line, three independent transgenic lines examined for each genotype). One-way ANOVA was used to compare Hsp104 homologs. NS, not significant. (B) Hsp104 homologs were expressed in the dopaminergic (DA) neurons of C. elegans. Hermaphrodite nematodes have six anterior DA neurons, which were scored at day seven post-hatching. Worms are considered WT if they have all six anterior DA neurons intact (see methods for more details). Hsp104 homologs are not intrinsically toxic to C. elegans DA neurons. Values represent means ± SEM (n = 30 worms per genotype per replicate, three independent replicates). One-way ANOVA was used to compare worms expressing either no Hsp104 or Ct, Tt, or Tl. NS, not significant.
Figure 4—figure supplement 2.
Figure 4—figure supplement 2.. CtHsp104 does not protect C. elegans DA neurons from αSyn-mediated degeneration.
(A) qRT-PCR for the expression of αSyn in transgenic C. elegans. αSyn expression was normalized to transgenic worms expressing αSyn alone. Values represent means ± SEM (N = 100 worms per transgenic line, three independent transgenic lines examined for each genotype). The expression of αSyn between genotypes was not significantly different (unpaired t test, p>0.05). (B) qRT-PCR for the expression of CtHsp104 in transgenic C. elegans. Hsp104 expression was normalized to transgenic worms expressing both αSyn and TtHsp104 (Tt). Values represent means ± SEM (N = 100 worms per transgenic line, three independent transgenic lines examined for each genotype). An unpaired t test was used to compare TtHsp104 to all other conditions. *p<0.05. (C) αSyn and CtHsp104 were coexpressed in the dopaminergic (DA) neurons of C. elegans. Hermaphrodite nematodes have six anterior DA neurons, which were scored at day seven posthatching. Worms are considered WT if they have all six anterior DA neurons intact (see methods for more details). CtHsp104 does not significantly protect over αSyn alone. Values represent means ± SEM (n = 30 worms per genotype per replicate, three independent replicates). An unpaired t test was used to compare αSyn alone to CtHsp104. NS, not significant. (D) Photomicrograph of the anterior region of C. elegans coexpressing GFP, αSyn, and CtHsp104. Arrows indicate degenerating or missing neurons. Arrowheads indicate normal neurons. Scale bar, 10 µm.
Figure 4—figure supplement 3.
Figure 4—figure supplement 3.. CtHsp104 does not inhibit TDP-43 condensation in human cells.
(A) At days 1 and 2 post-transfection, cells were processed for Western blot to confirm Hsp104-FLAG expression and mClover3-TDP-43ΔNLS expression (detected with a GFP antibody). Tubulin is used as a loading control. Molecular weight markers are indicated (right). (B) Expression of the indicated Hsp104-FLAG relative to tubulin was quantified for each condition. Values are means ± SEM (n = 3). Two-way ANOVA with Dunnett’s multiple comparisons test was used to compare expression of DPLA:DWB to all other conditions. *p<0.05; **p<0.01. (C) mClover3-TDP43ΔNLS expression relative to tubulin was quantified for each condition. Values are means ± SEM (n = 3). Two-way ANOVA with Dunnett’s multiple comparisons test was used to compare mClover3-TDP43ΔNLS levels in cells expressing no Hsp104 to all other conditions. **p<0.01. (D) At day 1 post-transfection, cells were analyzed by flow cytometry to quantify cells bearing TDP-43 aggregates (D, left). Cells were also analyzed by flow cytometry at day 2 post-transfection (D, right) Values are means ± SEM (n = 3 independent transfections with 10,000 cells counted per trial). One-way ANOVA with Tukey’s multiple comparisons test was used to compare no Hsp104 (#) and DPLA:DWB (*) to all other conditions, and to each other. ####/ ****p<0.0001.
Figure 5.
Figure 5.. Hsp104 homologs function in induced thermotolerance but differences in thermotolerance activity do not explain suppression of TDP-43 or αSyn toxicity.
(A) WT or Δhsp104 yeast carrying a plasmid encoding the indicated Hsp104 homolog under the control of the native HSP104 promoter (except for TtHsp104, which was expressed from pGAL-see Materials and Methods) were pre-treated at 37°C for 30 min, treated at 50°C for 0–60 min, and plated. Surviving colonies were quantified after 2d recovery. Values represent means ± SEM (n = 3 independent transformations). (B) Hsp104 homologs ranked by thermotolerance performance after a 20 min heat shock at 50°C. (C) Survival after 20 min heat shock does not correlate with the evolutionary separation between a given species and S. cerevisiae. (D) Thermotolerance activity of Hsp104 homologs that suppress TDP-43 or αSyn toxicity ('Rescuers') does not noticeably differ from Hsp104 homologs that do not suppress TDP-43 or αSyn toxicity ('Non-rescuers'). (E) Expression of Hsp104 and Hsp26 before (uninduced) or after pretreatment at 37°C for 30 min (induced) was assessed by Western blot. Molecular weight markers are indicated (right). PGK serves as a loading control. An ScHsp104-specific antibody was used to detect untagged ScHsp104 or ScHsp104-FLAG. A FLAG antibody was used to detect Hsp104-FLAG. (F) Expression of Hsp26 relative to PGK was quantified for each strain. Values are means ± SEM (n = 3). One-way ANOVA with Dunnett’s multiple comparisons test was used to compare expression of Hsp26 in the WT, induced strain to all other conditions. **p<0.01. (G) Expression of Hsp104-FLAG relative to PGK was quantified for each strain. Values are means ± SEM (n = 3). One-way ANOVA with Dunnett’s multiple comparisons test was used to compare expression of ScHsp104-FLAG (Sc) to all other conditions. *p<0.05; **p<0.01; ***p<0.001. (H) Hsp104-FLAG expression is a weak predictor of yeast survival after 20 min heat shock. Values represent means ± SEM (n = 3). A simple linear regression yielded a coefficient of determination, R2 = 0.24.
Figure 5—figure supplement 1.
Figure 5—figure supplement 1.. Biochemical comparison of wild-type ScHsp104 to the potentiated variant ScHsp104A503S.
(A) ATPase activity of the indicated Hsp104 variant. Values represent means ± SEM (n = 3). (B) Luciferase aggregates (50 nM) were incubated without or with the indicated Hsp104 variant (0.167 µM hexamer) for 90 min at 25°C. Values represent means ± SEM (n = 3). (C) Luciferase aggregates (50 nM) were incubated without or with the indicated Hsp104 (0.167 µM hexamer) in the presence of Ssa1 (0.167 µM), Ydj1 (0.073 µM), and Sis1 (0.073 µM) for 90 min at 25°C. Values represent means ± SEM (n = 3).
Figure 6.
Figure 6.. Hsp104 homologs are disaggregases in vitro but differences in disaggregase activity do not explain suppression of TDP-43 or αSyn toxicity.
(A) ATPase activity of the indicated Hsp104 homologs at different temperatures. Values represent means ± SEM (n = 3). (B) Luciferase aggregates (50 nM) were incubated with the indicated Hsp104 (0.167 µM hexamer) with or without 0.167 µM Ssa1, 0.073 µM Ydj1, and 0.073 µM Sis1 for 90 min at 25°C. Values represent means ± SEM (n = 3). (C) Luciferase aggregates were treated as in (B) but Ssa1, Ydj1, and Sis1 were replaced with Hsc70, Hdj1, and Hdj2. Values represent means ± SEM (n = 3). (D) TDP-43 (3 µM) was incubated in the presence of the indicated Hsp104 (6 µM) and 5 mM ATP, and turbidity was measured at 3 hr relative to TDP-43 aggregation reactions containing no Hsp104. Values represent means ± SEM (n = 3). One-way ANOVA with Dunnett’s multiple comparisons test was used to compare TDP-43 alone to all other conditions. NS, not significant; **p<0.01; ***p<0.001. (E) As in (D), except ATP was omitted and turbidity was measured at 2 hr. Values represent means ± SEM (n = 3). One-way ANOVA with Dunnett’s multiple comparisons test was used to compare TDP-43 alone to all other conditions. *p<0.05; ****p<0.0001; ***p<0.001.
Figure 6—figure supplement 1.
Figure 6—figure supplement 1.. Hsp104 homologs form hexamers.
(A–D) Size-exclusion chromatography coupled to multiangle light scattering (SEC-MALS) demonstrates that Hsp104 homologs form hexamers. In each panel, traces represent relative protein concentration determined by relative absorbance at 280 nm (A280) and plotted squares represent molecular weight readings determined by multiangle light scattering. (E) Comparison of theoretical molecular weights for Hsp104 hexamers to molecular weights observed by SEC-MALS.
Figure 6—figure supplement 2.
Figure 6—figure supplement 2.. Hsp104 homologs remodel SEVI fibrils.
(A) SEVI fibrils (20 µM monomer) were incubated with buffer (untreated) or the indicated Hsp104 homolog (3 µM) for 0–24 hr. Fibril integrity was assessed by ThT fluorescence. Values represent means ± SEM (n = 3). (B) Representative EM images of SEVI fibrils incubated with buffer (untreated) or the indicated Hsp104 homolog (3 µM) for 3 hr. Scale bar is indicated (bottom right of gallery).
Figure 6—figure supplement 3.
Figure 6—figure supplement 3.. Hsp104 homologs do not affect MBP-TEV-TDP43 cleavage by TEV protease.
Western blot of MBP-TEV-TDP43 incubated either alone or with the indicated combination of TEV protease, Hsp104 homolog, and ATP. Molecular weight markers are indicated (right).
Figure 7.
Figure 7.. Hsp104 homologs can suppress toxicity of TDP-43 and αSyn in a manner that does not require conserved AAA+ motifs.
(A) WebLogo sequence logos demonstrating high conservation of Walker A, tyrosine-bearing pore loops, and Walker B motifs in both NBD1 and NBD2 across all Hsp104 homologs. (B–J) Spotting assays to define how mutations affect the ability of Hsp104 variants to suppress TDP-43 or αSyn toxicity. Within each panel, distinct yeast strains are spotted in rows and are labeled by the type of Hsp104 being expressed in each instance (Δhsp104, no Hsp104 being expressed; WT, Hsp104 variant with no additional mutations; ΔN, Hsp104 variant lacking an NTD; DWA(KA) and DWA(KT), Hsp104 variant with the indicated substitutions in the Walker A motifs; DPLA, Hsp104 variant with pore-loop tyrosines mutated to alanine; DWB(EA) and DWB(EQ), Hsp104 variant with the indicated substitutions in the Walker B motifs). (B) Spotting assay demonstrating that Hsp104A503S (A503S)-mediated suppression of TDP-43 (left) and αSyn (right) toxicity is inhibited by NTD deletion (ΔN) and mutations in Walker A (DWA(KA) and DWA(KT)), pore loop (DPLA), and Walker B (DWB(EA) and DWB(EQ)) motifs. (C) Spotting assay demonstrating that GsHsp104 (Gs)-mediated suppression of TDP-43 toxicity is resistant to NTD deletion (ΔN) as well as mutations in Walker A (DWA(KA) and DWA(KT)), pore loop (DPLA), and Walker B (DWB(EA) and DWB(EQ)) motifs. (D) Spotting assay demonstrating that MbHsp104 (Mb)-mediated suppression of TDP-43 toxicity is ablated by NTD deletion (ΔN) but is resistant to mutations in Walker A (DWA(KA) and DWA(KT)), pore loop (DPLA), and Walker B (DWB(EA) and DWB(EQ)) motifs. (E) Spotting assay demonstrating that CrHsp104 (Cr)-mediated suppression of TDP-43 toxicity is ablated by NTD deletion (ΔN) and mutations in Walker B (DWB(EA) and DWB(EQ)) motifs but is resistant to mutations in Walker A (DWA(KA) and DWA(KT)) and pore loop (DPLA) motifs. (F) Spotting assay demonstrating that PeHsp104 (Pe)-mediated suppression of TDP-43 toxicity is resistant to NTD deletion (ΔN) and mutations in pore loop (DPLA) motifs, but is partially sensitive to mutations in Walker A (i.e. suppression is ablated by DWA(KA) but not DWA(KT)) and Walker B (i.e. suppression is ablated by DWB(EA) but not DWB(EQ)) motifs. (G) Spotting assay demonstrating that SrHsp104 (Sr)-mediated suppression of TDP-43 is resistant to NTD deletion (ΔN) as well as mutations in Walker A (DWA(KA) and DWA(KT)), pore loop (DPLA), and Walker B (DWB(EA) and DWB(EQ)) motifs. (H) Spotting assay demonstrating that CtHsp104 (Ct)-mediated suppression of αSyn toxicity is resistant to NTD deletion (ΔN) as well as mutations in Walker A (DWA(KA) and DWA(KT)), pore loop (DPLA), and Walker B (DWB(EA) and DWB(EQ)) motifs. (I) Spotting assay demonstrating that TtHsp104 (Tt)-mediated suppression of αSyn toxicity is ablated by NTD deletion (ΔN) but is resistant to mutations in Walker A (DWA(KA) and DWA(KT)), pore loop (DPLA), and Walker B (DWB(EA) and DWB(EQ)) motifs. (J) Spotting assay demonstrating that TlHsp104 (Tl)-mediated suppression of αSyn toxicity is resistant to NTD deletion (ΔN) as well as mutations in Walker A (DWA(KA) and DWA(KT)), pore loop (DPLA), and Walker B (DWB(EA) and DWB(EQ)) motifs.
Figure 7—figure supplement 1.
Figure 7—figure supplement 1.. Hsp104 mutants are consistently expressed and are defective in thermotolerance.
(A–H) Western blots show consistent expression of all FLAG-tagged Hsp104 homologs and mutants, both from pGAL and pHSP104. The blots on the left are induced with galactose and on the right are induced by incubation for 30 min at 37°C (see Materials and Methods). GFP detects αSyn-GFP, and PGK is used as a loading control. Molecular weight markers are indicated (right). (I) Survival of yeast expressing GsHsp104, MbHsp104, CrHsp104, PeHsp104, SrHsp104, CtHsp104, TtHsp104, TlHsp104, or the indicated chimera was assessed following 20 min heat shock at 50°C. Values represent means ± SEM (n = 3 independent transformations). Top dashed line indicates average survival of strains expressing wild-type Hsp104 homolog, while bottom dashed line indicates average survival of Δhsp104 cells. (J) Luciferase aggregates (50 nM) were incubated with the indicated CtHsp104 variant (0.167 µM hexamer), Ssa1 (0.167 µM), Ydj1 (0.073 µM), and Sis1 (0.073 µM) for 90 min at 25°C. Values represent means ± SEM (n = 3). One-way ANOVA with Dunnett’s multiple comparisons test was used to compare WT CtHsp104 to all other conditions. ****p<0.0001.
Figure 8.
Figure 8.. Interactions between the NTD, NBD1, and MD support TDP-43 toxicity suppression by Hsp104 homologs.
(A) Color codes and domain boundaries and labels of Hsp104 homologs. (B) Spotting assay of Δhsp104 yeast coexpressing TDP-43 and the indicated chimeric Hsp104s between ScHsp104 and MbHsp104 illustrates that chimeras possessing the NTD, NBD1, and MD from MbHsp104 copy the TDP-43 toxicity-suppression phenotype of MbHsp104. (C) Spotting assay of Δhsp104 yeast coexpressing TDP-43 and the indicated chimeric Hsp104 between ScHsp104 and CrHsp104 illustrates that chimeras possessing the NTD, NBD1, and MD from CrHsp104 copy the TDP-43 toxicity-suppression phenotype of CrHsp104. (D) Spotting assay of Δhsp104 yeast coexpressing TDP-43 and the indicated chimeric Hsp104 between ScHsp104 and GsHsp104 illustrates that chimeras possessing the NTD, NBD1, and MD from GsHsp104 copy the TDP-43 toxicity-suppression phenotype of GsHsp104. (E) Spotting assay of Δhsp104 yeast coexpressing TDP-43 and the indicated chimeric Hsp104 between ScHsp104 and PeHsp104 illustrates that chimeras possessing the NTD, NBD1, and MD from PeHsp104 copy the TDP-43 toxicity-suppression phenotype of PeHsp104. (F) Spotting assay of Δhsp104 yeast coexpressing TDP-43 and the indicated chimeric Hsp104 between ScHsp104 and SrHsp104 illustrates that chimeras possessing the NTD, NBD1, and MD from SrHsp104 copy the TDP-43 toxicity-suppression phenotype of SrHsp104. (G) Spotting assay of Δhsp104 strains coexpressing TDP-43 and either full-length PeHsp104 or SrHsp104, or monomeric fragments derived from these homologs demonstrates that Hsp104-mediated toxicity suppression is an emergent property of hexameric Hsp104.
Figure 8—figure supplement 1.
Figure 8—figure supplement 1.. Chimeric Hsp104s and proteotoxic substrates are consistently expressed in yeast.
(A) Color code of Hsp104 homologs, and schematic of Hsp104 domain organization. (B–K) Western blots show that chimeras between ScHsp104 and GsHsp104 (B), MbHsp104 (C), CrHsp104 (D), PeHsp104 (E), SrHsp104 (F), CtHsp104 (G), TtHsp104 (H,J) and TlHsp104 (I,K) are expressed consistently (the plasmid used for Hsp104 expression is indicated above each set of blots—see Materials and Methods) and at a level comparable to wild-type protein. TDP-43 (B–F) and αSyn (G–K) are expressed consistently in all strains. GFP detects αSyn-GFP, and PGK is used as a loading control. Molecular weight markers are indicated at right of each panel. (L) Western blot showing expression of PeHsp104, SrHsp104, or fragments derived from these homologs in TDP-43-expressing yeast. PGK is used as a loading control. Molecular weight markers are indicated at the right of the panel.
Figure 8—figure supplement 2.
Figure 8—figure supplement 2.. Characterization of Hsp104 chimera specificity for TDP-43.
(A) Spotting assay of Δhsp104 strains coexpressing αSyn and the indicated chimeras between ScHsp104 and GsHsp104 shows that none of these chimeras suppress αSyn toxicity. (B) Spotting assay of Δhsp104 strains coexpressing αSyn and the indicated chimeras between ScHsp104 and MbHsp104 shows that none of these chimeras suppress αSyn toxicity. (C) Spotting assay of Δhsp104 strains coexpressing αSyn and the indicated chimeras between ScHsp104 and CrHsp104 shows that none of these chimeras suppress αSyn toxicity. (D) Spotting assay of Δhsp104 strains coexpressing αSyn and the indicated chimeras between ScHsp104 and PeHsp104 shows that a chimera possessing the NTD and NBD1 from PeHsp104 suppresses αSyn toxicity. (E) Spotting assay of Δhsp104 strains coexpressing αSyn and the indicated chimeras between ScHsp104 and SrHsp104 shows that none of these chimeras suppress αSyn toxicity.
Figure 8—figure supplement 3.
Figure 8—figure supplement 3.. Characterization of the intrinsic toxicity of Hsp104 chimeras.
(A–E) Strains expressing chimeras between ScHsp104 and GsHsp104 (A), MbHsp104 (B), CrHsp104 (C), PeHsp104 (D), and SrHsp104 (E) were spotted onto glucose and galactose media, and incubated at 37°C for 2–3 days to observe growth. In several cases (panels A, C, D, and E) chimeras possessing non-cognate NTD:NBD1 units displayed toxicity (boxed in red).
Figure 9.
Figure 9.. The NBD2:CTD unit of TtHsp104 and TlHsp104 contribute to suppression of αSyn toxicity.
(A) Color codes and domain boundaries and labels of Hsp104 homologs. (B) Spotting assay of Δhsp104 strains coexpressing αSyn and the indicated chimeric Hsp104 between ScHsp104 and TtHsp104 illustrates that no chimeras between ScHsp104 and TtHsp104 replicate the αSyn toxicity-suppressing phenotype of TtHsp104. (C) Spotting assay of Δhsp104 strains coexpressing αSyn and the indicated chimeric Hsp104 between ScHsp104 and TlHsp104 illustrates that no chimeras between ScHsp104 and TlHsp104 replicate the αSyn toxicity-suppressing phenotype of TlHsp104. (D, E) Spotting assays of Δhsp104 strains coexpressing the indicated chimeric Hsp104 and αSyn illustrates that the NBD2:CTD unit from TtHsp104 (D) or TlHsp104 (E) is not sufficient to copy the αSyn toxicity-suppression phenotype of TtHsp104 or TlHsp104. (F) Spotting assay of Δhsp104 strains coexpressing the indicated chimeric Hsp104 and αSyn illustrates that chimeras possessing the NTD and NBD1 from CtHsp104 copies the αSyn toxicity-suppressing phenotype of CtHsp104WT.
Figure 9—figure supplement 1.
Figure 9—figure supplement 1.. Thermotolerance activity of Hsp104 chimeras.
Survival of yeast expressing GsHsp104, MbHsp104, CrHsp104, PeHsp104, SrHsp104, CtHsp104, TtHsp104, TlHsp104, or a chimera between one of these (as indicated by color in bar chart) and ScHsp104 was assessed following 20 min heat shock at 50°C. Values are relative to wild-type ScHsp104 (black bars) and represent means ± SEM (n = 3 independent transformations). Illustrations on x-axis indicate chimera composition. Gray indicates portions of the chimera from ScHsp104 and white indicates variable regions from other homologs. Two-way ANOVA with Tukey’s multiple comparisons test was used to compare was used to compare survival of strains expressing a given chimera to survival of strains expressing ScHsp104 (which was set to 100%). *p<0.05; **p<0.01; ***p<0.001; ****p<0.0001; NS, not significant.
Figure 9—figure supplement 2.
Figure 9—figure supplement 2.. Toxicity of select chimeras between CtHsp104 and ScHsp104.
(A–C) Strains expressing chimeras between ScHsp104 and CtHsp104 (A), TtHsp104 (B), and TlHsp104 (C) were spotted onto glucose and galactose media, and incubated at 37°C for 2–3 days to observe growth. In panel A, chimeras possessing non-cognate NTD:NBD1 units displayed toxicity (boxed in red).

Similar articles

Cited by

References

    1. Alberti S, Gitler AD, Lindquist S. A suite of gateway cloning vectors for high-throughput genetic analysis in Saccharomyces cerevisiae. Yeast. 2007;24:913–919. doi: 10.1002/yea.1502. - DOI - PMC - PubMed
    1. Araki K, Yagi N, Aoyama K, Choong CJ, Hayakawa H, Fujimura H, Nagai Y, Goto Y, Mochizuki H. Parkinson's disease is a type of amyloidosis featuring accumulation of amyloid fibrils of α-synuclein. PNAS. 2019;116:17963–17969. doi: 10.1073/pnas.1906124116. - DOI - PMC - PubMed
    1. Armakola M, Higgins MJ, Figley MD, Barmada SJ, Scarborough EA, Diaz Z, Fang X, Shorter J, Krogan NJ, Finkbeiner S, Farese RV, Gitler AD. Inhibition of RNA lariat debranching enzyme suppresses TDP-43 toxicity in ALS disease models. Nature Genetics. 2012;44:1302–1309. doi: 10.1038/ng.2434. - DOI - PMC - PubMed
    1. Avellaneda MJ, Franke KB, Sunderlikova V, Bukau B, Mogk A, Tans SJ. Processive extrusion of polypeptide loops by a Hsp100 disaggregase. Nature. 2020;578:317–320. doi: 10.1038/s41586-020-1964-y. - DOI - PubMed
    1. Bao YP, Cook LJ, O'Donovan D, Uyama E, Rubinsztein DC. Mammalian, yeast, bacterial, and chemical chaperones reduce aggregate formation and death in a cell model of oculopharyngeal muscular dystrophy. Journal of Biological Chemistry. 2002;277:12263–12269. doi: 10.1074/jbc.M109633200. - DOI - PubMed

Publication types

MeSH terms