Feedback inhibition of AMT1 NH4+-transporters mediated by CIPK15 kinase
- PMID: 33317525
- PMCID: PMC7737296
- DOI: 10.1186/s12915-020-00934-w
Feedback inhibition of AMT1 NH4+-transporters mediated by CIPK15 kinase
Abstract
Background: Ammonium (NH4+), a key nitrogen form, becomes toxic when it accumulates to high levels. Ammonium transporters (AMTs) are the key transporters responsible for NH4+ uptake. AMT activity is under allosteric feedback control, mediated by phosphorylation of a threonine in the cytosolic C-terminus (CCT). However, the kinases responsible for the NH4+-triggered phosphorylation remain unknown.
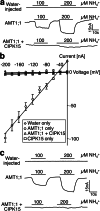
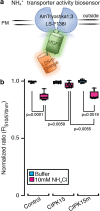
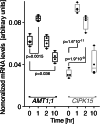
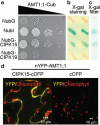
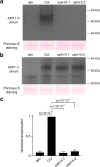
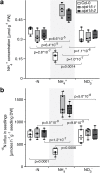
Results: In this study, a functional screen identified protein kinase CBL-Interacting Protein Kinase15 (CIPK15) as a negative regulator of AMT1;1 activity. CIPK15 was able to interact with several AMT1 paralogs at the plasma membrane. Analysis of AmTryoshka, an NH4+ transporter activity sensor for AMT1;3 in yeast, and a two-electrode-voltage-clamp (TEVC) of AMT1;1 in Xenopus oocytes showed that CIPK15 inhibits AMT activity. CIPK15 transcript levels increased when seedlings were exposed to elevated NH4+ levels. Notably, cipk15 knockout mutants showed higher 15NH4+ uptake and accumulated higher amounts of NH4+ compared to the wild-type. Consistently, cipk15 was hypersensitive to both NH4+ and methylammonium but not nitrate (NO3-).
Conclusion: Taken together, our data indicate that feedback inhibition of AMT1 activity is mediated by the protein kinase CIPK15 via phosphorylation of residues in the CCT to reduce NH4+-accumulation.
Keywords: Ammonium; Arabidopsis thaliana; Phosphorylation; Protein kinase; Transporter.
Conflict of interest statement
The authors declare no competing interests.
Figures

Similar articles
-
CIPK15-mediated inhibition of NH4+ transport protects Arabidopsis from submergence.Heliyon. 2023 Sep 15;9(9):e20235. doi: 10.1016/j.heliyon.2023.e20235. eCollection 2023 Sep. Heliyon. 2023. PMID: 37810036 Free PMC article.
-
The Kinase CIPK23 Inhibits Ammonium Transport in Arabidopsis thaliana.Plant Cell. 2017 Feb;29(2):409-422. doi: 10.1105/tpc.16.00806. Epub 2017 Feb 10. Plant Cell. 2017. PMID: 28188265 Free PMC article.
-
CALCIUM-DEPENDENT PROTEIN KINASE 32-mediated phosphorylation is essential for the ammonium transport activity of AMT1;1 in Arabidopsis roots.J Exp Bot. 2020 Aug 6;71(16):5087-5097. doi: 10.1093/jxb/eraa249. J Exp Bot. 2020. PMID: 32443150
-
Function and Regulation of Ammonium Transporters in Plants.Int J Mol Sci. 2020 May 18;21(10):3557. doi: 10.3390/ijms21103557. Int J Mol Sci. 2020. PMID: 32443561 Free PMC article. Review.
-
Switching substrate specificity of AMT/MEP/ Rh proteins.Channels (Austin). 2014;8(6):496-502. doi: 10.4161/19336950.2014.967618. Channels (Austin). 2014. PMID: 25483282 Free PMC article. Review.
Cited by
-
The Root-Colonizing Endophyte Piriformospora indica Supports Nitrogen-Starved Arabidopsis thaliana Seedlings with Nitrogen Metabolites.Int J Mol Sci. 2023 Oct 19;24(20):15372. doi: 10.3390/ijms242015372. Int J Mol Sci. 2023. PMID: 37895051 Free PMC article.
-
Role of protein phosphatases in the regulation of nitrogen nutrition in plants.Physiol Mol Biol Plants. 2021 Dec;27(12):2911-2922. doi: 10.1007/s12298-021-01115-x. Epub 2021 Dec 24. Physiol Mol Biol Plants. 2021. PMID: 35035144 Free PMC article. Review.
-
The Ca2+-Regulated Protein Kinase CIPK1 Modulates Plant Response to Nitrate Deficiency in Arabidopsis.Genes (Basel). 2024 Sep 23;15(9):1235. doi: 10.3390/genes15091235. Genes (Basel). 2024. PMID: 39336826 Free PMC article.
-
Effect of ammonium stress on phosphorus solubilization of a novel marine mangrove microorganism Bacillus aryabhattai NM1-A2 as revealed by integrated omics analysis.BMC Genomics. 2023 Sep 18;24(1):550. doi: 10.1186/s12864-023-09559-z. BMC Genomics. 2023. PMID: 37723472 Free PMC article.
-
Calcium signaling in plant mineral nutrition: From uptake to transport.Plant Commun. 2023 Nov 13;4(6):100678. doi: 10.1016/j.xplc.2023.100678. Epub 2023 Aug 26. Plant Commun. 2023. PMID: 37635354 Free PMC article. Review.
References
-
- Marschner H. Mineral nutrition of higher plants. London: Academic Press, Harcourt Brace & Co; 1996.
-
- Glass ADM, Siddiqi MY. Nitrogen absorption by plant roots. In: Srivastava HS, Singh RP, editors. Nitrogen nutrition in higher plants. New Delhi: Associated Publishing Co; 1995. pp. 21–56.
Publication types
MeSH terms
Substances
Grants and funding
- 105-2311-B-001-045/Ministry of Science and Technology, Taiwan/International
- 106-2311-B-001-037-MY3/Ministry of Science and Technology, Taiwan/International
- EXC-2048/1 - project ID 390686111/Deutsche Forschungsgemeinschaft/International
- 1208 - Project-ID 267205415/Deutsche Forschungsgemeinschaft/International
- Alexander von Humboldt Professorship/Alexander von Humboldt-Stiftung/International
LinkOut - more resources
Full Text Sources
Molecular Biology Databases
Miscellaneous

