. 2021 May;15(5):1412-1431.
doi: 10.1002/1878-0261.12877. Epub 2021 Feb 13.

Downregulation of Glutamine Synthetase, not glutaminolysis, is responsible for glutamine addiction in Notch1-driven acute lymphoblastic leukemia

Affiliations

Downregulation of Glutamine Synthetase, not glutaminolysis, is responsible for glutamine addiction in Notch1-driven acute lymphoblastic leukemia

Tra Ly Nguyen et al. Mol Oncol. 2021 May.

Abstract

The cellular receptor Notch1 is a central regulator of T-cell development, and as a consequence, Notch1 pathway appears upregulated in > 65% of the cases of T-cell acute lymphoblastic leukemia (T-ALL). However, strategies targeting Notch1 signaling render only modest results in the clinic due to treatment resistance and severe side effects. While many investigations reported the different aspects of tumor cell growth and leukemia progression controlled by Notch1, less is known regarding the modifications of cellular metabolism induced by Notch1 upregulation in T-ALL. Previously, glutaminolysis inhibition has been proposed to synergize with anti-Notch therapies in T-ALL models. In this work, we report that Notch1 upregulation in T-ALL induced a change in the metabolism of the important amino acid glutamine, preventing glutamine synthesis through the downregulation of glutamine synthetase (GS). Downregulation of GS was responsible for glutamine addiction in Notch1-driven T-ALL both in vitro and in vivo. Our results also confirmed an increase in glutaminolysis mediated by Notch1. Increased glutaminolysis resulted in the activation of the mammalian target of rapamycin complex 1 (mTORC1) pathway, a central controller of cell growth. However, glutaminolysis did not play any role in Notch1-induced glutamine addiction. Finally, the combined treatment targeting mTORC1 and limiting glutamine availability had a synergistic effect to induce apoptosis and to prevent Notch1-driven leukemia progression. Our results placed glutamine limitation and mTORC1 inhibition as a potential therapy against Notch1-driven leukemia.

Keywords: Notch1; T-cell acute lymphoblastic leukemia; glutamine; glutamine synthetase; mTORC1; metabolic addiction.


Conflict of interest statement

The authors declare no conflict of interest.

Figures
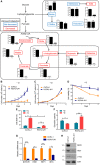
Fig. 1
Fig. 1
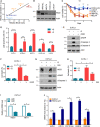
Glutamine sustains TCA cycle in T‐ALL cells. (A) Targeted metabolomic analysis of H33HJ‐JA1 cells incubated either in the presence (+Q) or the absence (−Q) of glutamine for 24 h. The concentration of metabolites belonging to glutaminolysis, TCA cycle, or glycolysis was analyzed by mass spectrometry. Unchanged metabolites are highlighted in blue; metabolites which concentration decreased in the absence of glutamine are highlighted in red. Graphs show mean values ± SEM (n = 3). (B‐C) Growing curves of CUTLL1 and H33HJ‐JA1 cells incubated in the absence (B) or presence (C) of glutamine for the indicated times. Cell concentration was determined using a cell counter. (D) CUTLL1 and H33HJ‐JA1 cells were incubated in the absence of glutamine for the indicated times. Then, cell viability was estimated using a trypan blue assay. (E) Cell death of CUTLL1 and H33HJ‐JA1 cells incubated either in the presence (+Q) or absence (−Q) of glutamine during 72 h. Cell death was estimated using a trypan blue assay. (F) Glycolytic capacity of CUTLL1 and H33HJ‐JA1 cells incubated in the presence (+Q) or absence (−Q) of glutamine during 72 h. Glycolytic capacity was determined using Seahorse® technology as described in Methods section. (G) Relative mRNA levels of NOTCH1, HES1, HEY1, and MYC in CUTLL1 and H33HJ‐JA1 cells incubated in the presence of glutamine. (H) Western blot analysis of the protein levels of NICD, Hes1, c‐myc, and actin, in CUTLL1 and H33HJ‐JA1 cells incubated in the presence of glutamine. Graphs show mean values ± SEM (n ≥ 3, *P < 0.05; **P < 0.01; ***P < 0.001). Two‐way ANOVA followed by Bonferroni's comparison as a post hoc test was used to evaluate the statistical difference between more than two groups. t‐Test analysis was used to evaluate the statistical difference between two groups.
Fig. 2
Fig. 2
Notch1 activation correlated with glutamine addiction in T‐ALL cells. (A) The relative levels of NICD and cell death induction during glutamine restriction for 72 h were estimated for five different T‐ALL cell lines. Values were represented in the graph, and the linear regression was calculated and represented. (B) CUTLL1, HBP‐ALL, MOLT4, H33HJ‐JA1, and LOUCY cells were incubated in complete medium for 24 h. Cell extracts were collected and levels of NICD and actin were estimated by western blot. (C) CUTLL1, HBP‐ALL, MOLT4, H33HJ‐JA1, and LOUCY cells were incubated in the absence of glutamine for the indicated times and cell viability was determined using a trypan blue assay. (D) CUTLL1, HBP‐ALL, MOLT4, H33HJ‐JA1, and LOUCY cells were incubated either in the presence or the absence of glutamine (Q) during 72 h as indicated. Then, late apoptotic cell percentage was quantified through flow cytometry analysis of PI and annexin V content. (E‐F) CUTLL1 cells were incubated either in the presence or absence of glutamine (Q) and zVAD (20 µm) during 72 h as indicated. Cell extracts were collected and levels of cleaved PARP, cleaved caspase 3, cleaved caspase 8, and actin were estimated by western blot (E), while cell death was estimated using a trypan blue assay (F). (G) Western blot analysis of the apoptotic markers cleaved PARP and cleaved caspase 3 of CUTLL1 cells incubated either in the presence or the absence of glutamine (Q) and GSI (DAPT 10 µm) during 72 h as indicated. (H) Percentage of dead cells, as estimated using a trypan blue assay, of CUTLL1 cells incubated as in G. (I) CUTLL1 cells were incubated in the presence or absence of GSI (DAPT 10 µm) during 72 h in complete medium as indicated. RNA content of cells was extracted and HES1 and HEY1 mRNA level was estimated by quantitative PCR. (J) CUTLL1 and H33HJ‐JA1 cells were incubated either in the presence or absence of glutamine for 72 h as indicated. RNA content of cells was extracted, and RNA levels of ERN1, DDIT3, PPP1R15A, CEBPB, and DNAJB9 were estimated by quantitative PCR. Values represent RNA content of each gene of cells incubated in the absence of glutamine with respect to the RNA content of the same gene of cells incubated in the presence of glutamine. Graphs show mean values ± SEM (n ≥ 3, *P < 0.05). Two‐way ANOVA followed by Bonferroni's comparison as a post hoc test was used to evaluate the statistical difference between more than two groups.
Fig. 3
Fig. 3
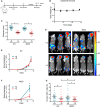
Notch1 upregulation induced glutamine addiction in T‐ALL cells. (A) RNA levels of NICD, as estimated by quantitative PCR, of EV and NICD H33HJ‐JA1 cells cultivated in complete medium. (B) Luciferase‐dependent luminescence was estimated in EV and NICD cells using a luminometer. (C) RNA content of EV and NICD cells was extracted from cells cultivated in complete medium. MYC, HES1, and HEY1 mRNA levels were estimated by quantitative PCR. (D‐E) Growing curves of EV and NICD cells incubated in the presence (D) or absence (E) of glutamine for the indicated times. Cell concentration was determined using a cell counter. (F) Cell death of EV and NICD cells incubated either in the presence (+Q) or absence (−Q) of glutamine during 72 h. Cell death was estimated using a trypan blue assay. (G) Cell viability, as estimated by trypan blue assay, of EV and NICD incubated in the absence of glutamine for the indicated time. (H) Western blot analysis of the apoptotic markers cleaved PARP and cleaved caspase 3 of EV and NICD cells incubated as in F. (I) Late apoptotic cell percentage, as quantified by flow cytometry analysis of PI and annexin V content, of EV and NICD cells incubated as in F. Graphs show mean values ± SEM (n ≥ 3, *P < 0.05). Two‐way ANOVA followed by Bonferroni's comparison as a post hoc test was used to evaluate the statistical difference between more than two groups. t‐Test analysis was used to evaluate the statistical difference between two groups.
Fig. 4
Fig. 4
Glutamine‐free diet impairs Notch1‐driven leukemia progression in vivo. (A) Schematic representation of the strategy followed for in vivo experiments. (B) Evolution of body weight of mice fed with a glutamine‐free diet for the indicated time. (C) Concentration of glutamine in the blood of mice implanted with either EV or NICD H33HJ‐JA1 cells fed under complete (+Q) or glutamine‐free (−Q) diet at the end of the treatment, as indicated. (D‐F) Representative luminescence images (D) and luminescence quantification (E‐F) of mice implanted with either EV or NICD cells fed under complete (+Q) or glutamine‐free (−Q) diet at the end of the treatment, as indicated. (G) Infiltration of leukemic human (CD3+) cells in the bone marrow of mice implanted with either EV or NICD cells, fed either in the presence or the absence of glutamine (Q). Graphs show mean values ± SEM (20 mice/group, *P < 0.05). Two‐way ANOVA followed by Bonferroni’s comparison as a post hoc test was used to evaluate the statistical difference between more than two groups.
Fig. 5
Fig. 5
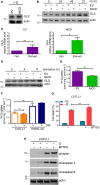
Notch1 modulated glutamine metabolizing enzymes in T‐ALL cells. (A) EV and NICD cells were incubated in a complete medium for 24 h. Cell extracts were collected and levels of GLS and actin were estimated by western blot. (B) EV and NICD cells were incubated in the absence of glutamine (−Q) for the indicated time. GLS and actin levels were determined by western blot analysis. (C) EV and NICD cells were incubated either in a complete medium (fed) or in a medium without amino acids (starved) during 72 h as indicated. Then, RNA content of these cells was extracted and GLS mRNA level was estimated by quantitative PCR. (D) EV and NICD cells were incubated in a medium without amino acids for the indicated time. Cell extracts were collected and levels of GLS and actin were estimated by western blot. (E) EV and NICD cells were incubated in the absence of glutamine and then incubated with radiolabeled 3H‐glutamine during 15 min. Cell content was extracted, and radiolabeled glutamine uptake was measured using a scintillation counter. (F) Glutamine‐starved CUTLL1 and H33HJ‐JA1 cells were incubated either in the presence or absence of GSI (DAPT 10 µm) for 72 h. Then, glutamine incorporation was determined as in E. (G‐H) CUTLL1 cells were incubated either in the presence or absence of glutamine (Q) and BPTES (30 µm) during 72 h as indicated. Cell death was estimated using a trypan blue assay (G), while cell extracts were collected and levels of cleaved PARP, cleaved caspase 3, cleaved caspase 8, and actin were estimated by western blot (H). Graphs show mean values ± SEM (n ≥ 3, *P < 0.05). Two‐way ANOVA followed by Bonferroni’s comparison as a post hoc test was used to evaluate the statistical difference between more than two groups. t‐Test analysis was used to evaluate the statistical difference between two groups.
Fig. 6
Fig. 6
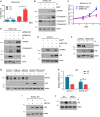
The lack of GS accumulation induced by Notch1 is responsible for glutamine addiction in Notch1‐positive T‐ALL cells. (A) Cell death, as estimated using a trypan blue assay, of H33HJ‐JA1 cells incubated either in the presence or the absence of glutamine (Q) and MSO (1 mm) during 72 h as indicated. (B) Western blot analysis of the apoptotic markers cleaved PARP, cleaved caspase 3, cleaved caspase 8, and actin of H33HJ‐JA1 cells incubated as in A. (C) Growing curves of H33HJ‐JA1 cells infected with either a plasmid expressing a control nontargeting shRNA (shRNA Control), or a plasmid expressing a shRNA against GS (shRNA GS), and incubated in the absence of glutamine for the indicated times. (D) Western blot analysis of cleaved PARP, cleaved caspase 3, GS and actin of H33HJ‐JA1 cells infected with either a plasmid expressing a control nontargeting shRNA (shRNA Control), or a plasmid expressing a shRNA against GS (shRNA GS), and incubated in the presence or absence of glutamine during 72 h as indicated. (E) Western blot analysis of cleaved PARP, GS and actin of CUTLL1 cells infected with either an empty vector plasmid (pJS27) or with a plasmid overexpressing GS (pJS27‐GS) and incubated either in the presence (+Q) or absence (−Q) of glutamine for 72 h. (F) Western blot analysis of NICD, GS and actin of CUTLL1 and H33HJ‐JA1 cells incubated either in the presence (+Q) or absence (−Q) of glutamine during 72 h as indicated. (G) CUTLL1, HBP‐ALL, MOLT4, H33HJ‐JA1, and LOUCY cells were incubated either in the presence or the absence of glutamine (Q) for 72 h. Cell extracts were collected and levels NICD, GS, and actin were estimated by western blot. (H) CUTLL1 and H33HJ‐JA1 cells were incubated either in the presence (+Q) or absence (−Q) of glutamine. RNA content was extracted and GS mRNA level was estimated by quantitative PCR. (I) H33HJ‐JA1 cells were incubated either in the presence or absence of glutamine (Q) and MG132 (5 µm) during 4 h as indicated. Cell extracts were collected and levels of GS and actin were estimated by western blot. (J) Western blot analysis of GS and actin of EV and NICD cells incubated either in the presence (+Q) or absence (−Q) of glutamine during 72 h as indicated. Graphs show mean values ± SEM (n ≥ 3, *P < 0.05). Two‐way ANOVA followed by Bonferroni's comparison as a post hoc test was used to evaluate the statistical difference between more than two groups.
Fig. 7
Fig. 7
mTORC1 inhibition synergizes with glutamine starvation to induce cell death and to prevent leukemia progression in Notch1‐positive T‐ALL. (A) Western blot analysis of phospho‐S6K, total S6K, phospho‐S6, total S6, and actin of CUTLL1 and H33HJ‐JA1 cells incubated in the absence of glutamine during 72 h as indicated. (B) Western blot analysis of phospho‐S6K, total S6K, phospho‐S6, total S6, and actin of EV and NICD cells incubated in the absence of glutamine during 72 h as indicated. (C) Western blot analysis of NICD, phospho‐S6, total S6, and actin of CUTLL1 and H33HJ‐JA1 cells incubated either in the presence or the absence of GSI (DAPT 10 µm) for 72 h as indicated. (D) Western blot analysis of phospho‐S6K, total S6K, phospho‐S6, total S6, and actin of glutamine‐starved EV and NICD cells incubated in the presence or the absence of RAP (100 nm) for 72 h as indicated. (E‐F) Cell viability, as estimated by trypan blue assay, of EV (E) and NICD (F) cells incubated either in the presence or the absence of glutamine (Q) and RAP (100 nm) for the indicated time. (G) Late apoptotic cell percentage of EV and NICD cells incubated either in the presence or in the absence of glutamine (Q) and RAP (100 nm) for 72 h. Late apoptotic cell percentage was quantified using flow cytometry analysis of 7‐AAD and annexin V content. (H) Infiltration of leukemic human (CD3 positive) cells in the bone marrow of mice implanted with NICD H33HJ‐JA1 cells, fed either in the presence or in the absence of glutamine (Q), and treated with temsirolimus (4 mg·kg−1, twice a week), a derivative of RAP (20 mice/group). Graphs show mean values ± SEM (n ≥ 3, *P < 0.05). Two‐way ANOVA followed by Bonferroni's comparison as a post hoc test was used to evaluate the statistical difference between more than two groups.

Similar articles

Cited by

References

    1. Tremblay CS & Curtis DJ (2014) The clonal evolution of leukemic stem cells in T‐cell acute lymphoblastic leukemia. Curr Opin Hematol 21, 320–325. - PubMed
    1. Pancewicz J & Nicot C (2011) Current views on the role of Notch signaling and the pathogenesis of human leukemia. BMC Cancer 11, 502. - PMC - PubMed
    1. Tzoneva G & Ferrando AA (2012) Recent advances on NOTCH signaling in T‐ALL. Curr Top Microbiol Immunol 360, 163–182. - PubMed
    1. Raivio KO & Andersson LC (1982) Glutamine requirements for purine metabolism in leukemic lymphoblasts. Leuk Res 6, 111–115. - PubMed
    1. Kitoh T, Kubota M, Takimoto T, Hashimoto H, Shimizu T, Sano H, Akiyama Y & Mikawa H (1990) Metabolic basis for differential glutamine requirements of human leukemia cell lines. J Cell Physiol 143, 150–153. - PubMed

Publication types

MeSH terms