OMA1 reprograms metabolism under hypoxia to promote colorectal cancer development
- PMID: 33314701
- PMCID: PMC7788456
- DOI: 10.15252/embr.202050827
OMA1 reprograms metabolism under hypoxia to promote colorectal cancer development
Abstract
Many cancer cells maintain enhanced aerobic glycolysis due to irreversible defective mitochondrial oxidative phosphorylation (OXPHOS). This phenomenon, known as the Warburg effect, is recently challenged because most cancer cells maintain OXPHOS. However, how cancer cells coordinate glycolysis and OXPHOS remains largely unknown. Here, we demonstrate that OMA1, a stress-activated mitochondrial protease, promotes colorectal cancer development by driving metabolic reprogramming. OMA1 knockout suppresses colorectal cancer development in AOM/DSS and xenograft mice models of colorectal cancer. OMA1-OPA1 axis is activated by hypoxia, increasing mitochondrial ROS to stabilize HIF-1α, thereby promoting glycolysis in colorectal cancer cells. On the other hand, under hypoxia, OMA1 depletion promotes accumulation of NDUFB5, NDUFB6, NDUFA4, and COX4L1, supporting that OMA1 suppresses OXPHOS in colorectal cancer. Therefore, our findings support a role for OMA1 in coordination of glycolysis and OXPHOS to promote colorectal cancer development and highlight OMA1 as a potential target for colorectal cancer therapy.
Keywords: OMA1; colorectal cancer; glycolysis; hypoxia; oxidative phosphorylation.
© 2020 The Authors.
Conflict of interest statement
The authors declare that they have no conflict of interest.
Figures

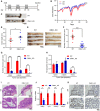
Relative levels of OMA1 mRNA in colorectal cancer tissues (n = 105) compared with adjacent normal tissues (n = 43) from colorectal cancer patients were shown (using the GEO dataset GSE21510). The data are presented as mean ± SEM, and statistical significance was determined by a Mann–Whitney test. ***P < 0.001.
Kaplan–Meier curves were constructed to analyze and compare between patients with high and low levels of OMA1 in colorectal cancer samples from the GEO dataset GSE17537. “Low” indicates patients with OMA1 mRNA levels less than the median. “High” indicates patients with OMA1 mRNA levels greater than the median. Statistical analysis was performed using log‐rank tests, n = 55, P = 0.0180.
The lysates of tumors (T) and adjacent normal (N) tissues from colorectal cancer patients were analyzed by Western blotting with antibodies against OPA1 or Tubulin. The “c, d and e” bands of OPA1 indicate cleaved OPA1 bands. Tubulin was used as a loading control.
Control and OMA1 KO HCT116 cells were cultured in hypoxia (1% O2) for 0 (normoxia), 24, or 48 h. Cell lysates were then assessed by Western blotting with antibodies against OPA1, OMA1, or β‐Actin. β‐Actin was used as a loading control. Representative immunoblots were from n = 3 independent experiments.
OPA1‐null mouse embryonic fibroblasts (MEFs) expressing control (empty vector) or OPA1 isoform 1 were cultured in normoxia or hypoxia (1% O2) for 24 h. Cell lysates were analyzed by Western blotting with anti‐OPA1 or anti‐Tubulin antibody. Representative immunoblots were from n = 3 independent experiments.
WT, OMA1 KO, and OMA1 KO HCT116 cells expressing WT‐OMA1(OMA1‐Flag) or proteolytic inactive OMA1(E324Q‐Flag) were cultured in hypoxia (1% O2) for 0, 24, or 48 h, and the cell lysates were assessed by Western blot with antibodies against OMA1, and β‐Actin. β‐Actin was used as a loading control (representative data from three independent experiments). The asterisk indicates a nonspecific band.
The relative protein levels were evaluated by densitometry analysis using ImageJ software and were quantified for the ratio of OMA1‐Flag/β‐Actin or E324Q‐Flag/β‐Actin in hypoxia for 0, 24 or 48 h (n = 3 independent experiments). The data are presented as mean ± SD.

- A
Schematic representation of the AOM/DSS procedure. To develop colitis‐associated cancer (CAC), WT (n = 11) and Oma1 −/− (n = 12) mice were injected intraperitoneally with AOM (10 mg/kg) on day 0. Then, three cycles of feeding water with 1.5% DSS treatment were administered. Mice were euthanized on day 105 and all intestinal tissues, tumors, and serum were collected. After mice were euthanized, intestines were removed and flushed with cold PBS. All experiments were repeated with three independent biological replicates.
- B
Body weight changes of WT (n = 11) and Oma1 −/− (n = 12) mice during AOM/DSS treatment. Data are presented as mean ± SEM. Statistical significance was assessed by a two‐way ANOVA, **P < 0.01.
- C
Typical intestine images on day 105 after mice were euthanized.
- D
Colorectal lengths (C) of WT (n = 11 biological replicates) and Oma1 −/− (n = 12 biological replicates) mice were measured. Data with error bars are presented as mean ± SEM. Statistical significance was assessed by unpaired Student’s t‐test, *P < 0.05.
- E
Representative images of colorectal tumors from WT (left) and Oma1 −/− (right) mice.
- F
The number of tumors in WT (n = 11) and Oma1 −/− (n = 12) mice was measured. Each dot represents the tumor number of one individual mouse. Data with error bars are presented as mean ± SEM. Statistical significance was assessed by unpaired Student’s t‐test, ***P < 0.001.
- G, H
The number of tumors of different sizes (diameter) in each mouse (G) and the distribution of different tumor sizes (H) were shown (WT n = 11 biological replicates, and Oma1 −/− n = 12 biological replicates). Results are shown as mean ± SEM. P‐values were calculated by unpaired Student’s t‐test, **P < 0.01, ***P < 0.001.
- I
Histological analysis of colorectal tumors of WT and Oma1 −/− mice was shown by hematoxylin and eosin (H&E) staining.
- J
Relative mRNA expression levels of pro‐inflammatory genes (Tnfα, Il6, Cox2, and Ccl2) in colorectal homogenates of WT and OMA1_KO mice treated with AOM/DSS (n = 4–5 per genotype). The data represent the mean ± SEM, n = 3 independent experiments, and statistical significance was determined by a two‐tailed Student’s t‐test. *P < 0.05, **P < 0.01.
- K
The colorectal tissues of WT and Oma1 −/− mice were stained with Ki67.

- A–C
Control or OMA1 KO HCT116 cells (5 × 10⁶) were injected into the flanks of nude mice. Mice were euthanized and photographed at day 16 (A). Representative photographs of tumors in nude mice were performed (A) and tumor weights were analyzed (C). The tumor sizes were measured at an interval of 6 days after injection and calculated as = width2 × length/2. Xenograft tumor growths of control or OMA1 KO HCT116 tumors in nude mice were shown (B). Data are presented as the mean ± SEM, n = 5 biological replicates. Scale bars, 2 cm. P‐values were calculated by two‐way ANOVA of variance; *P < 0.05, **P < 0.01. All experiments were repeated with three independent biological replicates.
- D
Control and OPA1 KO HCT116 cells were treated with glucose deprivation (galactose) or the glycolytic inhibitor (2‐Deoxy‐D‐glucose, 2‐DG, 10 mM) for 24 h. Cell deaths were quantified by cell counting with trypan blue exclusion. Error bars represent the mean ± SD (n = 3, 300 cells per independent experiment), statistical significance was assessed by a two‐way ANOVA of variance, ***P < 0.001.
- E
OPA1‐null MEFs expressing control (empty vector) or OPA1 isoform 1 were cultured with galactose or 2‐DG for 48 h. Cell death was quantified by cell counting with trypan blue exclusion. Error bars represent the mean ± SD (n = 3, 300 cells per independent experiment), statistical significance was assessed by a two‐way ANOVA of variance, ***P < 0.001.

- A, B
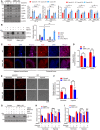
Control or OMA1 KO HCT116 cells expressing control (empty vector) or OMA1‐Flag were maintained in normoxia or hypoxia (1% O2) for 24 h. The glucose uptake (A) and lactate production (B) were measured by using microplate reader, and the values were normalized to the protein concentration. Error bars indicate the mean ± SD of three independent experiments, statistical significance was assessed by a two‐way ANOVA, *P < 0.05. Cells were lysed and assessed by Western blot with antibodies against OMA1 and GAPDH (A). The asterisk indicates a nonspecific band.
- C
Control and OMA1 KO HCT116 cells were treated with DMSO or 1mM DMOG in fresh medium for 12 h. Subsequent injections of glucose, oligomycin (Oligo), and 2‐deoxy‐glucose (2‐DG) were performed as indicated. The extracellular acidification rates (ECAR) were measured with a Seahorse Extracellular Flux Analyzer XF96. The data are presented as mean ± SD (n = 3 independent experiments).
- D
Quantitative analysis of basal and maximal glycolytic capacity. Error bars are presented as mean ± SD (n = 3 independent experiments), statistical significance was assessed by a two‐way ANOVA. N.S., not significant, ***P < 0.001.
- E, F
Lactate production (E) and ATP production (F) were measured in control or OPA1 KO HCT116 cells upon DMSO or 2‐DG treatment. Error bars are presented as mean ± SD by a two‐way ANOVA (n = 3 independent experiments). N.S., not significant, **P < 0.01, ***P < 0.001.
- G, H
Control or OPA1 KO HCT116 cells were maintained in normoxia or hypoxia (1% O2) for 24 h. The glucose uptake (G) and lactate production (H) were measured, and the values were normalized to the protein concentration. Statistical significance was assessed by a two‐way ANOVA; error bars are presented as mean ± SD of three independent experiments; N.S., not significant, *P < 0.05, **P < 0.01.

- A
Control and OMA1 KO HCT116 cells were cultured in normoxia or in hypoxia (1% O2) for 24 or 48 h. The whole cell lysates were analyzed by Western blotting with antibodies against HIF‐1α, HK2, LDHA, PKM2, GPI, OMA1, or β‐Actin. The relative protein levels were further evaluated by densitometry analysis using ImageJ software and were presented as bar graphs in the right panels. Error bars are presented as mean ± SD by a two‐way ANOVA (n = 3 independent experiments). *P < 0.05, **P < 0.01, ***P < 0.001.
- B
Control or OMA1 KO Hela cells were untreated (−) or CoCl2‐treated (+) for 24 h with 10 mM Mg132 or vehicle added for the last 4 h. Cell lysates were assessed by Western blotting with antibodies against HIF‐1α or β‐Actin. Relative protein levels were further evaluated by densitometry analysis. Error bars indicate the mean ± SD by a two‐way ANOVA (n = 3 independent experiments). *P < 0.05, **P < 0.01.
- C
Dihydroethidium (DHE) staining of optimum cutting temperature (OCT) covered tissues from the colons of WT and Oma1 −/− mice; DAPI was used as counterstain. DHE was shown in red color, while DAPI in blue color (representative data from three independent experiments).
- D
Quantification of DHE staining. Error bars are presented as mean ± SD (n = 3 biological replicates), statistical significance was assessed by a two‐way ANOVA, **P < 0.01, ***P < 0.001.
- E
Control or OMA1 KO HCT116 cells cultured in normoxia or hypoxia (1% O2) for 12 h were stained with mitoSOX and then analyzed by confocal microscopy (representative data from three independent experiments).
- F
The fluorescence intensity of mitoSOX was further analyzed by ImageJ software. Bars indicate the mean ± SD of three independent experiments by a two‐way ANOVA, ***P < 0.001.
- G–I
Control or OMA1_KO HCT116 cells were cultured in normoxia or hypoxia for 12 h, and were treated with DMSO, NAC (10 mM) or Rotenone (1 μM) for 12 h at the same time. The whole cell lysates were analyzed by Western blotting with antibodies against HIF‐1α, and Tubulin (G). The glucose uptake (H) and lactate production (I) were measured using microplate reader, and the values were normalized to the protein concentration. Error bars indicate the mean ± SD (n = 3 independent experiments), statistical significance was assessed by two‐way ANOVA. N.S., not significant, *P < 0.05, ***P < 0.001.

- A–C
Control or OMA1_KO HCT116 cells were transfected with control, shHIF‐1α_1, or shHIF‐1α_2 (HIF‐1α knockdown) lentiviral particles. And cells were cultured in normoxia or hypoxia for 12 h. The whole cell lysates were analyzed by Western blotting with antibodies against HIF‐1α, Tubulin (representative data from three independent experiments) (A). The lactate production (B) and glucose uptake (C) were measured using microplate reader, and the values were normalized to the protein concentration. Error bars indicate the mean ± SD (n = 4 independent experiments), statistical significance was assessed by a two‐way ANOVA. N.S., not significant, *P < 0.05, ***P < 0.001.

- A
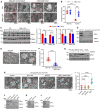
Representative transmission electron microscopy (TEM) analysis of the colorectal tumors or adjacent normal tissues from WT or Oma1 −/− mice.
- B
Quantitative analysis of mitochondrial cristae (the ratio of cristae number to mitochondrial area) in tumor or adjacent normal tissues from WT and Oma1 −/− mice (20 mitochondria per group, biological replicates). Statistical significance was assessed by a two‐way ANOVA; error bars are presented as mean ± SD; N.S., not significant, ***P < 0.001.
- C
The lysates of the adjacent normal tissues or tumors from WT and Oma1 −/− mice were stained with antibodies against OPA1, OMA1, or Tubulin (representative data from three independent experiments). The asterisk indicates a nonspecific band. The bands of OPA1 and L‐OPA1 were further quantified by ImageJ software. Error bars indicate the mean ± SD (n = 3 independent experiments), statistical significance was assessed by two‐way ANOVA. N.S., not significant, *P < 0.05, ***P < 0.001.
- D
The lysates of HCT116 cells or xenograft tumor of nude mice injected with HCT116 cells were assessed by Western blotting with anti‐OPA1, or anti‐OMA1, or anti‐Tubulin (representative data from three independent experiments).
- E
Representative TEM analysis of HCT116 cells or the xenograft tumors of nude mice injected with HCT116 cells.
- F
Quantitative analysis of mitochondrial cristae (the ratio of cristae number to mitochondrial area) in HCT116 cells or the xenograft tumors of nude mice injected with HCT116 cells (20 mitochondria per group, biological replicates). Statistical significance was assessed by Student’s t‐test; error bars are presented as mean ± SD; ***P < 0.001.
- G
YME1L_KO, OMA1_KO, YME1L_OMA1_Double KO (DKO), and WT HCT116 cells were maintained in normoxia or hypoxia (1% O2) for 72 h. The whole cell lysates were analyzed by Western blotting with antibody against OPA1. Tubulin was used as a loading control.
- H, I
Representative TEM analyzed the inside of the xenograft tumors from nude mice injected with control, OPA1_KO, shOPA1, YME1L‐OMA1‐DKO HCT116 cells (H). Quantitative analysis of mitochondrial cristae (the ratio of cristae number to mitochondrial area) was further performed (I) (20 mitochondria per group, biological replicates). Statistical significance was assessed by a two‐way ANOVA; error bars are presented as mean ± SD; N.S., not significant, ***P < 0.001.
- J
WT, YME1L_KO, OMA1_KO, and YME1L_OMA1_Double KO (DKO) HCT116 cells were analyzed by Western blotting with antibody against OMA1, YME1L, and Tubulin.
- K, L
Control and shOPA1_KO (K), Control and shOPA1 (L) HCT116 cells were analyzed by Western blotting with antibodies against OPA1 and Tubulin.

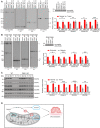
293T cells were transiently co‐transfected with empty vector and NDUFB5‐MYC, or OMA1‐E324Q‐Flag and NDUFB5‐MYC. Cell lysates were used for co‐immunoprecipitation with anti‐Flag M2 affinity gel at 4°C overnight, followed by Western blotting with anti‐Flag or anti‐MYC antibodies (n = 3 independent experiments).
293T cells were transiently co‐transfected with empty vector and NDUFB6‐GFP, or OMA1‐E324Q‐Flag and NDUFB6‐GFP. Cell lysates were used for co‐immunoprecipitation with anti‐Flag M2 affinity gel at 4°C overnight, followed by Western blotting with antibodies against Flag or GFP (n = 3 independent experiments).
293T cells were transiently co‐transfected with empty vector and COX4L1‐GFP, or OMA1‐E324Q‐Flag and COX4L1‐GFP. Cell lysates were used for co‐immunoprecipitation with anti‐Flag M2 affinity gel at 4°C overnight, followed by Western blotting with anti‐Flag or anti‐GFP antibodies (n = 3 independent experiments).
293T cells were transiently co‐transfected with empty vector and NDUFA4‐GFP, or OMA1‐E324Q‐Flag and NDUFA4‐GFP. Cell lysates were used for co‐immunoprecipitation with anti‐Flag M2 affinity gel at 4°C overnight, followed by Western blotting with antibodies against Flag or GFP (n = 3 independent experiments).
HCT116 cells stably expressing control (empty vector) or OMA1‐Flag, and HCT116 cells infected with control or shOMA1 (OMA1 knockdown) lentiviral particles and further cultured for 5 days, were then treated with DMSO or 20 μm CCCP for 4 h. Cell lysates were analyzed by Western blotting with antibodies against NDUFA4, COX4L1, NDUFB5, DNUFB6, MT‐CO2, OMA1, or Tubulin. The black arrowhead indicated the full‐length COX4L1 or NDUFB6, and the red arrowhead pointed to the cleaved band. The asterisk indicates a nonspecific band.
WT, OMA1 KO, and OMA1 KO HCT116 cells expressing WT‐OMA1(OMA1‐Flag) or proteolytic inactive OMA1(E324Q‐Flag) were treated with CHX (100 µg/ml) plus CCCP (20 µM) for 0, 2, 4, 6 h. The cell lysates were then assessed by western blot with antibodies against NDUFA4, COX4L1, NDUFB5, NDUFB6, OMA1, or HSP60 (representative data from three independent experiments). The asterisk indicates a nonspecific band.
Control or OMA1 KO HCT116 cells were cultured in hypoxia (1% O2) for 0, 24, or 48 h. Cell lysates were assessed by Western blotting with anti‐NDUFB5, anti‐NDUFB6, anti‐COX4L1, anti‐NDUFA4 antibodies, or anti‐β‐Actin. The relative protein levels were further evaluated by densitometry analysis using ImageJ software and were presented as bar graphs in the right panels. Error bars are presented as mean ± SD by a two‐way ANOVA (n = 3 independent experiments). *P < 0.05, **P < 0.01, ***P < 0.001.

Mitochondria isolated from tumors (T) or adjacent normal (N) tissues of WT and Oma1 −/− mice were subjected to blue native PAGE (BN‐PAGE), and respiratory chain complexes were analyzed by Western blotting with anti‐NDUFB8 (Complex I), anti‐SDHA (Complex II), anti‐COX4L1 (Complex IV), and anti‐ATP5A1 (Complex V, ATP synthase) antibodies. SDS–PAGE with antibody against HSP60 was used as a loading control. Relative protein levels were further evaluated by densitometry analysis using ImageJ software. Error bars are presented as mean ± SD by a two‐way ANOVA (n = 3 independent experiments). *P < 0.05, **P < 0.01, ***P < 0.001.
Digitonin‐solubilized mitochondria were isolated from control and OMA1 KO HCT116 cells cultured in normoxia or hypoxia (1% O2) for 12 h, and then analyzed by BN‐PAGE and immunoblotting using the indicated antibodies against NDUFB8 (Complex I), SDHA (Complex II), COX4L1 (Complex IV), and ATP5A1 (Complex V). SDS–PAGE with antibody against HSP60 was used as a loading control. Relative protein levels were further evaluated by densitometry analysis using ImageJ software. Error bars are presented as mean ± SD by a two‐way ANOVA (n = 3 independent experiments). N.S., not significant, *P < 0.05.
The lysates of adjacent normal tissues (N) or tumors (T) from WT and Oma1 −/− mice were analyzed by Western blotting with antibodies against NDUFA4, COX4L1, NDUFB5, DNUFB6, UQCRC2, or Tubulin. Relative protein levels were further evaluated using ImageJ software. Error bars indicate the mean ± SD by a two‐way ANOVA (n = 3 independent experiments). *P < 0.05, ***P < 0.001.
A graphic model of mitochondrial stress sensor OMA1‐coordinated glycolysis and mitochondrial oxidative phosphorylation in colorectal carcinogenesis and development. Hypoxia‐induced OMA1 activation leads to the degradation of mitochondrial respiratory chain complexes (MRCC) components and OPA1, and results in cristae remodeling, all of which results in the inhibition of mitochondrial electron transport chain (ETC) and the generation of mitochondrial ROS. Elevated ROS can stabilize HIF1a, thereby promoting glycolysis. Thus, OMA1 promotes the Warburg effect by coordinating glycolysis and oxidative phosphorylation to facilitate colorectal cancer development.

HCT116 cells were transfected with control, shNDUFB5_1 or shNDUFB5_2 (NDUFB5 knockdown) lentiviral particles, and the cell lysates were assessed by Western blotting with anti‐NDUFB5, anti‐NDUFB6, anti‐NDUFB8, anti‐SDHA, anti‐UQCRC2, or anti‐β‐Actin. (representative data from three independent experiments).
HCT116 cells infected with control or shNDUFB6 (NDUFB6 knockdown) lentiviral particles were lysed and analyzed by Western blotting with antibodies against NDUFB5, NDUFB6, NDUFB8, SDHA, UQCRC2, or β‐Actin. (representative data from three independent experiments).
HCT116 cells were transfected with control or shCOX4L1 (COX4L1 knockdown) lentiviral particles and the cell lysates were assessed by Western blotting with anti‐COX4L1, anti‐MT‐CO2, anti‐NDUFB8, anti‐SDHA, anti‐UQCRC2, or anti‐β‐Actin. (representative data from three independent experiments).
Western blotting analysis of HCT116 control or NDUFA4 KO (NDUFA4 knockout) cell lysates with antibodies against NDUFA4, MT‐CO2, NDUFB6, SDHA, UQCRC2, or β‐Actin. (representative data from three independent experiments).
Mitochondria isolated from control and shCOX4L1, control and shNDUFB5, control and shNDUFB6, control and NDUFA4_KO HCT116 cells were subjected to blue native PAGE (BN‐PAGE), and respiratory chain complexes were analyzed by Western blotting with anti‐NDUFB8 (Complex I), anti‐SDHA (Complex II), anti‐MT‐CO2 (Complex IV), and anti‐ATP5A1 (Complex V, ATP synthase) antibodies. SDS–PAGE with antibody against HSP60 was used as a loading control. Relative protein levels were further evaluated by densitometry analysis using ImageJ software. Error bars are presented as mean ± SD by Student’s t‐test (n = 3 independent experiments). N.S., not significant, **P < 0.01, ***P < 0.001.

- A, B
Control, shCOX4L1, shNDUFB5, shNDUFB6, and NDUFA4_KO HCT116 cells were stained with mitoSOX and then analyzed by confocal microscopy (A). The fluorescence intensities of mitoSOX were analyzed by ImageJ software (B). Bars indicate the mean ± SD of three independent experiments by Student’s t‐test, ***P < 0.001.
- C, D
Control and shCOX4L1, control and shNDUFB5, control and shNDUFB6, control and NDUFA4_KO HCT116 cells were cultured for 24 h. The lactate production (C) and glucose uptake (D) were measured by using microplate reader, and the values were normalized to the protein concentration. Error bars indicate the mean ± SD (n = 3 independent experiments), statistical significance was assessed by t‐test, *P < 0.05, **P < 0.01, ***P < 0.001.
Similar articles
-
The mitochondrial protease OMA1 acts as a metabolic safeguard upon nuclear DNA damage.Cell Rep. 2023 Apr 25;42(4):112332. doi: 10.1016/j.celrep.2023.112332. Epub 2023 Mar 31. Cell Rep. 2023. PMID: 37002921
-
Nutrient deprivation-related OXPHOS/glycolysis interconversion via HIF-1α/C-MYC pathway in U251 cells.Tumour Biol. 2016 May;37(5):6661-71. doi: 10.1007/s13277-015-4479-7. Epub 2015 Dec 8. Tumour Biol. 2016. PMID: 26646563
-
The Warburg effect in tumor progression: mitochondrial oxidative metabolism as an anti-metastasis mechanism.Cancer Lett. 2015 Jan 28;356(2 Pt A):156-64. doi: 10.1016/j.canlet.2014.04.001. Epub 2014 Apr 13. Cancer Lett. 2015. PMID: 24732809 Free PMC article. Review.
-
Mitochondrial UQCC3 Modulates Hypoxia Adaptation by Orchestrating OXPHOS and Glycolysis in Hepatocellular Carcinoma.Cell Rep. 2020 Nov 3;33(5):108340. doi: 10.1016/j.celrep.2020.108340. Cell Rep. 2020. PMID: 33147459
-
HIF-1-Dependent Reprogramming of Glucose Metabolic Pathway of Cancer Cells and Its Therapeutic Significance.Int J Mol Sci. 2019 Jan 9;20(2):238. doi: 10.3390/ijms20020238. Int J Mol Sci. 2019. PMID: 30634433 Free PMC article. Review.
Cited by
-
Inorganic Polyphosphate Promotes Colorectal Cancer Growth via TRPM8 Receptor Signaling Pathway.Cancers (Basel). 2024 Sep 28;16(19):3326. doi: 10.3390/cancers16193326. Cancers (Basel). 2024. PMID: 39409946 Free PMC article.
-
Construction and validation of a pancreatic cancer prognostic model based on genes related to the hypoxic tumor microenvironment.World J Gastroenterol. 2024 Sep 28;30(36):4057-4070. doi: 10.3748/wjg.v30.i36.4057. World J Gastroenterol. 2024. PMID: 39351249 Free PMC article.
-
Targeting DNM1L/DRP1-FIS1 axis inhibits high-grade glioma progression by impeding mitochondrial respiratory cristae remodeling.J Exp Clin Cancer Res. 2024 Sep 30;43(1):273. doi: 10.1186/s13046-024-03194-6. J Exp Clin Cancer Res. 2024. PMID: 39350223 Free PMC article.
-
Opa1 processing is dispensable in mouse development but is protective in mitochondrial cardiomyopathy.Sci Adv. 2024 Aug 2;10(31):eadp0443. doi: 10.1126/sciadv.adp0443. Epub 2024 Aug 2. Sci Adv. 2024. PMID: 39093974 Free PMC article.
-
Identification of TEFM as a potential therapeutic target for LUAD treatment.J Transl Med. 2024 Jul 29;22(1):692. doi: 10.1186/s12967-024-05483-2. J Transl Med. 2024. PMID: 39075464 Free PMC article.
References
-
- Acín‐Pérez R, Fernández‐Silva P, Peleato ML, Pérez‐Martos A, Enriquez JA (2008) Respiratory active mitochondrial supercomplexes. Mol Cell 32: 529–539 - PubMed
-
- Acin‐Perez R, Lechuga‐Vieco AV, Del Mar MM, Nieto‐Arellano R, Torroja C, Sánchez‐Cabo F, Jiménez C, González‐Guerra A, Carrascoso I, Benincá C et al (2018) Ablation of the stress protease OMA1 protects against heart failure in mice. Sci Transl Med 10: eaan4935 - PubMed
-
- Alavi MV (2019) Targeted OMA1 therapies for cancer. Int J Cancer 145: 2330–2341 - PubMed
-
- Amini MA, Karimi J, Khodadadi I, Tavilani H, Talebi SS, Afshar B (2019) Overexpression of ROMO1 and OMA1 are potentially biomarkers and predict unfavorable prognosis in gastric cancer. J Gastrointest Cancer 51: 939–946 - PubMed
Publication types
MeSH terms
LinkOut - more resources
Full Text Sources
Medical

