. 2020 Dec;8(2):e001849.
doi: 10.1136/jitc-2020-001849.

Galectin-9 expression defines exhausted T cells and impaired cytotoxic NK cells in patients with virus-associated solid tumors

Affiliations

Galectin-9 expression defines exhausted T cells and impaired cytotoxic NK cells in patients with virus-associated solid tumors

Isobel Okoye et al. J Immunother Cancer. 2020 Dec.

Abstract

Background: We have previously reported that the upregulation of galectin-9 (Gal-9) on CD4+ and CD8+ T cells in HIV patients was associated with impaired T cell effector functions. Gal-9 is a ligand for T cell immunoglobulin and mucin domain-3, and its expression on T cells in cancer has not been investigated. Therefore, we aimed to investigate the expression level and effects of Gal-9 on T cell functions in patients with virus-associated solid tumors (VASTs).

Methods: 40 patients with VASTs through a non-randomized and biomarker-driven phase II LATENT trial were investigated. Peripheral blood mononuclear cells and tumor biopsies were obtained and subjected to immunophenotyping. In this trial, the effects of oral valproate and avelumab (anti-PD-L1) was investigated in regards to the expression of Gal-9 on T cells.

Results: We report the upregulation of Gal-9 expression by peripheral and tumor-infiltrating CD4+ and CD8+ T lymphocytes in patients with VASTs. Our results indicate that Gal-9 expression is associated with dysfunctional T cell effector functions in the periphery and tumor microenvironment (TME). Coexpression of Gal-9 with PD-1 or T cell immunoglobulin and ITIM domain (TIGIT) exhibited a synergistic inhibitory effect and enhanced an exhausted T cell phenotype. Besides, responding patients to treatment had lower Gal-9 mRNA expression in the TME. Translocation of Gal-9 from the cytosol to the cell membrane of T cells following stimulation suggests persistent T cell receptor (TCR) stimulation as a potential contributing factor in Gal-9 upregulation in patients with VASTs. Moreover, partial colocalization of Gal-9 with CD3 on T cells likely impacts the initiation of signal transduction via TCR as shown by the upregulation of ZAP70 in Gal-9+ T cells. Also, we found an expansion of Gal-9+ but not TIGIT+ NK cells in patients with VASTs; however, dichotomous to TIGIT+ NK cells, Gal-9+ NK cells exhibited impaired cytotoxic molecules but higher Interferon gamma (IFN-γ) expression.

Conclusion: Our data indicate that higher Gal-9-expressing CD8+ T cells were associated with poor prognosis following immunotherapy with anti-Programmed death-ligand 1 (PD-L1) (avelumab) in our patients' cohort. Therefore, for the very first time to our knowledge, we report Gal-9 as a novel marker of T cell exhaustion and the potential target of immunotherapy in patients with VASTs.

Keywords: T-lymphocytes; immunologic; investigational; killer cells; natural; receptors; therapies; tumor microenvironment.


Conflict of interest statement

Competing interests: None declared.

Figures
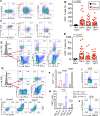
Figure 1
Figure 1
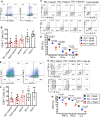
Overexpression of Gal-9 on T cells of patients with virus-associated solid tumors is associated with impaired effector function. (A and B) Representative flow cytometry plots and cumulative data of surface expression of Gal-9 and coexpression of Gal-9 with PD-1 or TIGIT on CD4+ T cells. (C and D) Representative flow cytometry plots and cumulative data of surface expression of Gal-9 and coexpression of Gal-9 with PD-1 or TIGIT on CD8+ T cells. (E and F) Representative flow cytometry plots and cumulative data showing IL-2, TNF-α and IFN-γ production by Gal-9- versus Gal-9+ CD4+ T cells. (G and H) Representative flow cytometry plots and cumulative data showing IL-2, TNF-α and IFN-γ production by Gal-9− versus Gal-9+ CD8+ T cells after 6-hour stimulation with anti-CD3/CD28 in vitro. (I) Representative flow cytometry plots showing perforin and GzmB expression in CD8+ Gal-9− versus CD8+ Gal-9+ T cells. (J and K) Representative plots showing coexpression of Gal-9 with CTLA-4 on CD4+ and CD8+ T cells in a patient with cancer. Each dot represents a patient and mean±SEM ANOVA with Tukey multiple comparisons, p value as indicated for each plot. ANOVA, analysis of variance; CTLA-4, cytotoxic T lymphocyte-associated protein 4; Gal-9, galectin-9; HCs, healthy controls; PD-1, programmed cell death 1; TIGIT, T cell immunoglobulin and ITIM domain.
Figure 2
Figure 2
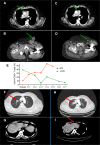
The upregulation of Gal-9 on TILs impair their cytokine production capabilities. (A and B) Representative flow cytometry plots and cumulative data of surface expression/coexpression of Gal-9 with TIGIT and PD-1 on CD4+ TILs at baseline. (C and D) Representative flow cytometry plots and cumulative data showing TNF-α, IFN-γ and IL-2 production by CD4+PD-1Gal-9, CD4+PD-1+Gal-9 and CD4+PD-1+Gal-9+ T cells after 6-hour stimulation with anti-CD3/CD28 in vitro. (E and F) Representative flow cytometry plots and cumulative data of surface expression/coexpression of Gal-9 with TIGIT and PD-1 on CD8+ TILs. (G and H) Representative flow cytometry plots and cumulative data showing TNF-α, IFN-γ and IL-2 production by CD8+PD-1Gal-9, CD8+PD-1+Gal-9 and CD8+PD-1+Gal-9+ T cells after 6-hour stimulation with anti-CD3/CD28 in vitro. Each dot represents a patient and mean±SEM, p value as indicated for each plot. Gal-9, galectin-9; PD-1, programmed cell death 1; TIGIT, TILs, tumor-infiltrating T cells.
Figure 3
Figure 3
The expression of Gal-9 on CD8+ T cells in the periphery is indicative of poor prognosis. (A) Cumulative data showing the percentages of Gal-9 +CD8+T cells in the PBMCs of patients at the baseline (time 0), cycles 1 and 2, evaluated 12 weeks later as immune confirmed progressive disease (iCPD), immune stable disease (iSD) and immune partial response (iPR). (B) Data showing changes in mRNA expression levels for PD1, EOMES, TBX21, GSK3a, BATF and GAL-9 genes in biopsy sample from an iPR patient at screening time compared with the cycle 7 (3.5 months) post-treatment. (C) Data showing changes in mRNA expression levels for PD1, EOMES, TBX21, GSK3a, BATF and GAL-9 genes in biopsy sample from an iCPD patient at screening time compared with the cycle 7 (3.5 months) post-treatment. Data are representative of two samples. Each dot represents a patient and mean±SEM, p value as indicated for each data set. PBMCs, peripheral blood mononuclear cells.
Figure 4
Figure 4
CT scan depicts a 12-week disease response assessment following treatment with oral valproate and anti-PD-L1 immunotherapy. A and B panels showing baseline tumor assessment in a 69-year-old man with HPV-related carcinoma of the penis. C and D panels indicating a dramatic response to therapy is observed with respect to a pericardial soft tissue mass (C) and bulky inguinal lymphadenopathy (D). E panel showing % of Gal-9+ CD8+ T cells in a partial responder versus a patient with confirmed progressive disease. F and G panels showing baseline tumor assessment in a 39-year-old man with EBV-related nasopharyngeal carcinoma. (H and I) Progressive disease is noted with respect to the enlargement of apical lung metastasis (H) and the development of hepatic metastatic disease (I). Gal-9, galectin-9; HPV, human papillomavirus.
Figure 5
Figure 5
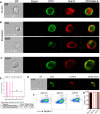
Translocation of Gal-9 from the cytosol to the membrane following T cells activation. (A) Image stream plots of intracellular Gal-9 localization in cytosol in unstimulated (no stim) T cells. (B) Image stream plots of Gal-9 localization on the cell membrane following stimulation of T cells with anti-CD3/CD28 overnight. (C) Representative image stream of Gal-9 expression on CD3 T cells from a cancer patient without stimulation in vitro. (D) Plot showing colocalization of CD3 and surface (S) Gal-9 on T cells of a patient with cancer. (E) Cumulative data showing % colocalization of Gal-9 and CD3. (F) Representative plots and (G) cumulative data showing the expression of Dectin-1 on CD11b+, CD11c+ and CD14+ cells in a patient with VAST. Gal-9, galectin-9; VAST, virus-associated solid tumor.
Figure 6
Figure 6
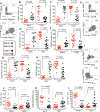
Frequency of NK cell subpopulations and expression levels of Gal-9 and TIGIT on NK cells. (A) Representative plot of NK cell subpopulations (CD56+, CD56+CD16+ and CD16+) in PBMCs of a patient with cancer. (B) Representative plots showing expression of Gal-9 and TIGIT on different NK cell subpopulations in a patient with cancer versus a healthy control (HC). (C) Cumulative data showing percentages of CD56+ NK cells expressing either Gal-9 or TIGIT in patients with cancer versus HCs. (D) Cumulative data showing percentages of CD56+CD16+ NK cells expressing either Gal-9 or TIGIT in patients with cancer versus HCs. (E) Cumulative data showing percentages of CD16+ NK cells expressing either Gal-9 or TIGIT in patients with cancer versus HCs. (F) Representative plot showing coexpression of TIGIT and Gal-9 on NK cells. Each dot represents a patient and mean±SEM, p value as indicated for each data set or not significant (NS). Gal-9, galectin-9; TIGIT, T cell immunoglobulin and ITIM domain.
Figure 7
Figure 7
Gal-9 expressing NK cells dichotomous to TIGIT exhibit impaired cytotoxic molecules but increased IFN-γ expression. (A) Representative flow cytometry plot showing expression of perforin in Gal-9+ versus TIGIT+ CD56+ NK cells. (B–D) Cumulative data showing % perforin expression in Gal-9+ versus Gal-9− and TIGIT+ versus TIGIT− CD56+ NK cells (B), CD56+ CD16+ NK cells (C) and CD16+ NK cells (D) in our cancer cohort patients. (E) Representative flow cytometry plot showing expression of GzmB in Gal-9+ versus TIGIT+ CD56+ NK cells. (F–H) Cumulative data showing % GzmB expression in Gal-9+ versus Gal-9− and TIGIT+ versus TIGIT− CD56+ NK cells (F), CD56+ CD16+ NK cells (G) and CD16+ NK cells (H) in our cancer cohort patients. (E) Representative flow cytometry plot showing expression of GzmB in Gal-9+ versus TIGIT+ CD56+ NK cells. (F–H) Cumulative data showing % GzmB expression in Gal-9+ versus Gal-9− and TIGIT+ versus TIGIT− CD56+ NK cells (F), CD56+ CD16+ NK cells (G) and CD16+ NK cells (H) in our cancer cohort patients. (I) Representative flow cytometry plot showing expression of IFN-γ in Gal-9+ versus TIGIT+ CD56+ NK cells. (J–L) Cumulative data showing % IFN-γ expression in Gal-9+ versus Gal-9− and TIGIT+ versus TIGIT− CD56+ NK cells (J), CD56+ CD16+ NK cells (K) and CD16+ NK cells (L) in our cancer cohort patients. Each dot represents a patient and mean±SEM, p value as indicated for each data set. Gal-9, galectin-9; TIGIT, T cell immunoglobulin and ITIM domain.

Similar articles

Cited by

References

    1. Okoye IS, Houghton M, Tyrrell L, et al. . Coinhibitory Receptor Expression and Immune Checkpoint Blockade: Maintaining a Balance in CD8+ T Cell Responses to Chronic Viral Infections and Cancer. Front Immunol 2017;8:1215. 10.3389/fimmu.2017.01215 - DOI - PMC - PubMed
    1. Shahbaz S, Bozorgmehr N, Koleva P, et al. . CD71+VISTA+ erythroid cells promote the development and function of regulatory T cells through TGF-β. PLoS Biol 2018;16:e2006649. 10.1371/journal.pbio.2006649 - DOI - PMC - PubMed
    1. Schietinger A, Greenberg PD. Tolerance and exhaustion: defining mechanisms of T cell dysfunction. Trends Immunol 2014;35:51–60. 10.1016/j.it.2013.10.001 - DOI - PMC - PubMed
    1. Elahi S, Weiss RH, Merani S. Atorvastatin restricts HIV replication in CD4+ T cells by upregulation of p21. AIDS 2016;30:171–83. 10.1097/QAD.0000000000000917 - DOI - PubMed
    1. Tashiro H, Brenner MK. Immunotherapy against cancer-related viruses. Cell Res 2017;27:59–73. 10.1038/cr.2016.153 - DOI - PMC - PubMed

Publication types

MeSH terms