. 2020 Nov 20;23(12):101830.
doi: 10.1016/j.isci.2020.101830. eCollection 2020 Dec 18.

Disturbed Presynaptic Ca2+ Signaling in Photoreceptors in the EAE Mouse Model of Multiple Sclerosis

Affiliations

Disturbed Presynaptic Ca2+ Signaling in Photoreceptors in the EAE Mouse Model of Multiple Sclerosis

Amrita Mukherjee et al. iScience. .

Abstract

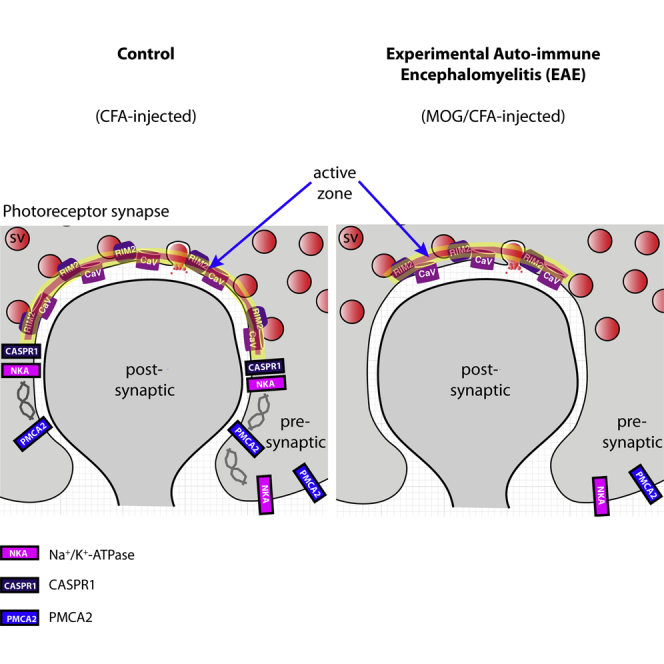
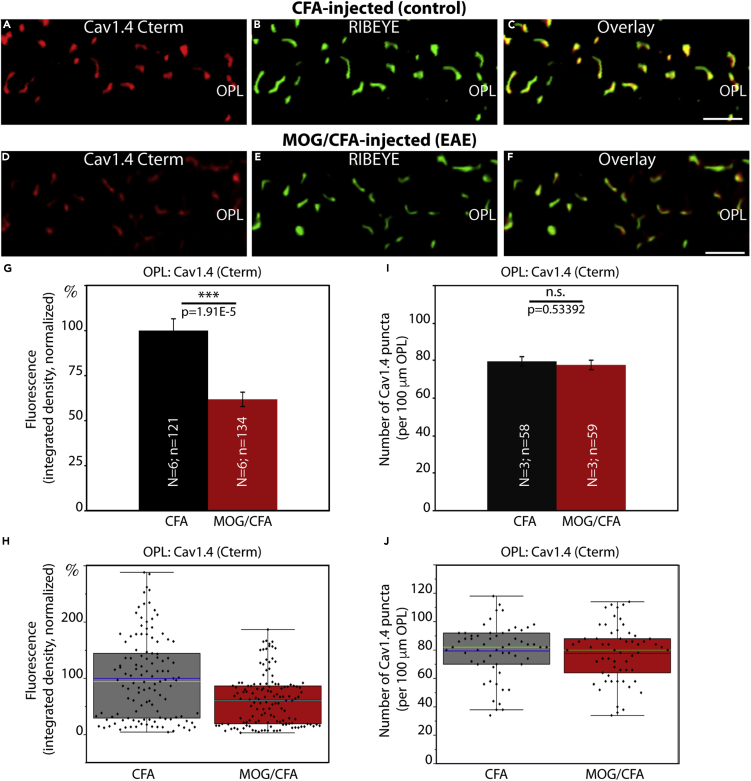
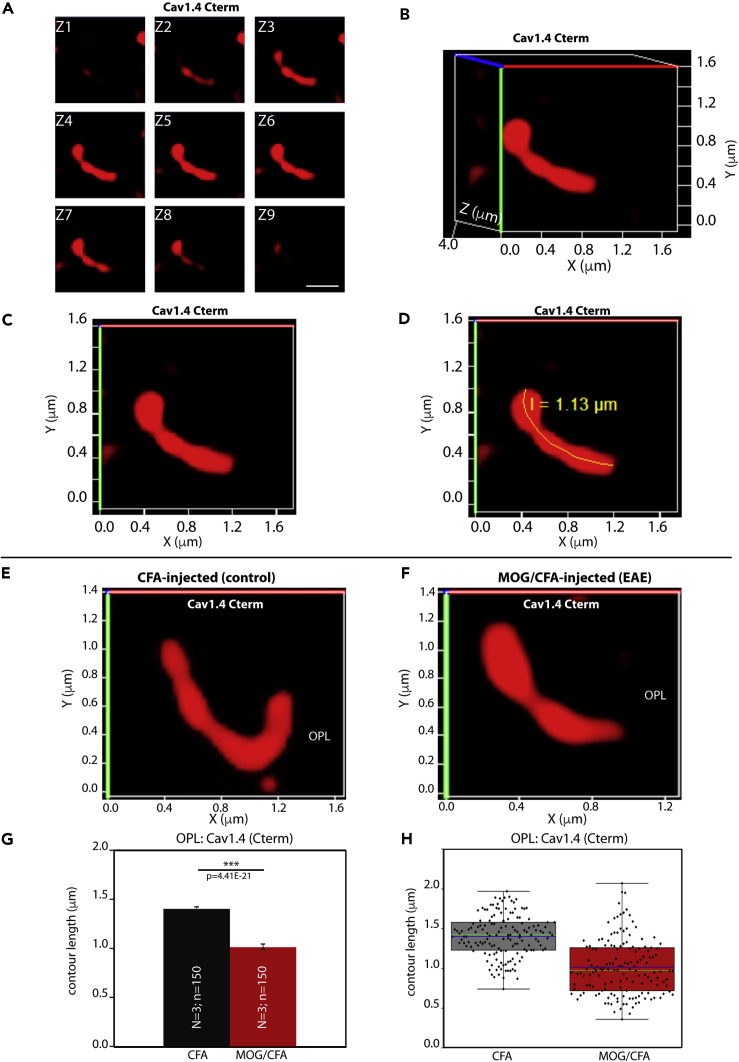
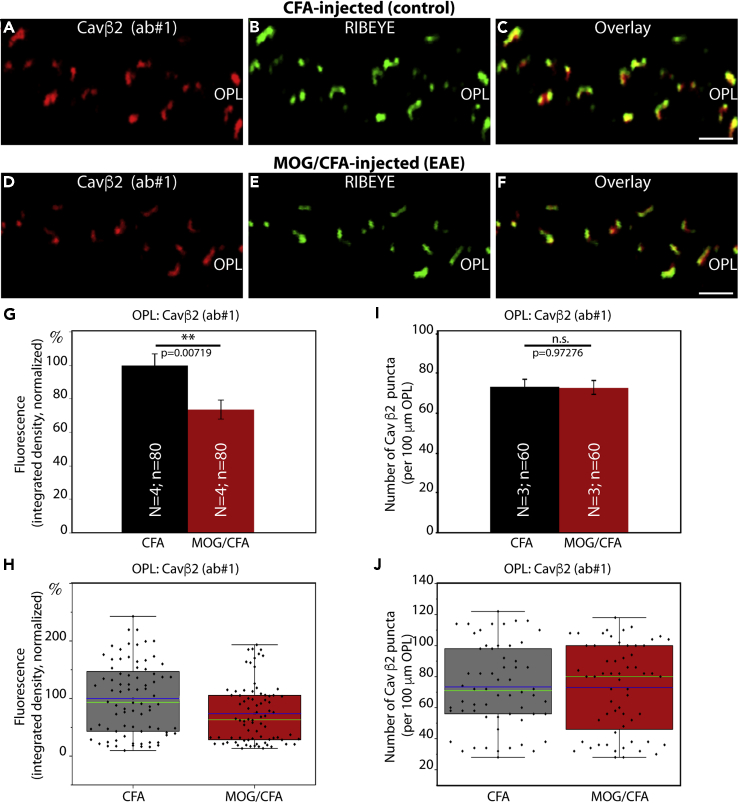
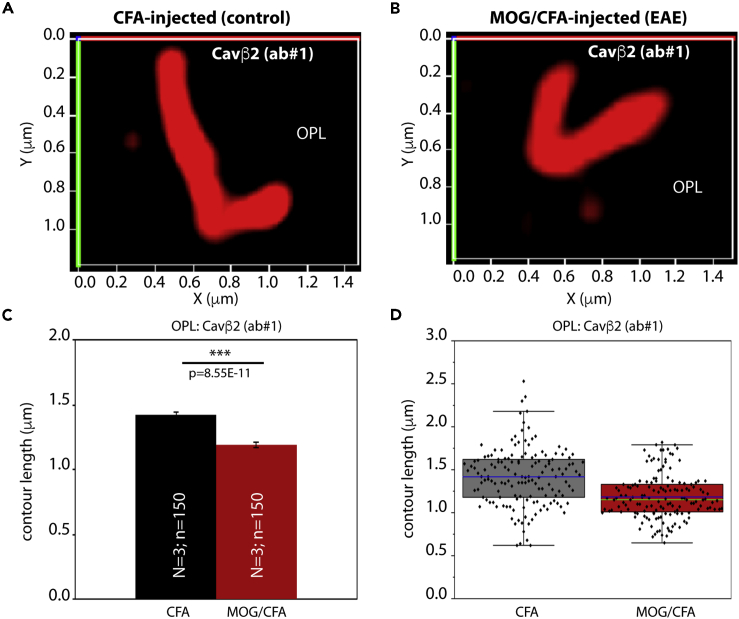
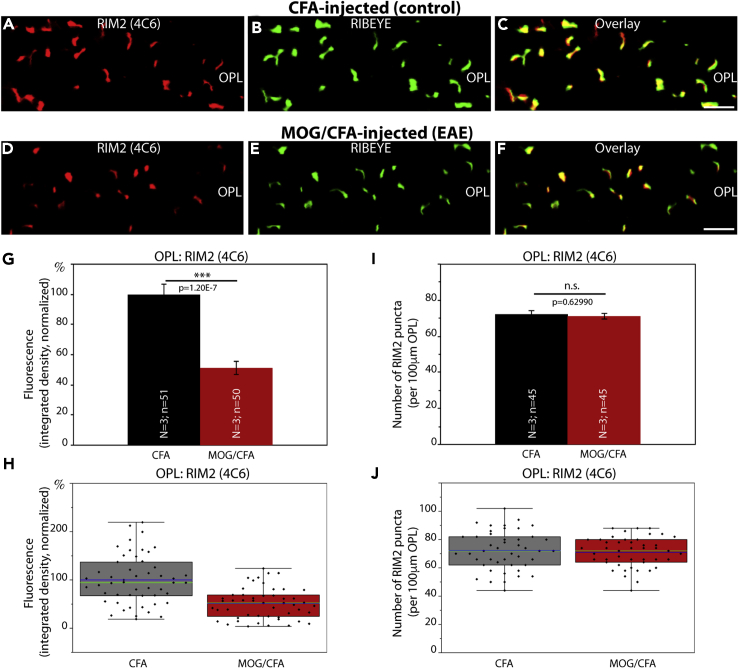
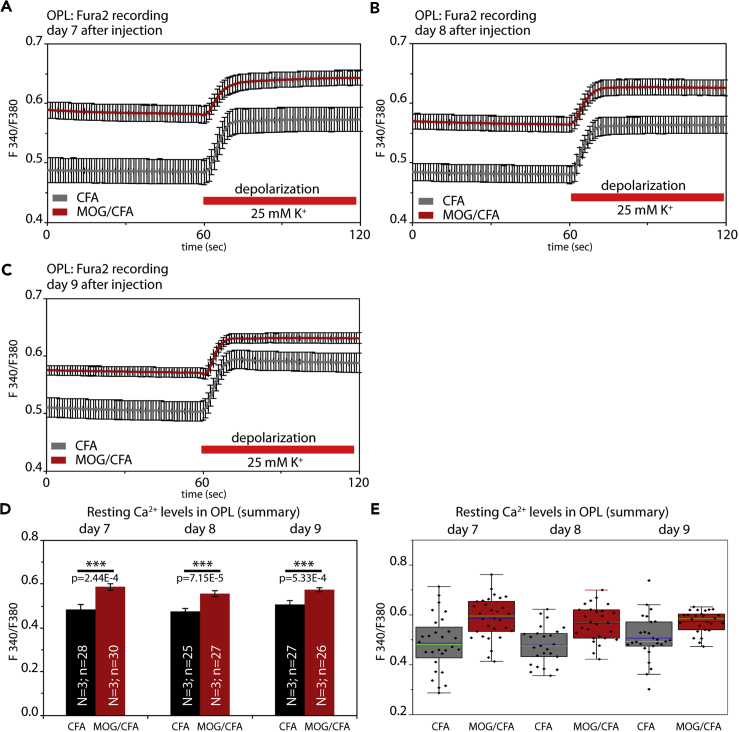
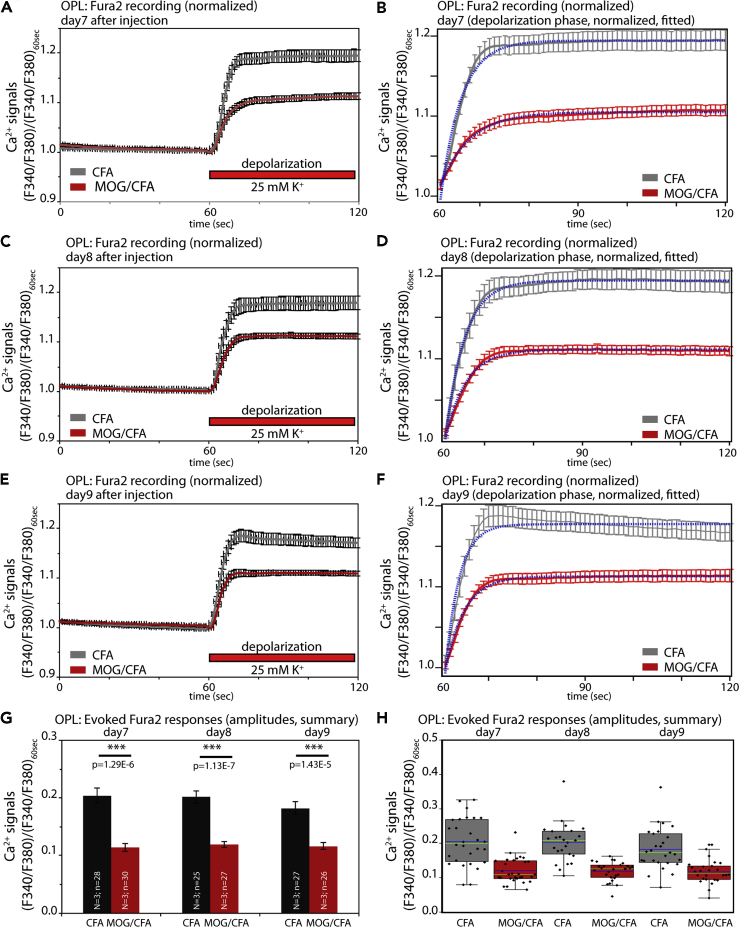
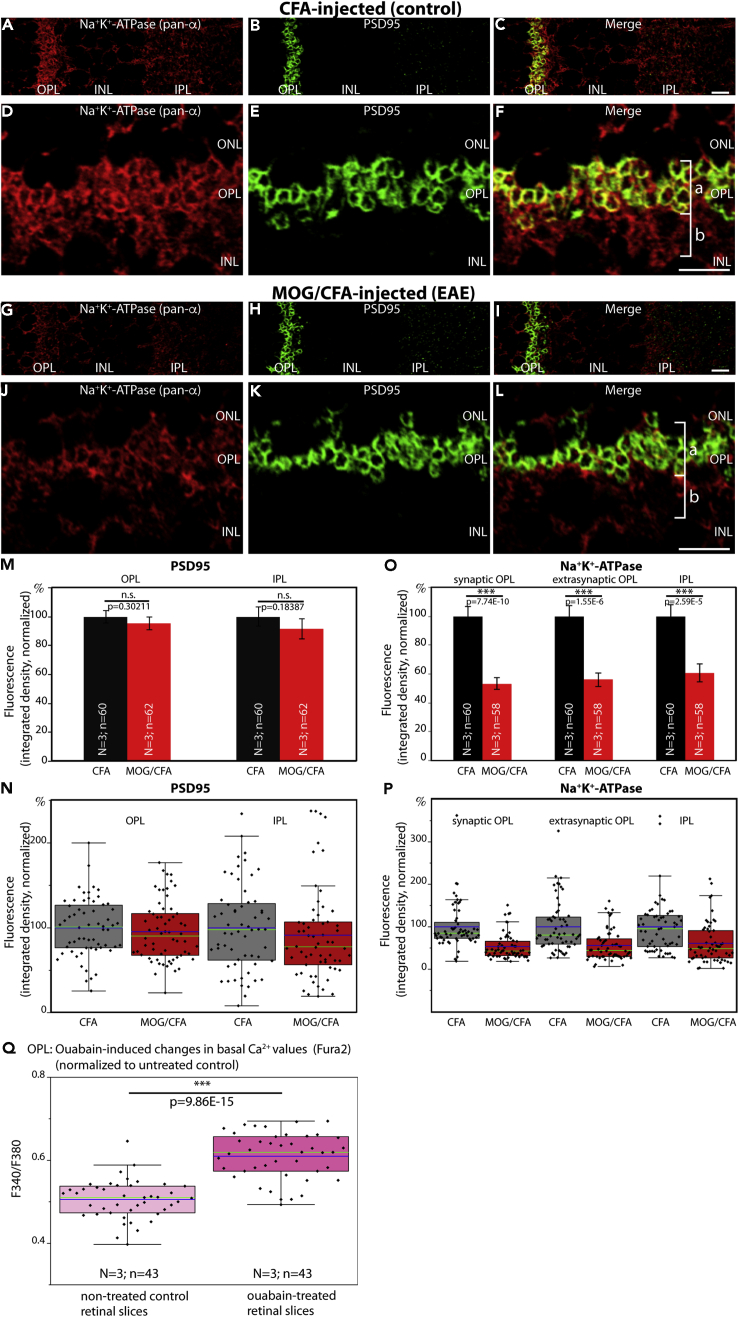
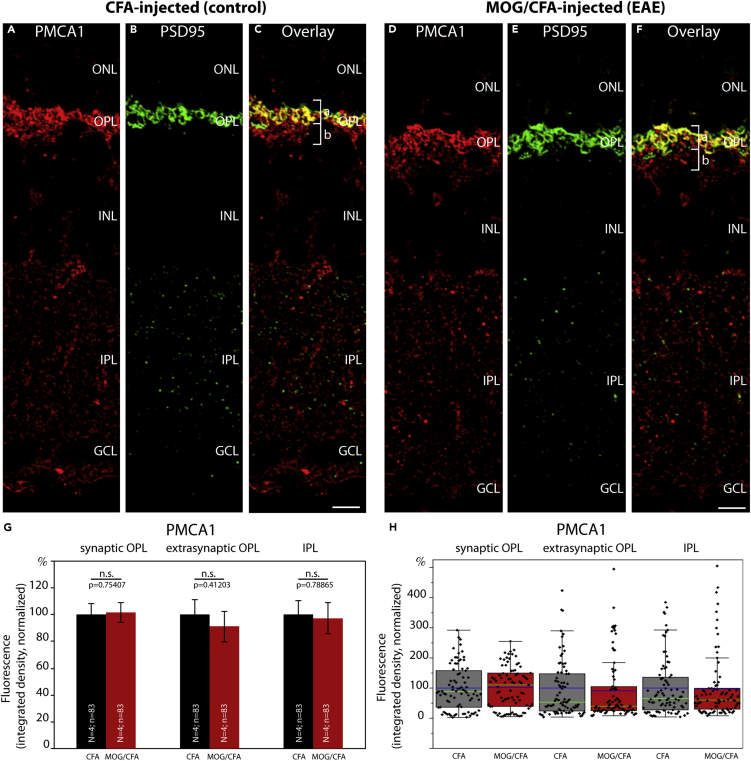
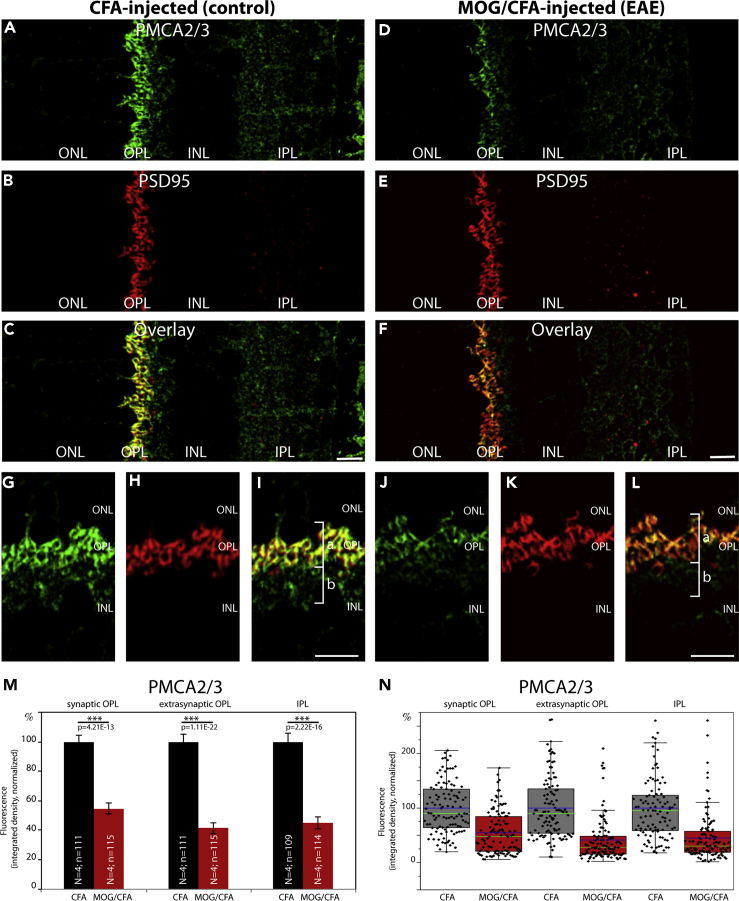
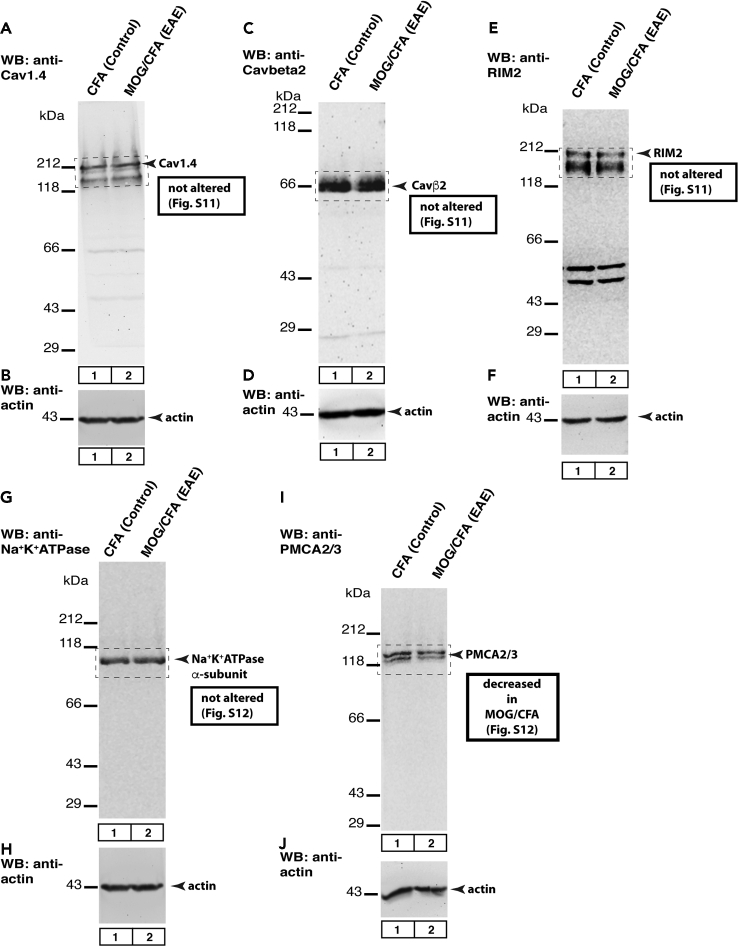
Multiple sclerosis (MS) is a demyelinating disease caused by an auto-reactive immune system. Recent studies also demonstrated synapse dysfunctions in MS patients and MS mouse models. We previously observed decreased synaptic vesicle exocytosis in photoreceptor synapses in the EAE mouse model of MS at an early, preclinical stage. In the present study, we analyzed whether synaptic defects are associated with altered presynaptic Ca2+ signaling. Using high-resolution immunolabeling, we found a reduced signal intensity of Cav-channels and RIM2 at active zones in early, preclinical EAE. In line with these morphological alterations, depolarization-evoked increases of presynaptic Ca2+ were significantly smaller. In contrast, basal presynaptic Ca2+ was elevated. We observed a decreased expression of Na+/K+-ATPase and plasma membrane Ca2+ ATPase 2 (PMCA2), but not PMCA1, in photoreceptor terminals of EAE mice that could contribute to elevated basal Ca2+. Thus, complex Ca2+ signaling alterations contribute to synaptic dysfunctions in photoreceptors in early EAE.

Keywords: Biological Sciences; Cell Biology; Cellular Neuroscience; Molecular Biology; Molecular Neuroscience; Neuroscience.


Conflict of interest statement

The authors declare no competing interests.

Figures

None
Graphical abstract
Figure 1
Figure 1
Cav1.4 Is Less Enriched at the Active Zone of Photoreceptor Synapses in EAE Mice (A–F) Retina sections (0.5 μm in thickness) from CFA- and MOG/CFA-injected mice processed 9 days after injection. Confocal analyses of rod photoreceptor synapses in the OPL immunolabeled with rabbit polyclonal antibody against Cav1.4 (Cav1.4 Cterm) and mouse monoclonal antibody (2D9) against RIBEYE. The intensity of the Cav1.4 immunosignals is quantified as integrated density in (G and H). The number of Cav1.4 puncta is quantified in (I and J). Values are means ± S.E.M. (G and I). In the box-and-whiskers plots of the data in (H and J) mean values are labeled by blue horizontal bars and median values by green horizontal bars. Boxes represent 25th–75th percentiles of values, and whiskers are equal to 1.5 times of the interquartile range (IQR). Statistical significance was determined with Mann-Whitney U-test. Abbreviations: OPL, outer plexiform layer; S.E.M., standard error of the mean; N = number of mice; n = number of images analyzed from retinal sections. Scale bars: 2 μm.
Figure 2
Figure 2
The Length of Cav1.4 Protein Clusters at the Active Zone Of Photoreceptor Synapses Is Decreased in EAE Mice 3D SR-SIM analyses of individual active zones of rod photoreceptor synapses from CFA-injected control mice and MOG/CFA-injected experimental mice immunolabeled with polyclonal antibody against Cav1.4 Cterm. (A–D) demonstrate how contour length of individual active zones was determined by 3D SR-SIM. (A) Individual z stack obtained with 3D SR-SIM; (B) the spatial 3D view; (C) the 2D projection of the 3D view with the active zone being rotated parallel to the X, Y-plane; (D) the measurement of the contour length of the presented active zone. (E and F) Exemplary SR-SIM images from CFA-injected control mice (E) and MOG/CFA-injected EAE mice (F). (G and H) Quantitative analyses of the active zone contour length (mean ± S.E.M.) (G) obtained from SR-SIM measurements. In the box-and-whiskers plots in (H), mean values are indicated by blue horizontal bars and median values by green horizontal bars. Boxes represent 25th–75th percentiles of values and whiskers are equal to 1.5 times of the IQR. Statistical significance was determined with Mann-Whitney U-test. Abbreviations: S.E.M., standard error of the mean; N = number of mice; n = number of analyzed immunolabelled active zones; OPL, outer plexiform layer. Scale bar: 0.5μm (A).
Figure 3
Figure 3
The Auxiliary β2-Subunit of Cav Channels Is Also Less Enriched at the Active Zone of Photoreceptor Synapses in EAE Mice (A–F) Retina sections (0.5 μm in thickness) from CFA- and MOG/CFA-injected mice processed 9 days after injection. Confocal analyses of rod photoreceptor synapses in the OPL immunolabeled with rabbit polyclonal antibody against Cavβ2 (ab#1) and mouse monoclonal antibody (2D9) against RIBEYE. The intensity of the Cavβ2 immunosignals is quantified as integrated density in (G and H). The number of Cavβ2 puncta is quantified in (I and J). Values are means ± S.E.M. (G and I). In the box-and-whiskers plots of the data in (H and J) mean values are labeled by blue horizontal bars and median values by green horizontal bars. Boxes represent 25th–75th percentiles of values and whiskers are equal to 1.5 times of the IQR. Statistical significance was determined with Mann-Whitney U-test. Abbreviations: OPL, outer plexiform layer; S.E.M., standard error of the mean; N = number of mice; n = number of images analyzed from retinal sections. Scale bars: 2 μm.
Figure 4
Figure 4
The Length of Auxiliary Cav Channel β2-Subunit Protein Clusters at the Active Zone of Photoreceptor Synapses Is Decreased in EAE Mice 3D SR-SIM analyses of individual active zones of rod photoreceptor synapses from CFA-injected control mice and MOG-CFA-injected experimental mice immunolabeled with polyclonal antibody against Cavβ2 (ab #1), (A–D) Exemplary SR-SIM images from CFA-injected control mice (A) and MOG/CFA-injected EAE mice (B). (C and D) quantitative analyses of the active zone contour length (mean ± S.E.M.) (C) obtained from SR-SIM measurements. In the box-and-whiskers plots of the data in (D), mean values are indicated by blue horizontal bars and median values by green horizontal bars. Boxes represent 25th–75th percentiles of values and whiskers are equal to 1.5 times of the IQR. Statistical significance was determined with Mann-Whitney U-test. Abbreviations: S.E.M., standard error of the mean; N = number of mice; n = number of analyzed immunolabeled active zones; OPL, outer plexiform layer.
Figure 5
Figure 5
RIM2 Is Less Enriched at the Active Zones of Photoreceptor Synapses in EAE Mice (A–F) Retinal sections (0.5 μm in thickness) from CFA- and MOG/CFA-injected mice processed 9 days after injection. Confocal analyses of rod photoreceptor synapses in the OPL immunolabeled with mouse monoclonal antibody against RIM2 (4C6) and rabbit polyclonal antibody against RIBEYE (U2656, Schmitz et al., 2000). The intensity of the RIM2 immunosignals were quantified as integrated density in (G and H). The number of RIM2 puncta are quantified in (I and J). Values are means ± S.E.M. (G and I). In the box-and-whiskers plots of the data in (H and J), mean values are indicated by blue horizontal bars and median values by green horizontal bars. Boxes represent 25th–75th percentiles of values and whiskers are equal to 1.5 times of the IQR. Statistical significance was determined with two-sample unpaired Student's t test. Abbreviations: OPL, outer plexiform layer; S.E.M., standard error of the mean; N = number of mice; n = number of images analyzed from the retinal sections. Scale bars: 2 μm.
Figure 6
Figure 6
Altered presynaptic Ca2+ signaling at photoreceptor synapses in EAE mice (A–C) Mean Fura2 ratiometric Ca2+ signals (±S.E.M.) measured in the OPL of CFA-injected control mice and MOG/CFA-injected EAE mice. Intracellular Ca2+ signals were measured at the indicated days after injection (day 7, day 8, or day 9 after injection). After 1min incubation in RS to obtain stable baseline signals, slices were depolarized by the addition of a K+-rich depolarization solution, as indicated by the red bar. Mean calibrated Ca2+ concentration before and after addition of high potassium are indicated for each analyzed day after injection. In (D), the mean baseline Fura2 responses were plotted from MOG/CFA-injected EAE mice and CFA-injected control mice. Values are shown as means ± S.E.M. (D). In (E), the data summarized in (D) were plotted as box-and-whiskers plots to show their individual distribution. Mean values are indicated by blue horizontal bars and median values by green horizontal bars (E). Boxes represent 25th–75th percentiles of values and whiskers are equal to 1.5 times of the IQR. Statistical significance was determined with two-sample unpaired Student's t test (data of day 7, day 8) and with Mann-Whitney U-test (data of day 9). Using the calibration described in Materials and Methods, the following Ca2+ concentrations were determined for Fura2 baseline values at resting conditions on day 7: 173 nM Ca2+ (for CFA), 319 nM Ca2+ (for MOG/CFA); on day 8: 169 nM Ca2+ (for CFA), 284 nM Ca2+ (for MOG/CFA); and on day 9: 198 nM Ca2+ (for CFA), 295 nM Ca2+ (for MOG/CFA). For the high K+-depolarization-evoked responses, the following Ca2+ concentrations were determined for day 7: 300 nM Ca2+ (for CFA), 439 nM Ca2+ (for MOG/CFA); on day 8: 283 nM Ca2+ (for CFA), 381 nM Ca2+ (for MOG/CFA); and on day 9: 316 nM Ca2+ (for CFA), 386 nM Ca2+ (for MOG/CFA). Abbreviations: OPL, outer plexiform layer; S.E.M., standard error of the mean; N = number of mice; n = number of retinal slices.
Figure 7
Figure 7
Decreased High K+-Depolarization-Evoked Ca2+ Responses in Photoreceptor Synapses of EAE Mice Analyses of depolarization-evoked Fura2 ratiometric Ca2+ signals at photoreceptor synapses of MOG/CFA-injected EAE mice and CFA-injected control mice at the indicated days after injection (day 7, day 8, and day 9 after injection). Curves shown in (A, C, E) represent the Fura2 F340/F380 ratiometric signals (from Figure 6), normalized to the resting Fura2 signals before high potassium application for better display of the Fura2 signals that result from depolarization-evoked increase of presynaptic Ca2+. In (B, D, F), only the normalized signals after high potassium application are depicted together with the respective curve fits. Statistical analyses of the normalized, high potassium-induced depolarization Fura2 signals are shown in (G, H). Values are shown as means ± S.E.M. (A–G). In the box-and-whiskers plot of the individual data points in (H), mean values are indicated by blue horizontal bars and median values by green horizontal bars. Boxes represent 25th–75th percentiles of values and whiskers are equal to 1.5 times of the IQR. Statistical significance was determined with Mann-Whitney U-test (data of day 7) and with two-sample unpaired Student's t test (data of day 8, day 9). Abbreviations: OPL, outer plexiform layer; S.E.M., standard error of the mean; N = number of mice; n = number of retinal slices.
Figure 8
Figure 8
Decreased Expression of Na+/K+-ATPase in Photoreceptor Synapses of EAE Mice Distribution of Na+/K+-ATPase in the OPL of CFA-injected control mice (A–F) and in MOG/CFA-injected EAE mice (G–L) processed 9 days after injection. Retinal sections (0.5 μm in thickness) were double-immunolabeled with a mouse monoclonal pan α-subunit Na+/K+-ATPase antibody and a rabbit polyclonal antibody against PSD95. PSD95 denotes the extension of presynaptic photoreceptor terminals. Quantification of immunolabeling signals is shown in (M–P). Statistical significance in (M–P) was determined with Mann-Whitney U-test. In (Q), Fura2 ratiometric signals of basal Ca2+ levels in the OPL of control retinal slices from wild-type mice and retinal slices treated with the Na+/K+-ATPase inhibitor ouabain were plotted (N = 3 mice; n = 43 slices [ouabain]; N = 3 mice; n = 43 slices [untreated controls]). Statistical significance in (Q) was performed with Student t test. Values are depicted as mean ± S.E.M. (M and O). In the box-and-whiskers plots of the individual data points (N, P, and Q), mean values are indicated by blue horizontal bars and median values by green horizontal bars. Boxes represent 25th–75th percentiles of values and whiskers are equal to 1.5 times of the IQR. Abbreviations: ONL, outer nuclear layer; OPL, outer plexiform layer; INL, inner nuclear layer; IPL, inner plexiform layer; bracket a, synaptic portion of the OPL; bracket b, extra-synaptic, neuropil portion of the OPL; S.E.M., standard error of the mean; N = number of mice; n = number of total images analyzed from retinal sections. Scale bars: 5 μm (A–L).
Figure 9
Figure 9
Expression of Plasma Membrane Ca2+ ATPase 1 (PMCA1) Is Unchanged in Photoreceptor Synapses of EAE Mice (A–F) Retina sections (0.5 μm in thickness) from CFA- and MOG/CFA-injected mice processed 9 days after injection. Confocal analyses of rod photoreceptor synapses in the OPL immunolabeled with rabbit polyclonal antibody against PMCA1 and rabbit polyclonal antibody against PSD95 using the Fab method. The intensity of the PMCA1 immunosignals is quantified as integrated density in (G and H). Values are means ± S.E.M. (G). In the box-and-whiskers plots of the data in (H), mean values are labeled by blue horizontal bars and median values by green horizontal bars. Boxes represent 25th–75th percentiles of values, and whiskers are equal to 1.5 times of the interquartile range (IQR). Statistical significance was determined with Mann-Whitney U-test. Abbreviations: ONL, outer nuclear layer; OPL, outer plexiform layer; INL, inner nuclear layer; IPL, inner plexiform layer; GCL, ganglion cell layer; bracket a, synaptic sub-layer of the OPL; bracket b, extra-synaptic, neuropil sub-layer of the OPL; S.E.M., standard error of the mean; N = number of mice; n = number of images analyzed from retinal sections. Scale bars: 5 μm.
Figure 10
Figure 10
Decreased Expression of Plasma Membrane Ca2+ ATPase 2 (PMCA2) in Photoreceptor Synapses of EAE Mice (A–L) Retina sections (0.5 μm in thickness) from CFA- and MOG/CFA-injected mice processed 9 days after injection. Confocal analyses of rod photoreceptor synapses in the OPL immunolabeled with mouse monoclonal antibody against PMCA2/3 and rabbit polyclonal antibody against PSD95. The intensity of the PMCA2/3 immunosignals is quantified as integrated density in (M and N). Values are means ± S.E.M. (M). In the box-and-whiskers plots of the data in (N), mean values are labeled by blue horizontal bars and median values by green horizontal bars. Boxes represent 25th–75th percentiles of values and whiskers are equal to 1.5 times of the interquartile range (IQR). Statistical significance was determined with Mann-Whitney U-test. Abbreviations: ONL, outer nuclear layer; OPL, outer plexiform layer; INL, inner nuclear layer; IPL, inner plexiform layer; bracket a, synaptic sub-layer of the OPL; bracket b, extra-synaptic, neuropil sub-layer of the OPL; S.E.M., standard error of the mean; N = number of mice; n = number of images analyzed from retinal sections. Scale bars: 5 μm.
Figure 11
Figure 11
Western Blot Analyses Western blot (WB) testing of global protein expression in retinal lysates obtained from MOG/CFA- and CFA-injected control retinas, isolated 9 days after injection. 40 μg of protein was loaded in each lane. In A, C, E, G, and I, the samples were probed with the indicated experimental antibodies. In B, D, F, H, and J, the same lanes were incubated with anti-actin antibody to verify equal protein loading of the MOG/CFA and CFA lanes. The boxed areas were quantified in Figures S11 and S12. Figure A–J show representative images from WB experiments repeated 7 times; for quantification of all WB results, see Figure S11 and S12.

Similar articles

Cited by

References

    1. Aizman O., Uhlen P., Lal M., Brismar H., Aperia A. Ouabain, a steroid hormone that signals with slow calcium oscillations. Proc. Natl. Acad. Sci. U S A. 2001;98:13420–13424. - PMC - PubMed
    1. Amaral E., Leite L.F., Gomez M.V., Prado M.A.M., Guatimosim C. Ouabain evokes exocytosis dependent on ryanodine and mitochondrial calcium stores that is not followed by compensatory endocytosis at the neuromuscular junction. Neurochem. Int. 2009;55:406–413. - PubMed
    1. Aperia A. New roles for an old enzyme: Na,K-ATPase emerges as an interesting drug target. J. Intern. Med. 2007;261:44–52. - PubMed
    1. Babai N., Morgans C.W., Thoreson W.B. Calcium-induced calcium release contributes to synaptic release from mouse rod photoreceptors. Neuroscience. 2010;165:1447–1456. - PMC - PubMed
    1. Ball S.L., Powers P.A., Shin H.S., Morgans C.W., Peachey N.S., Gregg R.G. Role of the beta2 subunit of voltage-gated channels in the retinal outer plexiform layer. Invest. Ophthalmol. Vis. Sci. 2002;43:1595–1603. - PubMed

LinkOut - more resources