. 2020 Dec 10;11(12):1045.
doi: 10.1038/s41419-020-03174-6.

Blockade of EIF5A hypusination limits colorectal cancer growth by inhibiting MYC elongation

Affiliations

Blockade of EIF5A hypusination limits colorectal cancer growth by inhibiting MYC elongation

Sonia Coni et al. Cell Death Dis. .

Abstract

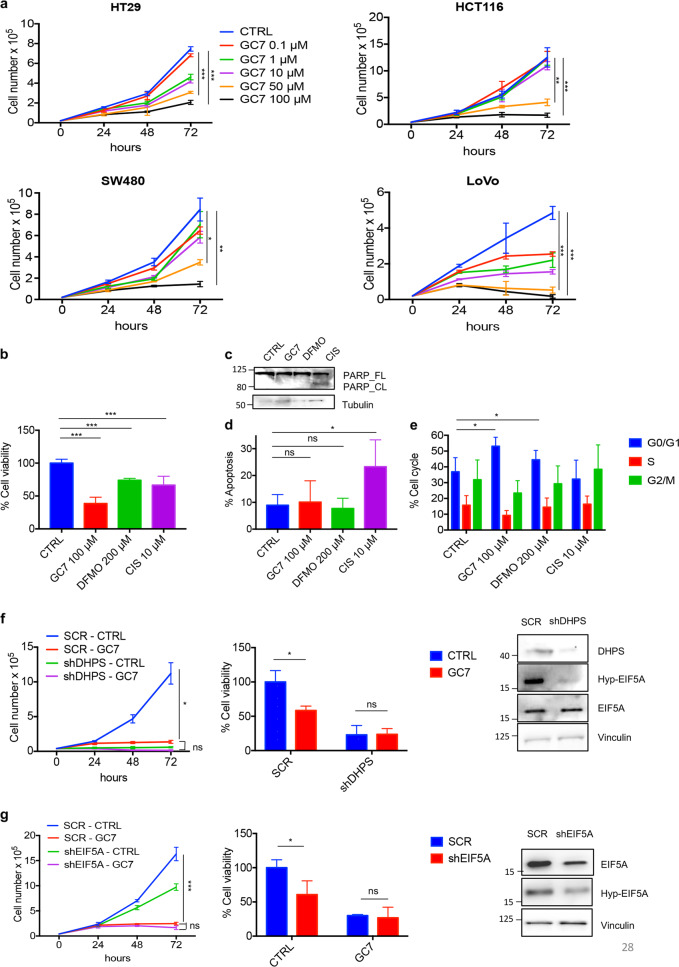
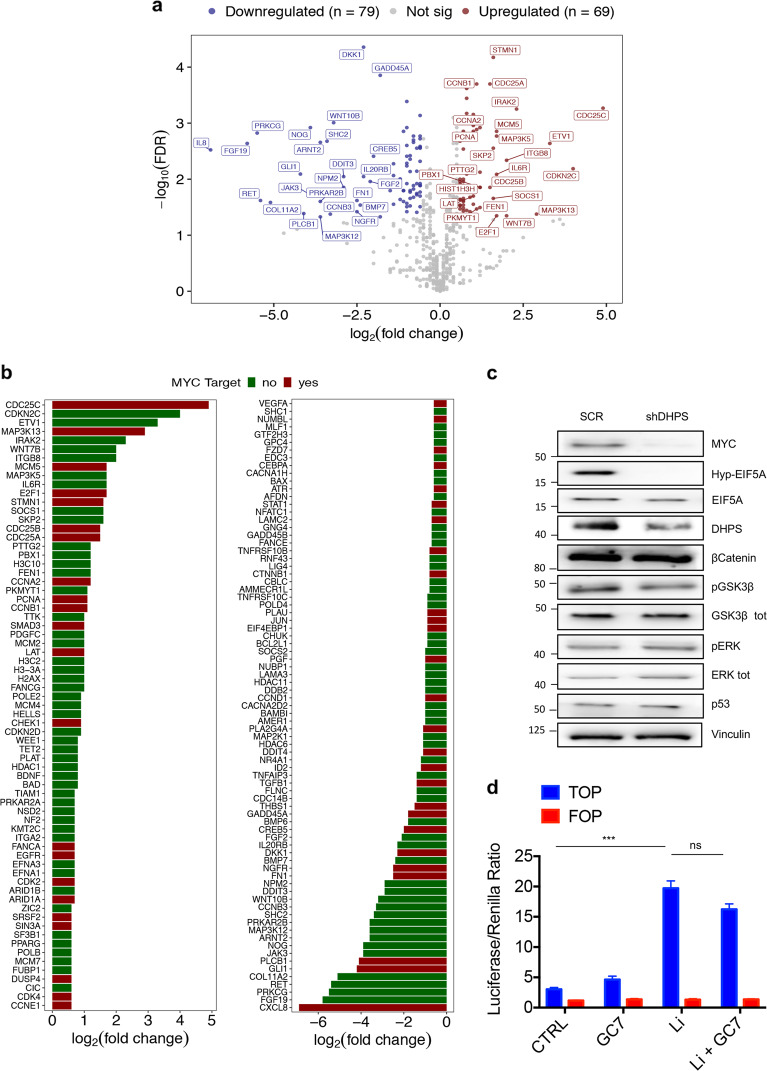
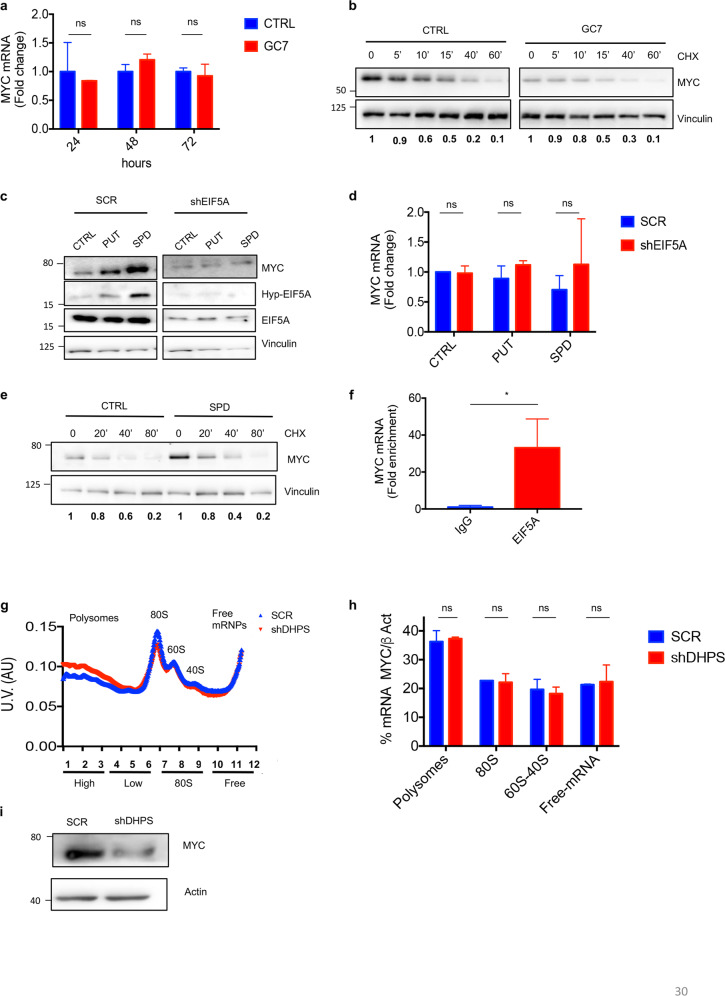
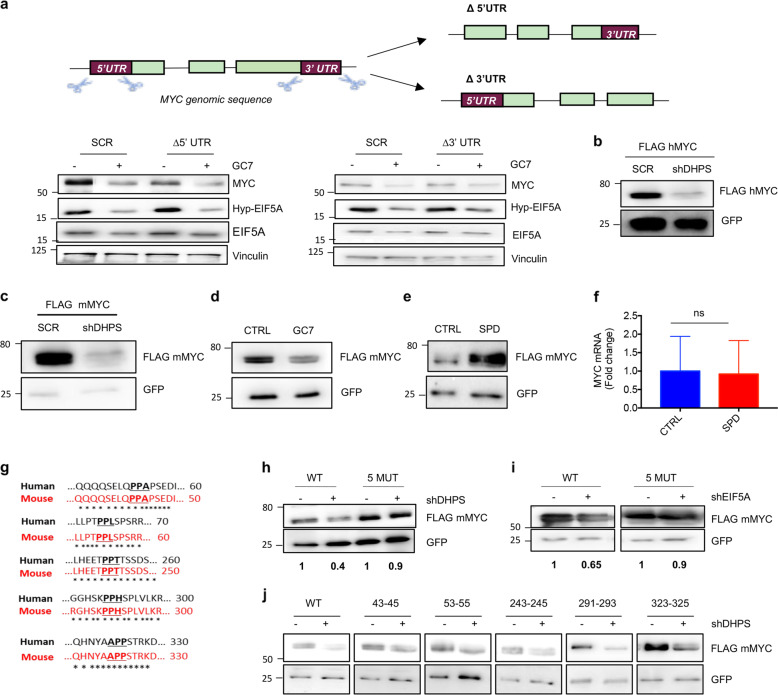
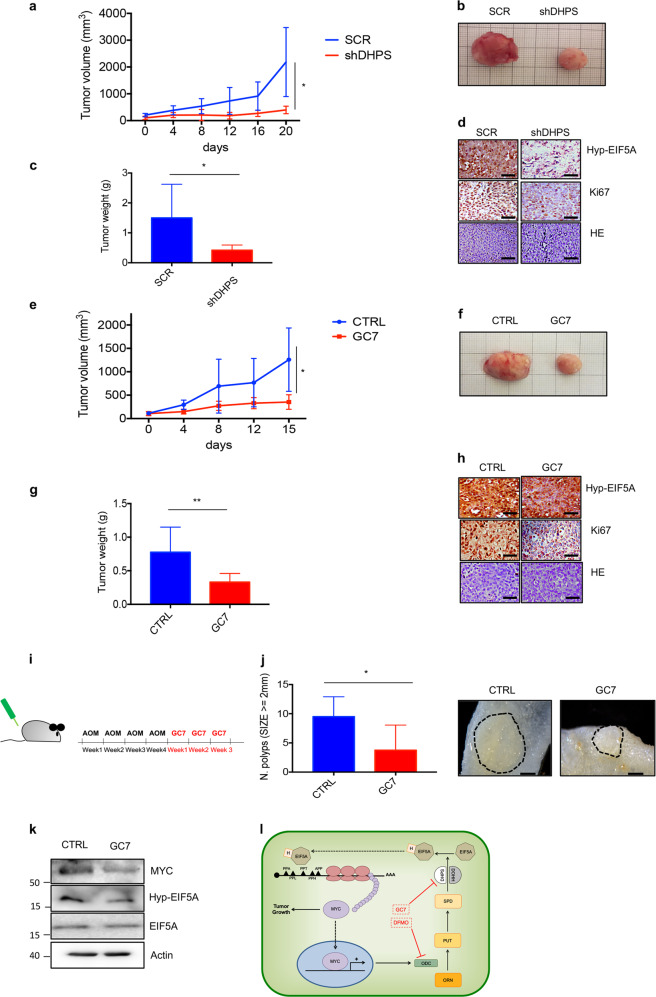
Eukaryotic Translation Initiation Factor 5A (EIF5A) is a translation factor regulated by hypusination, a unique posttranslational modification catalyzed by deoxyhypusine synthetase (DHPS) and deoxyhypusine hydroxylase (DOHH) starting from the polyamine spermidine. Emerging data are showing that hypusinated EIF5A regulates key cellular processes such as autophagy, senescence, polyamine homeostasis, energy metabolism, and plays a role in cancer. However, the effects of EIF5A inhibition in preclinical cancer models, the mechanism of action, and specific translational targets are still poorly understood. We show here that hypusinated EIF5A promotes growth of colorectal cancer (CRC) cells by directly regulating MYC biosynthesis at specific pausing motifs. Inhibition of EIF5A hypusination with the DHPS inhibitor GC7 or through lentiviral-mediated knockdown of DHPS or EIF5A reduces the growth of various CRC cells. Multiplex gene expression analysis reveals that inhibition of hypusination impairs the expression of transcripts regulated by MYC, suggesting the involvement of this oncogene in the observed effect. Indeed, we demonstrate that EIF5A regulates MYC elongation without affecting its mRNA content or protein stability, by alleviating ribosome stalling at five distinct pausing motifs in MYC CDS. Of note, we show that blockade of the hypusination axis elicits a remarkable growth inhibitory effect in preclinical models of CRC and significantly reduces the size of polyps in APCMin/+ mice, a model of human familial adenomatous polyposis (FAP). Together, these data illustrate an unprecedented mechanism, whereby the tumor-promoting properties of hypusinated EIF5A are linked to its ability to regulate MYC elongation and provide a rationale for the use of DHPS/EIF5A inhibitors in CRC therapy.


Conflict of interest statement

The authors declare no conflict of interests.

Figures

Fig. 1
Fig. 1. Inhibition of hypusination limits CRC cell growth in vitro.
a Proliferation assay in HT29 (n = 3), HCT116 (n = 3), SW480 (n = 3), and LoVo (n = 3) cells treated with different concentrations of GC7 (0.1, 1, 10, 50, and 100 μM) for 24, 48, and 72 h (upper panels). b Cell viability assay (MTT) (n = 3) of HCT116 treated for 48 h with 100 μM GC7, 200 μM DFMO, 10 μM Cisplatin, or control vehicle. c Western blot analysis of full-length and cleaved PARP, tubulin (loading control) in HCT116 cells treated with 100 μM GC7, 200 μM DFMO, 10 μM Cisplatin, or control vehicle for 48 h. d Flow cytometry analysis (n = 3) of HCT116 cells stained with annexin V after 24 h from treatments with 100 μM GC7, 200 μM DFMO, 10 μM Cisplatin, or control vehicle. e Cell cycle profile (n = 3) of HCT116 cells treated with 100 μM GC7, 200 μM DFMO, 10 μM Cisplatin, or control vehicle for 24 h. f Left, HCT116 cells were infected with lentiviruses expressing DHPS (shDHPS) or control (SCR) shRNAs for 72 h. After infection, cells were incubated with 100 μM GC7 and counted at the indicated time points or treated with 100 μM GC7 for 48 h and MTT assay performed (middle). Right, western blotting showing DHPS, Hyp-EIF5A, EIF5A, and Vinculin (loading control) levels before treatment. g Left, HCT116 cells were infected with lentiviruses expressing EIF5A (shEIF5A) or control (SCR) shRNAs for 72 h. After infection, cells were incubated with 100 μM GC7 and counted at the indicated time points or treated with 100 μM GC7 for 48 h and MTT assay performed (middle). Right, western blotting showing EIF5A, Hyp-EIF5A, and Vinculin (loading control) levels before treatment. For statistical analysis: ns not significant, *p < 0.05, **p < 0.01, ***p < 0.001, by one-way ANOVA. Data represent the mean ± SD of experiments performed in triplicates and repeated at least three times.
Fig. 2
Fig. 2. Gene expression profiling reveals that DHPS inhibition downregulates MYC.
a Volcano plot displaying the 148 differentially expressed genes in shDHPS vs. SCR. Axes show logarithmic transformation of fold change (x-axis) and p-values (FDR). Genes significantly upregulated (n = 79) and downregulated (n = 69) with an FDR < 0.05 and a log2(fold change) < −0.58 or >0.58 are represented in red and in dark blue, respectively. Labeled points indicate the first 25 upregulated and first 25 downregulated genes. b Barplot showing the log2(fold change, shDHPS vs. SCR) of the significantly upregulated (left panel) or downregulated (right panel) genes. Red bars indicate MYC target genes. c Western blotting of HCT116 infected with lentiviruses expressing shDHPS or SCR for 72 h, then selected with puromycin for 72 h. Staining for MYC, Hyp-EIF5A, EIF5A, DHPS, β-Catenin, pGSK3β, GSK3β, pERK, ERK, and p53. Vinculin, loading control. d Luciferase assay (n = 3) in HCT116 cells transfected for 24 h with TCF/LEF responsive reporter TOP or its negative control FOP. The day after transfection, cells were serum starved for 8 h and treated with 50 mM lithium chloride and 100 µM GC7 for other 24 h. For Statistical analysis: ns not significant, *p < 0.05, **p < 0.01, ***p < 0.001, by Student’s t-test. Data represent the mean ± SD of experiments performed in triplicates and repeated at least three times.
Fig. 3
Fig. 3. Polyamine-Hypusine axis regulates MYC translation in CRC.
a Quantitative real-time PCR (n = 3) of MYC mRNA levels in HCT116 cells treated with 100 μM GC7 for the indicated times. Data were normalized using L32 mRNA. b HCT116 cells were treated with 100 µM GC7 or vehicle for 24 h and incubated with 100 μg/mL CHX for the indicated times. Immunoblottings were performed with the indicated antibodies. Vinculin, loading control. Densitometric analysis of MYC/Vinculin protein levels is shown at the bottom of each lane. c HCT116 cells were transduced with lentiviruses expressing shEIF5A or SCR for 72 h and selected with puromycin. Endogenous polyamines were depleted by incubating the cells with 1 mM DFMO for 3 days. Polyamine-depleted cells were treated with 10 μM Putrescine (PUT) or 10 μM Spermidine for 4 h. Immunoblottings were performed with the indicated antibodies. Vinculin, loading control. d MYC mRNA levels from c. Data were normalized by L32 mRNA; results are represented as fold change (n = 3). e HCT116 cells were depleted of polyamines as above and treated with 10 μM Spermidine (SPD) for 16 h. CHX (100 μg/ml) was added for the indicated time points. Staining for MYC protein levels is shown. Vinculin, loading control. Densitometric analysis of MYC/Vinculin protein levels is shown at the bottom of each lane. f RNA IP. HCT116 cells were crosslinked, lysed, and immunoprecipitated with antibody anti EIF5A or control IgG. After elution, MYC mRNA levels were analyzed by RT-QPCR. Data were normalized by L32 mRNA levels (n = 3). g Polysome profiles of DHPS-deficient and control (SCR) HCT116 cells. Cytoplasmic lysates were fractionated on 15–50% sucrose gradients. The graph shows ultraviolet (UV) absorbance at 260 nm of the different polysomal fractions (n = 3). h QPCR analysis of MYC mRNA loaded in the different polysome fractions, β-actin was used to normalize the values (n = 3). i Western blotting showing total MYC protein levels in the lysate used for polysomal fractionation. β-Actin, loading control. For Statistical analysis: ns not significant, *p < 0.05, **p < 0.01, ***p < 0.001, by Student’s t-test. Data represent the mean ± SD of experiments performed in triplicates and repeated at least three times.
Fig. 4
Fig. 4. EIF5A regulates MYC translation at PPA sites in the coding region.
a Schematic representation of CRISPR/Cas9 strategy used to delete 5′- or 3′-UTRs from MYC gene in HCT116 cells (Δ5′UTR and Δ3′UTR clones, respectively). Western blotting of MYC, Hyp-EIF5A, EIF5A, and Vinculin (loading control) in scrambled (SCR) and Δ5′UTR clones (left) or in SCR and Δ3′UTR (right) clones treated with 100 μM GC7 or vehicle for 24 h. b Western blotting using FLAG and GFP antibody in HCT116 cells infected with SCR or shDHPS lentiviruses and co-transfected with vectors expressing FLAG hMYC and GFP. c Western blotting using FLAG and GFP antisera in HCT116 cells infected with SCR or shDHPS lentiviruses and co-transfected with vectors expressing FLAG mMYC and GFP. d Western blot analysis of FLAG and GFP in HCT116 cells transfected with FLAG mMYC and GFP vectors and treated with 100 µM GC7 for 48 h. e Immunoblot analysis of FLAG and GFP co-transfected with FLAG mMYC and GFP vectors, in polyamines-depleted HCT116 cells for 3 days by using 1 mM DFMO incubation and then treated with 10 μM Spermidine for the last 16 h. f MYC mRNA levels from e. Data were normalized by β-actin mRNA (n = 3). g Alignment of human (black) and mouse (red) MYC aminoacidic sequences at the identified pausing motifs. h Western blot analysis of FLAG and GFP in HCT116 cells infected with shDHPS or SCR and transfected with FLAG mMYC WT or mMYC 5 MUT and GFP as control for 24 h. Densitometric analysis of MYC/GFP protein levels is shown at the bottom of each lane. i Immunoblot with FLAG and GFP antisera in EIF5A-deficient (shEIF5A) or control (SCR) HCT116 cells co-transfected for 24 h with plasmids expressing GFP and FLAG mMYC, WT or mutated in the putative five pausing motifs (mMYC 5 MUT). Densitometric analysis of MYC/GFP protein levels is shown at the bottom of each lane. j Immunoblot with FLAG and GFP antisera in DHPS-deficient (shDHPS) or control (SCR) HCT116 cells co-transfected for 24 h with plasmids expressing GFP and FLAG mMYC, WT or mutated in the indicated individual pausing motifs.
Fig. 5
Fig. 5. Pathophysiological relevance of DHPS inhibition in preclinical models of CRC and FAP.
a HCT116 cells were stably transduced with lentiviruses expressing DHPS (shRNA) or nonspecific shRNAs (SCR) and then implanted subcutaneously into CD1 nude mice (2 × 106 cells each flank). Tumors were measured starting when they reached an average volume of 100 mm3. (SCR n = 6; shDHPS n = 6). b Representative images of explanted masses from a at the end of the procedure. c Average tumor weight of the explanted masses from a. d Hyp-EIF5A, Ki67, or hematoxylin staining of tumor sections from explanted masses shown in b. Scale bar 100 μM. e HCT116 cells were implanted subcutaneously into CD1 nude mice (2 × 106 cells each flank). When tumors reached an average volume of 100 mm3, mice were treated i.p. with GC7 4 mg/kg or control vehicle. Tumor volumes were measured at the indicated days. (CTRL n = 8; GC7 n = 8). f Representative images of explanted masses from e at the end of the experiment (CTRL vs. GC7). g Average tumor weight of the explanted masses from e at the end of the procedure. h Hyp-EIF5A, Ki67, or hematoxylin staining of tumors from f. Scale bar 100 μM. i Protocol of AOM (12 mg/kg) and GC7 (25 mg/kg) treatments in APCMin/+ mice. j Left, number of polyps ≥ 2 mm in size in the small intestine of female APCMin/+ mice treated with GC7 (n = 3) or CTRL (n = 3) as shown in i. Right, representative image of the polyps. Scale bar 1 mm. k Western blot analysis of MYC, Hyp-EIF5A, EIF5A, and β-actin (loading control) levels in pooled extracts from polyps in the small intestine of APCMin/+ mice treated as in i. Control, n = 3; GC7, n = 3. Schematic Model. Hypusinated EIF5A (Hyp-EIF5A) promotes MYC elongation by alleviating ribosome stalling at five pausing motifs. By regulating transcription of the enzyme Ornithine decarboxylase (ODC), MYC promotes an increase of the three polyamines (PUT, SPD, SPM). Elevations of SPD content lead to increased Hyp-EIF5A, thereby sustaining an amplification feedback loop. Inhibition of this mechanism limits intestinal tumor growth.

Similar articles

Cited by

References

    1. Arnold M, et al. Global patterns and trends in colorectal cancer incidence and mortality. Gut. 2017;66:683–691. doi: 10.1136/gutjnl-2015-310912. - DOI - PubMed
    1. Fernandez-Montes A, et al. Current options for third-line and beyond treatment of metastatic colorectal cancer. Spanish TTD Group Expert Opinion. Clin. Colorectal Cancer. 2020;19:165–177. doi: 10.1016/j.clcc.2020.04.003. - DOI - PubMed
    1. Capalbo C, et al. A simplified genomic profiling approach predicts outcome in metastatic colorectal cancer. Cancers. 2019;11:147. doi: 10.3390/cancers11020147. - DOI - PMC - PubMed
    1. Morin PJ, et al. Activation of beta-catenin-Tcf signaling in colon cancer by mutations in beta-catenin or APC. Science. 1997;275:1787–1790. doi: 10.1126/science.275.5307.1787. - DOI - PubMed
    1. Fearon ER, Vogelstein B. A genetic model for colorectal tumorigenesis. Cell. 1990;61:759–767. doi: 10.1016/0092-8674(90)90186-I. - DOI - PubMed

Publication types

MeSH terms