. 2020 Dec 10:9:e59419.
doi: 10.7554/eLife.59419.

TFEB/Mitf links impaired nuclear import to autophagolysosomal dysfunction in C9-ALS

Affiliations

TFEB/Mitf links impaired nuclear import to autophagolysosomal dysfunction in C9-ALS

Kathleen M Cunningham et al. Elife. .

Abstract

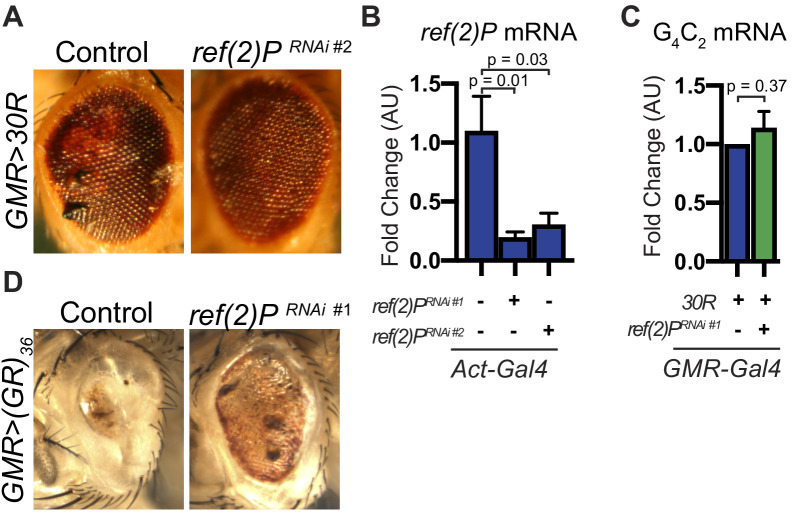
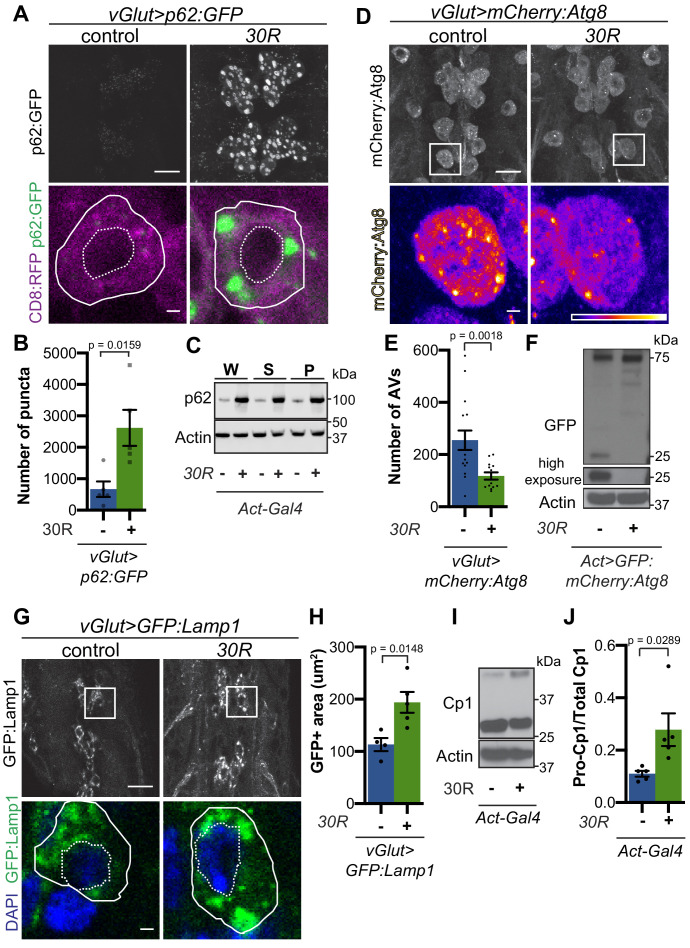
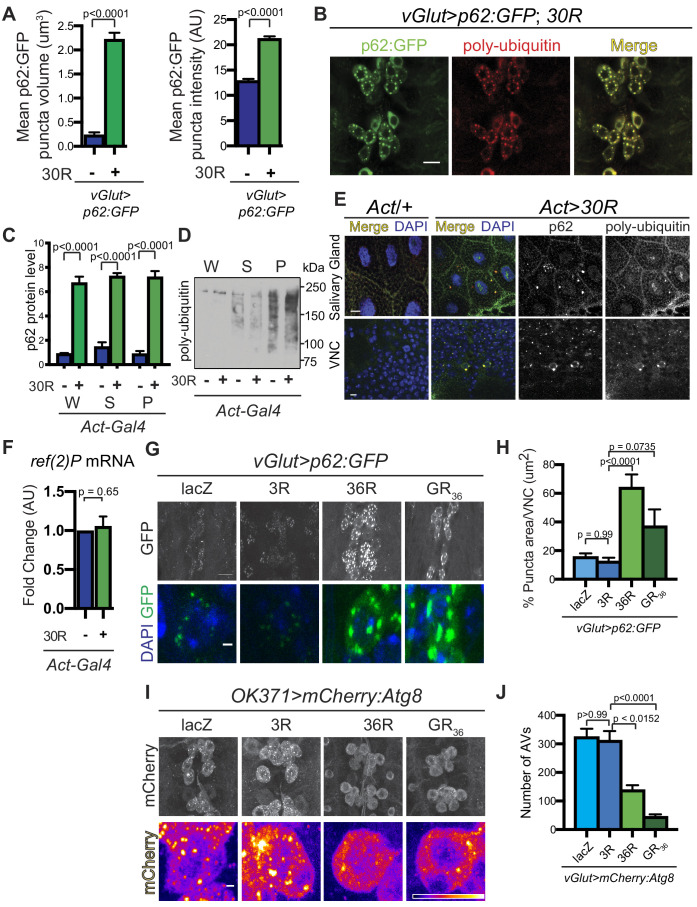
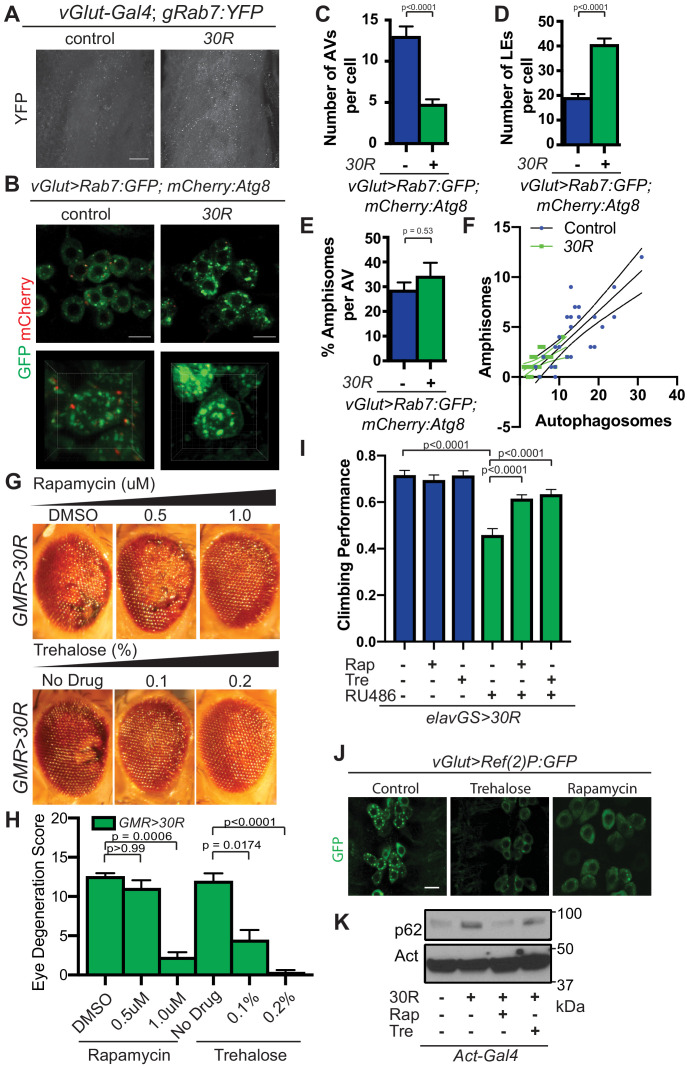
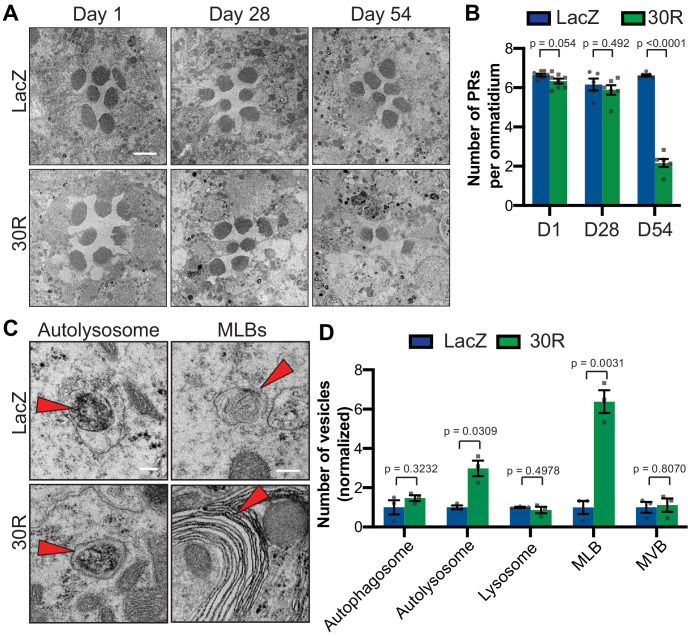
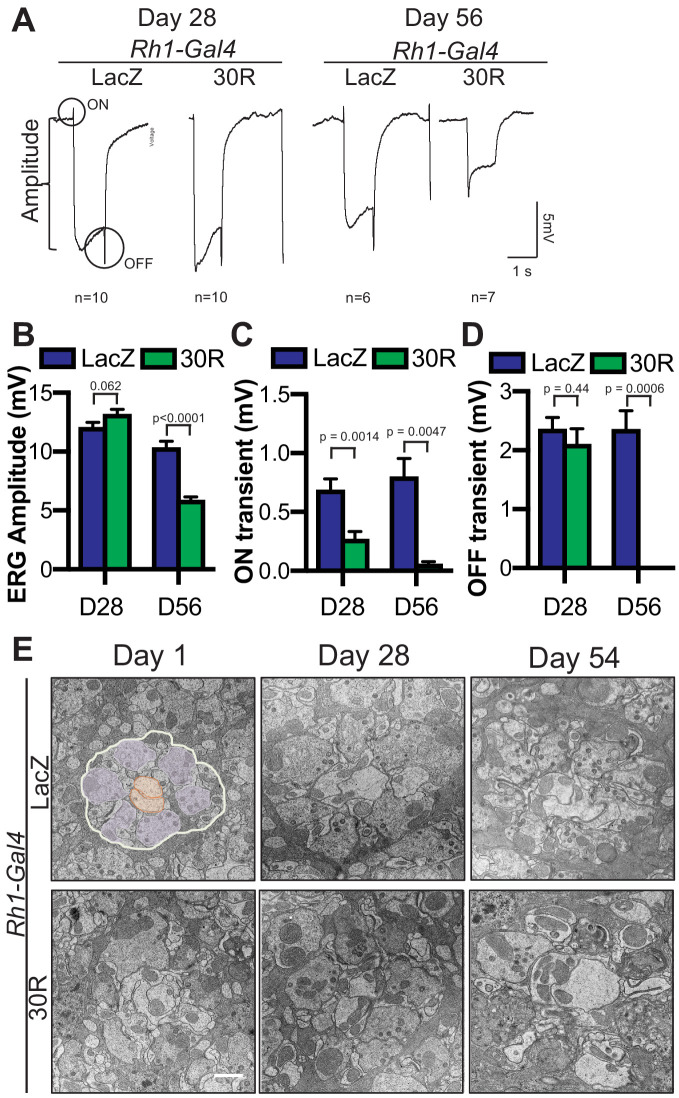
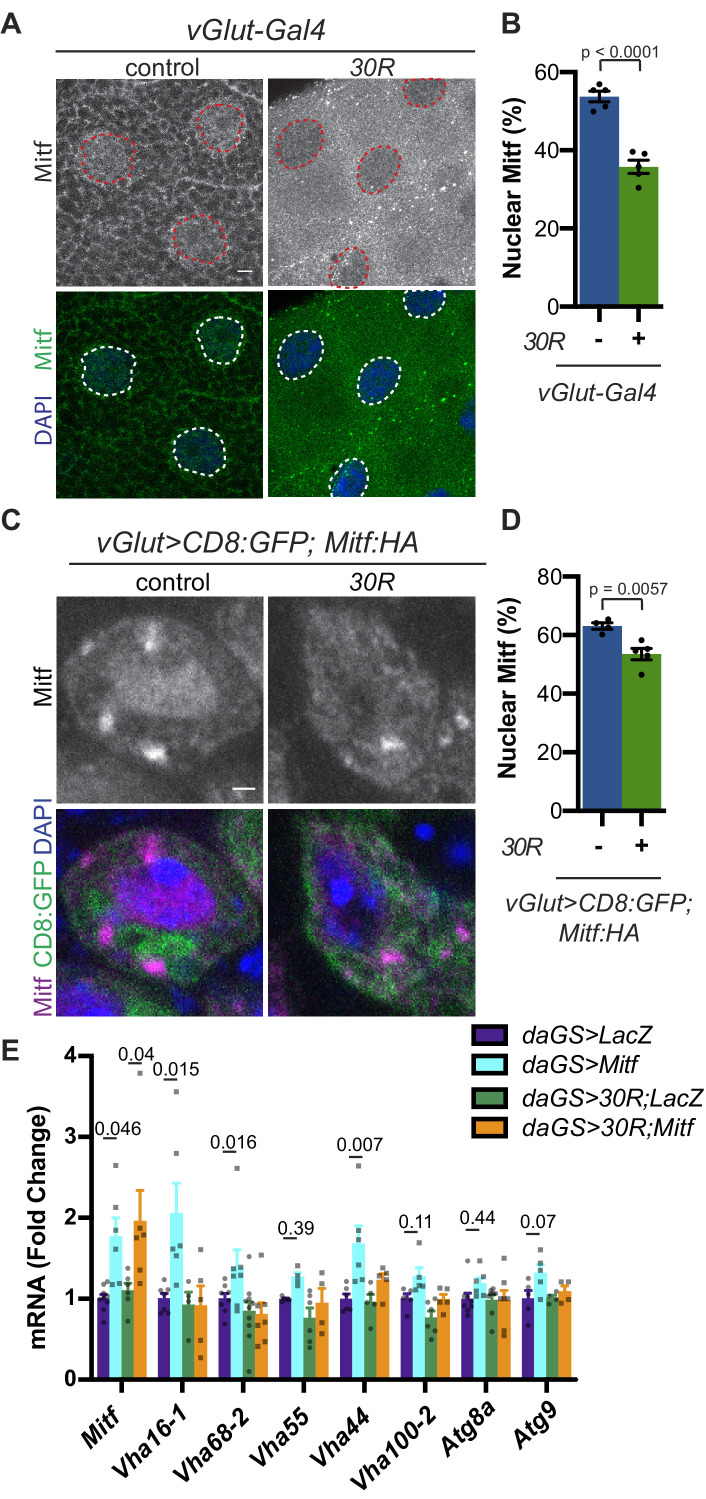
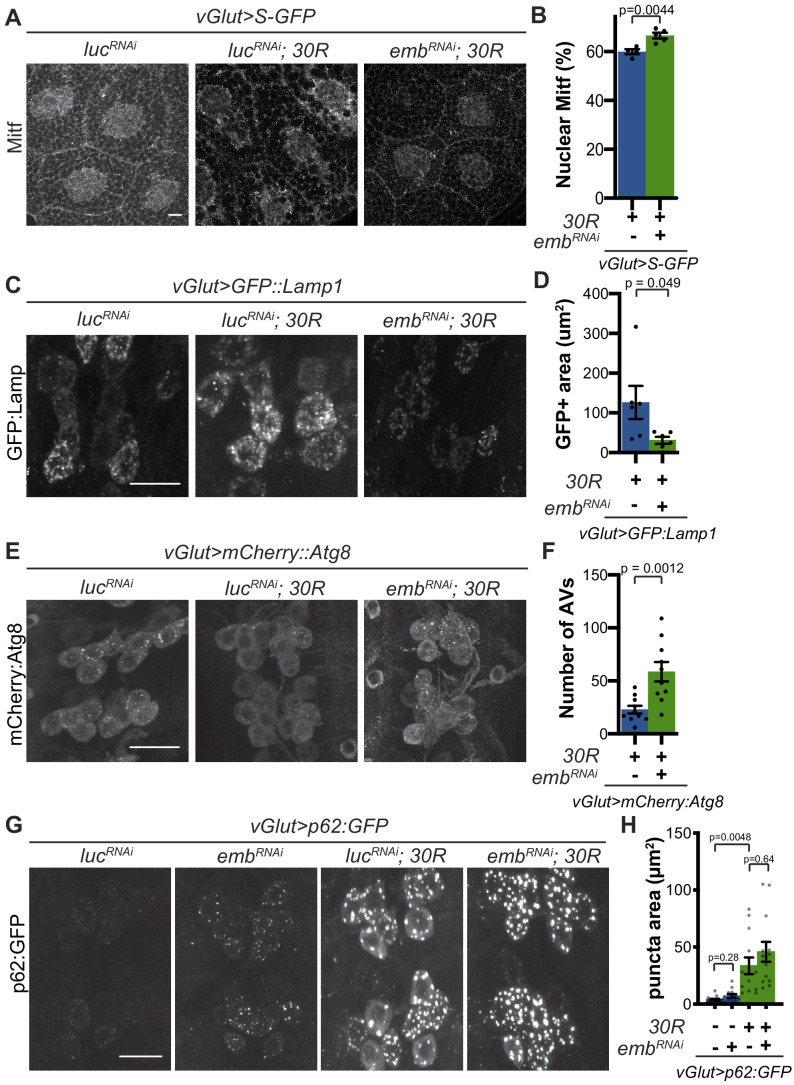
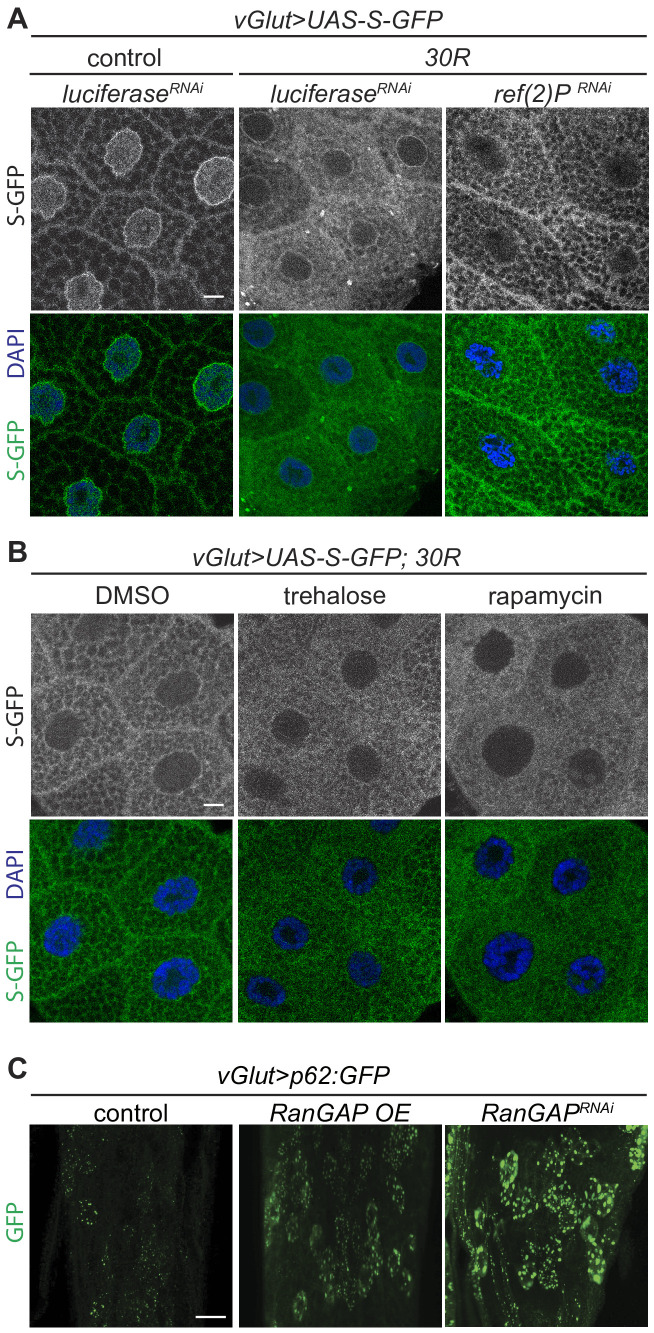
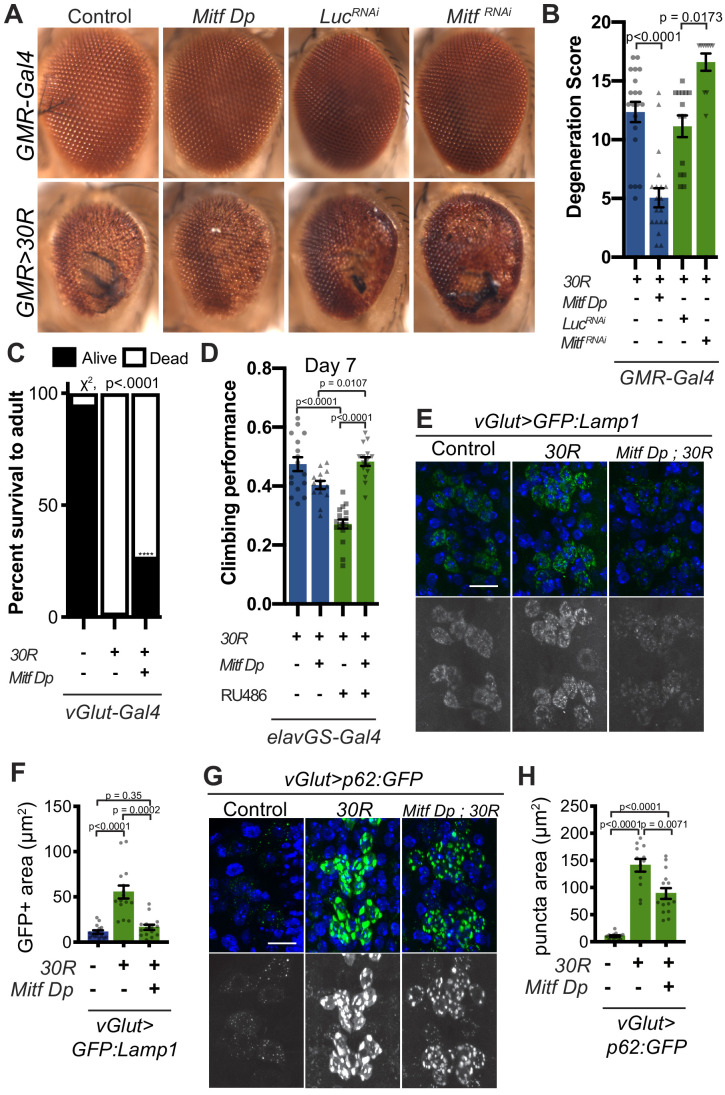
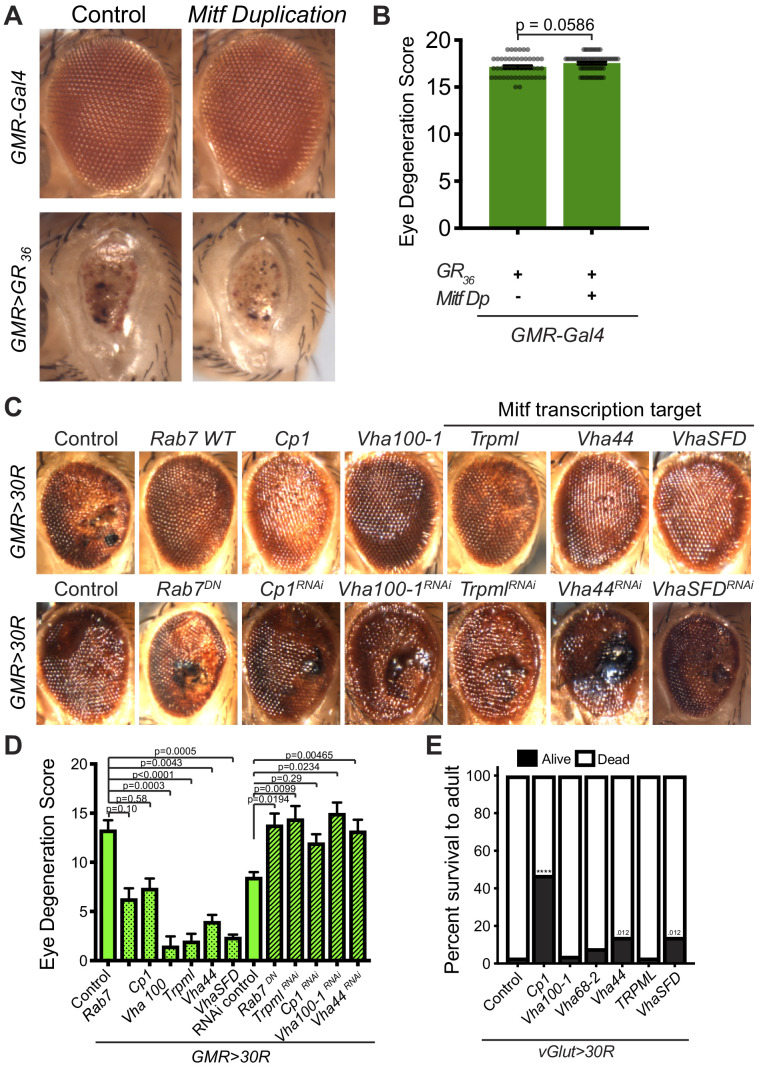
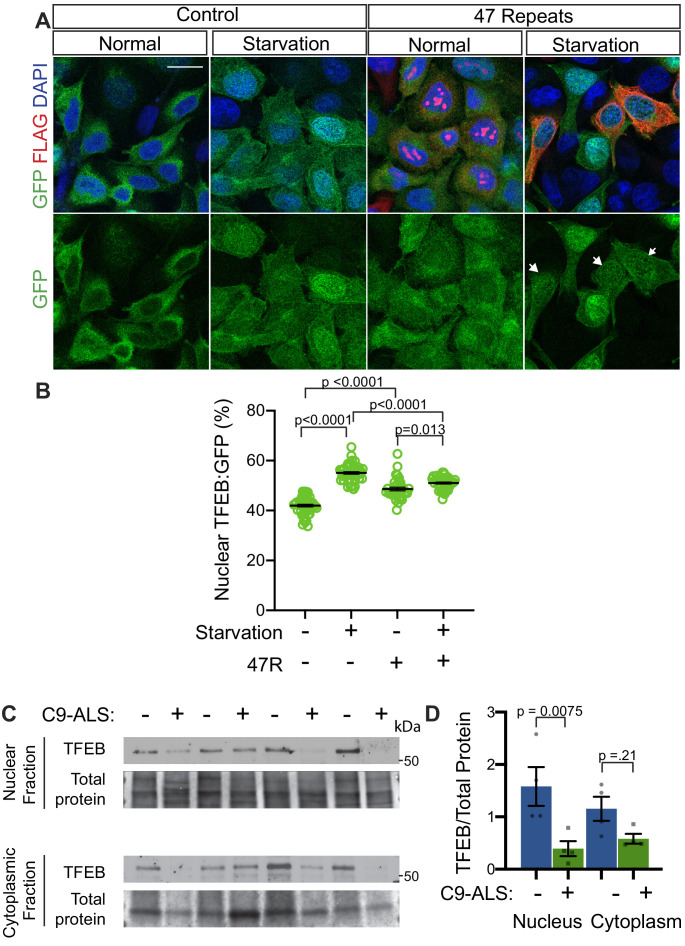
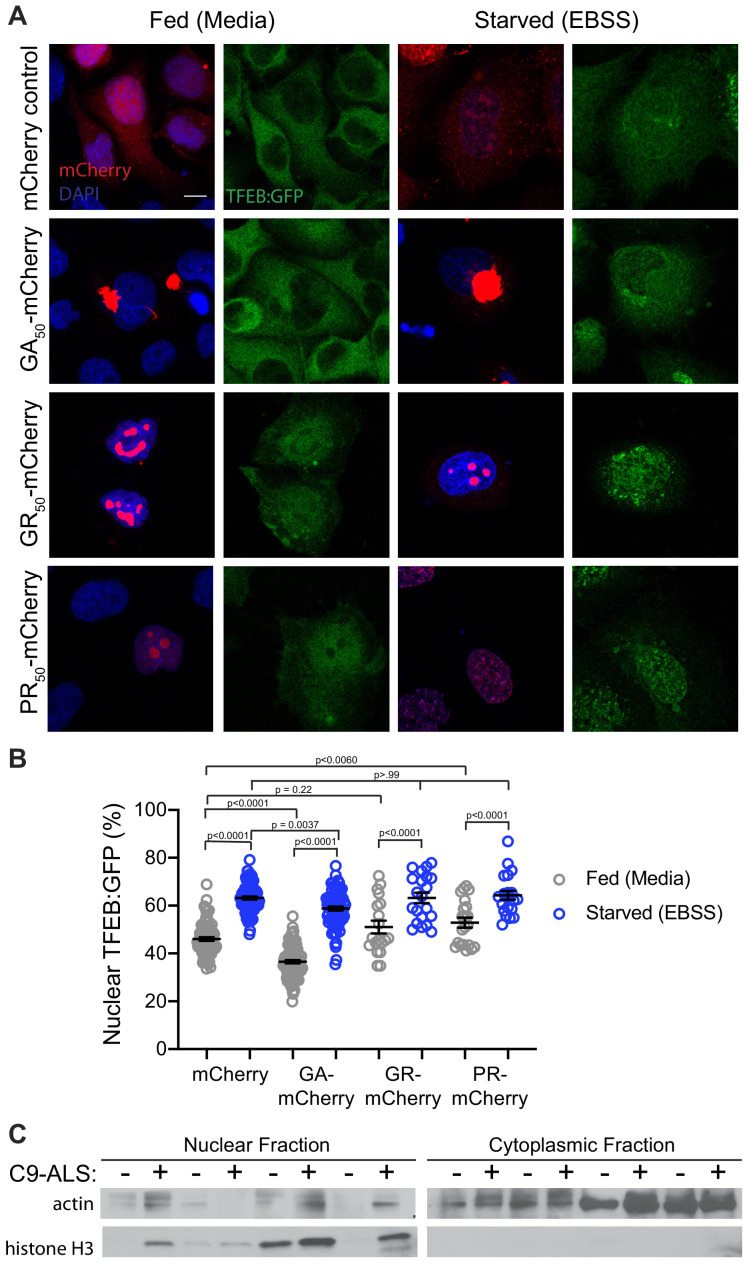
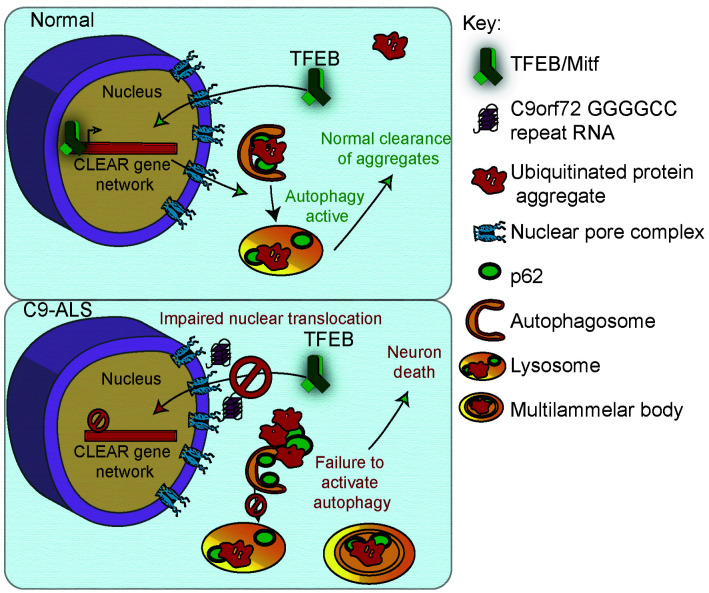
Disrupted nucleocytoplasmic transport (NCT) has been implicated in neurodegenerative disease pathogenesis; however, the mechanisms by which disrupted NCT causes neurodegeneration remain unclear. In a Drosophila screen, we identified ref(2)P/p62, a key regulator of autophagy, as a potent suppressor of neurodegeneration caused by the GGGGCC hexanucleotide repeat expansion (G4C2 HRE) in C9orf72 that causes amyotrophic lateral sclerosis (ALS) and frontotemporal dementia (FTD). We found that p62 is increased and forms ubiquitinated aggregates due to decreased autophagic cargo degradation. Immunofluorescence and electron microscopy of Drosophila tissues demonstrate an accumulation of lysosome-like organelles that precedes neurodegeneration. These phenotypes are partially caused by cytoplasmic mislocalization of Mitf/TFEB, a key transcriptional regulator of autophagolysosomal function. Additionally, TFEB is mislocalized and downregulated in human cells expressing GGGGCC repeats and in C9-ALS patient motor cortex. Our data suggest that the C9orf72-HRE impairs Mitf/TFEB nuclear import, thereby disrupting autophagy and exacerbating proteostasis defects in C9-ALS/FTD.

Keywords: D. melanogaster; amyotrophic lateral sclerosis; autophagy; c9orf72; cell biology; lysosome; neuroscience; nuclear pore; nucleocytoplasmic transport.


Conflict of interest statement

KC, KM, KR, MS, JG, HS, ZZ, HS, JG, SD, JR, KZ, TL No competing interests declared, HB Reviewing editor, eLife

Figures

Figure 1.
Figure 1.. Autophagy receptor Ref(2)P/p62 genetically suppresses G4C2-HRE-mediated degeneration.
(A) 15-day-old Drosophila eyes expressing GMR-Gal4 +/- UAS-30R (GMR>30R) with RNAi background (control), ref(2)P RNAi#1 or overexpression (OE) of ref(2)P. (B) Quantification of external eye degeneration in A by semi-quantitative scoring system. Data are reported as mean ± SEM. Kruskal-Wallis test, p<0.0001, followed by Dunn’s multiple comparisons, n 15 adults. (C) 15-day-old Drosophila eyes expressing GMR-Gal4 +/- UAS-36R (GMR >36R) along with UAS-luciferase RNAi (control), UAS-ref(2)P RNAi #1, UAS-ref(2)P RNAi #2, or UAS-ref(2)P OE. (D) Quantification of external eye degeneration in C by semi-quantitative scoring system. Data are reported as mean ± SEM. Kruskal-Wallis test, p<0.0001, followed by Dunn’s multiple comparisons, n = 23, 62, 28, 10 adults respectively. (E) Percent of pupal eclosion of adult flies expressing the motor neuron driver vGlut-Gal4 +/- UAS-30R and RNAi background control or UAS-ref(2)P RNAi #1. Fisher’s exact test, n 100 pupa. (F) Percent of pupal eclosion of adult flies expressing the motor neuron driver vGlut-Gal4 +/- UAS-44R along with UAS-luciferase RNAi, UAS-ref(2)P RNAi #1, or UAS-ref(2)P OE. Fisher’s exact test, n > 55 pupa. (G) Adult Drosophila expressing UAS-30R under the control of the inducible, pan-neuronal elavGS induced with 200 µM RU486 or vehicle alone and co-expressing control or UAS-ref(2)P RNAi #1. Data are reported as mean ± SEM. One-way ANOVA, ****p<0.0001, with Sidak’s multiple comparisons test, n = 9, 8, 8, 8 groups of 10 flies.
Figure 1—figure supplement 1.
Figure 1—figure supplement 1.. Ref(2)P/p62 genetically modifies G4C2-HRE.
(AGMR >30R expressing fly eyes at 15 days of age crossed to control (Canton S) or UAS-ref(2)P RNAi #2, demonstrating suppression of 30R-mediated eye degeneration with ref(2)P knockdown. (B) Levels of ref(2)P mRNA measured by quantitative RT-PCR in Drosophila expressing UAS-30R under the control of Act-Gal4 with UAS-ref(2)p RNAi #1 or UAS-ref(2)p RNAi #2. Data are presented as mean ± SEM. One-way ANOVA, p=0.0105 followed by Sidak’s multiple comparisons, n = 5 per genotype. (C) Levels of G4C2 mRNA measured by quantitative RT-PCR in flies expressing UAS-30R under the control of GMR-Gal4 either with or without UAS-ref(2)P RNAi. Data are presented as mean ± SEM. Student’s t-test, n = 3 per genotype. (D) GMR-Gal4 expressing an alternate codon UAS-poly(GR)36 alone (control) or co-expressed with UAS-ref(2)P RNAi #1 at 15 days of age.
Figure 2.
Figure 2.. G4C2 repeat expression impairs autophagic flux.
(A) Drosophila motor neurons expressing UAS-p62:GFP +/- UAS-30R, showing multiple motor neuron cell bodies (top) or a representative cell co-expressing the membrane marker CD8:RFP (bottom). Plasma membrane outlined with solid white line; nucleus outlined with dotted line. Scale bar = 10 µm (top), 1 µm (bottom) (B) Quantification of number of p62:GFP puncta in Drosophila motor neuron cell bodies. Data are reported as mean ± SEM. Mann-Whitney test, n = 5 larvae per genotype. (C) Western blot of anti-p62 and anti-beta-actin showing the whole (W), supernatant (S) and pellet (P) fractions of lysates from Drosophila larvae ubiquitously expressing -/+ UAS-30R under the control of Act-Gal4. (D) Drosophila motor neurons expressing UAS-mCherry:Atg8 -/+ UAS-30R showing cell bodies (top) with an example single cell highlighting mCherry:Atg8-positive puncta (bottom). Scale bar = 10 µm (top), 1 µm (bottom). (E) Quantification of mCherry:Atg8-positive autophagic vesicles (AVs) in the ventral nerve cord of vGlut-Gal4/+ or vGlut >30R expressing flies. Data are reported as mean ± SEM. Mann-Whitney test, n = 16 and 13 larvae, respectively. (F) Western blot of anti-GFP and anti-beta-actin of lysates from whole Drosophila larvae ubiquitously expressing UAS-GFP:mCherry:Atg8 -/+ UAS-30R under the control of Act-Gal4 showing full length GFP:mCherry:Atg8 at 75 kDa and cleaved GFP at 25 kDa. (G) Drosophila motor neurons expressing UAS-GFP:Lamp1 (with N-terminal [luminal] GFP) -/+ UAS-30R under the control of vGlut-Gal4 in multiple cell bodies (top) or in a representative cell (bottom). Scale bar = 10 µm (top), 1 µm (bottom). (H) Quantification of GFP:Lamp1 positive area in G. Data are reported as mean ± SEM. Student’s t-test, n = 5 larvae. (I) Western of whole Act-Gal4 Drosophila larvae -/+ UAS-30R blotted for the lysosomal protease Cp1, showing pro- (inactive, upper band) and cleaved (active, lower band) Cp1. (J) Quantification of the ratio of pro-Cp1 to total Cp1 in I. Data are reported as mean ± SEM. Student’s t-test, n = 5 biological replicates.
Figure 2—figure supplement 1.
Figure 2—figure supplement 1.. p62:GFP accumulates in C9-ALS fly models and co-localizes with poly-ubiquitin.
(A) Quantification of mean volume and intensity of p62:GFP puncta in vGlut/+ or vGlut >30R motor neuron cell bodies. Data are presented as mean ± SEM. Student’s t-test with Welch’s correction, n = 5 per genotype. (B) Drosophila vGlut-Gal4 motor neurons expressing UAS-30R and UAS-p62:GFP (green) co-stained with anti-poly-ubiquitin (red). Scale bar = 10 µm. (C) Quantification of p62 levels in the whole (W), supernatant (S) and pellet (P) fractions of lysates from Drosophila L3 larvae ubiquitously expressing UAS-30R under the control of Act-Gal4 shown in western blot in Figure 2C. One-way ANOVA, p<0.0001, followed by Sidak’s multiple comparisons, n = 3 per genotype. (D) Western blot of anti-poly-ubiquitin showing the whole (W), supernatant (S) and pellet (P) fractions of Drosophila L3 larvae ubiquitously expressing 30R under the control of Act-Gal4. (E) Drosophila L3 Act-Gal4/+ or Act > 30R larvae ubiquitously expressing G4C2 repeats showing anti-p62 (red) and anti-ubiquitin (green) staining in the larval salivary gland (top) and ventral nerve cord (VNC) (bottom). Scale bar = 10 µm. (F) Levels of ref(2)P RNA measured by quantitative RT-PCR in lysates from Drosophila larva expressing UAS-30R ubiquitously under control of Actin-Gal4. Data are presented as mean ± SEM. Student’s t-test, n = 5 per genotype. (G) vGlut >p62:GFP showing motor neurons of the VNC (top) or a representative cell body (bottom) with two control (UAS-LacZ or UAS-3R) and two alternate C9-ALS model lines, one expressing a G4C2 repeat expansion (UAS-36R) and another expressing the dipeptide-repeat protein polyGR (UAS-poly(GR)36) using alternate codons. Top panels, scale bar = 10 µm; bottom panels, scale bar = 1 µm. (H) Quantification of the total GFP+ area of p62:GFP positive puncta in G. Data are presented as mean ± SEM. One-way ANOVA, p<0.0001, with Sidak’s multiple comparisons, n = 13–18 larva per genotype. (I) vGlut >mCherry:Atg8 showing the VNC (top) or a representative cell body (bottom) with two control overexpression (UAS-LacZ or UAS-3R) and two alternate C9-ALS model lines, one expressing a G4C2 repeat expansion (UAS-36R) and another expressing the alternate codon arginine dipeptide GR (UAS-poly(GR)36). Top panels, scale bar represents 10 µm; bottom panels, scale bar = 1 µm. (J) Quantification of mCherry:Atg8 puncta in the motor neuron cell bodies in I. Kruskal-Wallis test, p<0.0001, followed by Dunn’s multiple comparisons, n = 13 larva per genotype. Data are presented as mean ± SEM.
Figure 2—figure supplement 2.
Figure 2—figure supplement 2.. Rescuing G4C2-mediated lysosome defects reduces neurodegeneration.
(A) vGlut/+ or vGlut >30R with genomically tagged Rab7:YFP (gRab7:YFP) in the L3 larval ventral nerve cord (VNC). Scale bar = 10 µm (B) Control vGlut motor neurons co-expressing Rab7:GFP and -mCherry:Atg8 in the VNC (top) or a representative single cell (bottom). Scale bar = 10 µm (C) Quantification of number of Atg8 positive autophagic vesicles (AV) per cell. Data are presented as mean ± SEM. Mann-Whitney test, n = 29 and 24 cells, respectively. (D) Quantification of number of Rab7 positive late endo/lysosomes (LE) per cell. Data are presented as mean ± SEM. Mann-Whitney test, n = 29 and 24 cells, respectively. (E) Number of amphisomes (co-localized mCherry:Atg8 and Rab7:GFP puncta) per cell normalized to the total number of autophagosomes. Data are presented as mean ± SEM. Mann-Whitney test, n = 29 and 24 cells respectively. (F) Number of amphisomes (co-localized mCherry:Atg8 and Rab7:GFP puncta) plotted against number of autophagic vesicles for vGlut/+ control and vGlut >30R motor neurons. Curves represent simple linear regression for each genotype. (G) Eyes from15-day-old Drosophila expressing UAS-30R under the control of GMR-Gal4 fed with increasing concentrations of rapamycin (DMSO, 0.5 µM, or 1 µM) and trehalose (no drug, 0.1%, or 0.2%). (H) Quantification of eye degeneration in G. Data are presented as mean ± SEM. Kruskal-Wallis test, p<0.0001, followed by Dunn’s multiple comparisons, n = 10 per genotype. (I) Adult Drosophila expressing UAS-30R under the control of the inducible, pan-neuronal elavGS driver induced with 200 µM RU486 have decreased climbing ability at 7 days compared to non-induced controls, which is rescued by supplementing food with rapamycin or trehalose. One-way ANOVA, p<0.0001, with Sidak’s multiple comparisons test, n = 10 groups of 10 flies per genotype. (J) Drosophila motor neurons expressing UAS-p62:GFP and UAS-30R from 3rd instar larvae fed DMSO (control), 1.0 µM rapamycin, or 0.2% trehalose. (K) Western of lysates from whole Drosophila larvae expressing no repeats or UAS-30R driven by Act-Gal4 and fed DMSO, 1.0 µM rapamycin, or 0.2% trehalose and blotted for p62.
Figure 3.
Figure 3.. Autophagolysosomal defects precede neurodegeneration in photoreceptor neurons.
(A) Transmission electron microscopy (TEM) of rhabdomeres (cell bodies) in Rhodopsin1-Gal4 (Rh1-Gal4) driving UAS-LacZ (control) or UAS-30R at Day 1, Day 28, and Day 54 after eclosion. Scale bar = 2 µm. (B) Quantification of number of healthy (not split) photoreceptors (PRs) per ommatidium in A. Data are reported as mean ± SEM. Student’s t-test, n = 8, 8, 6, 6, 6, and 6 flies, respectively. (C) TEM images at 28 days of Drosophila eyes (rhabdomeres) -/+ 30R repeats expressed by Rh1-Gal4 showing representative autolysosomes and multilamellar bodies (MLBs), marked with red arrows. Scale bar = 200 nm. (D) Quantification of different vesicle types (autophagosomes, autolysosomes, lysosomes, MLBs, and multivesicular bodies (MVBs)) shown in TEM of rhabdomeres with Rh1-Gal4 driving UAS-LacZ or UAS-30R (as in C) normalized to LacZ (control). Data are reported as mean ± SEM. Student’s t-test, n = 3 adults per genotype.
Figure 3—figure supplement 1.
Figure 3—figure supplement 1.. Progressive synapse degeneration in G4C2-expressing photoreceptor neurons.
(A) Representative electroretinogram (ERG) of Rhodopsin1-Gal4 driving UAS-LacZ (control) or UAS-30R in adult eyes at Day 28 or Day 56 after eclosion. (B) Quantification of mean ERG amplitude in A. Data are presented as mean ± SEM. Student’s t-test, n = 10, 10, 6, 7. (C) Quantification of mean ON transient amplitude in (A). (D) Quantification of mean OFF transient amplitude in (A). (E) Transmission electron microscopy (TEM) of terminals (synapses) in Rhodopsin1-Gal4 driving UAS-LacZ (control) or UAS-30R adult eyes at Day 1, Day 28, and Day 54 after eclosion. For the Day 1 control image, presynaptic terminals are pseudocolored in purple and post-synaptic terminals are pseudocolored in orange. Scale bar = 1 µm.
Figure 4.
Figure 4.. Mitf/TFEB is mislocalized from the nucleus and inactivated.
(A) Drosophila larval salivary glands -/+ UAS-30R under the control of vGlut-Gal4 stained with anti-Mitf and DAPI. Dotted lines outline nuclei. Scale bar = 10 µm. (B) Quantification of percent (%) nuclear Mitf (nuclear Mitf fluorescence/total fluorescence) in A. Data are reported as mean ± SEM. Student’s t-test, n = 5 larvae per genotype. (C) Drosophila motor neurons (MNs) expressing UAS-Mitf-HA and UAS-CD8:GFP -/+ UAS-30R under the control of vGlut-Gal4 stained with anti-HA, anti-GFP (membrane), and DAPI to show nuclear localization. Scale bar = 1 µm. (D) Quantification of percent (%) nuclear Mitf in C. Data are reported as mean ± SEM. Student’s t-test, n = 4 and 5 larvae, respectively, with at least 10 motor neurons per larva. (E) Quantitative RT-PCR to assess transcript levels of Mitf and seven target genes from lysates of Drosophila heads expressing control (UAS-LacZ) or UAS-30R driven by daGS in control conditions or with overexpression of Mitf. Data are reported as mean ± SEM. One-way ANOVA, p<0.0001, with Sidak’s multiple comparisons test, n > 4 biological replicates of 30 heads per genotype.
Figure 5.
Figure 5.. Modulation of nucleocytoplasmic transport rescues autophagolysosome dysfunction.
(A) Drosophila larval salivary glands stained with anti-Mitf and DAPI expressing +/- UAS-30R, UAS-shuttle-GFP (S-GFP, not shown), and either control RNAi (UAS-lucRNAi) or exportin RNAi (UAS-embRNAi ) under the control of vGlut-Gal4. Scale bar = 10 µm (B) Quantification of percent (%) nuclear Mitf in A. Data are reported as mean ± SEM. Student’s t-test, n = 4 and 5 larvae, respectively. (C) Drosophila motor neurons expressing UAS-GFP:Lamp1 (N-terminal, luminal GFP) -/+ UAS-30R and UAS-lucRNAi or exportin RNAi (UAS-embRNAi ). Scale bar = 10 µm. (D) Quantification of C. Student’s t-test, n = 6 larvae. (E) Drosophila motor neurons expressing UAS-mCherry:Atg8 +/- UAS-30R and either control RNAi (UAS-lucRNAi) or exportin RNAi (UAS-embRNAi ). Scale bar = 10 µm. (F) Quantification of E. Data are reported as mean ± SEM. Mann-Whitney test, n = 10 larvae. (G) Drosophila motor neurons expressing UAS-p62:GFP -/+ UAS-30R and either control RNAi (lucRNAi) or exportin RNAi (embRNAi ) under the control of vGlut-Gal4. Scale bar = 10 µm. (H) Quantification of G. Data are reported as mean ± SEM. Brown-Forsythe and Welch ANOVA test, p<0.0001, followed by Dunnett’s T3 multiple comparisons, n = 12–14 larvae per genotype.
Figure 5—figure supplement 1.
Figure 5—figure supplement 1.. Nucleocytoplasmic transport disruption is upstream of autophagic defects.
(A) Images of the nucleocytoplasmic transport marker shuttle-GFP (S-GFP) in control and vGlut > 30R with either UAS-luciferase (control) or UAS-Ref(2)P RNAi #1 expressed in Drosophila salivary glands. (B) Images of L3 salivary gland expressing UAS-S-GFP in vGlut > 30R Drosophila after feeding supplemented with control (DMSO), 0.2% trehalose, or 1.0 µm rapamycin. (C) Representative images of ventral nerve cords expressing control, knockdown of RanGAP (UAS-RanGAPRNAi), or overexpression of RanGAP (UAS-RanGAP), along with UAS-p62:GFP in vGlut motor neurons. Scale bars = 10 µm.
Figure 6.
Figure 6.. Transcription factor Mitf/TFEB suppresses neurodegeneration caused by G4C2 expansion via lysosome activity.
(A) 15-day-old Drosophila eyes expressing UAS-30R under the control of GMR-Gal4, crossed to controls (w1118 or UAS-luciferase RNAi), genomic Mitf Duplication (Mitf Dp), or UAS-Mitf RNAi. (B) Quantification of external eye degeneration shown in A. Data are reported as mean ± SEM. Kruskal-Wallis test, p<0.0001, followed by Dunn’s multiple comparisons, n = 10–20 adults per genotype. (C) Percent of pupal eclosion in Drosophila expressing UAS-30R under the control of vGlut-Gal4 -/+ Mitf Dp compared to vGlut-Gal4/w1118 control. Fisher’s exact test, n = 133, 139, and 84 pupae, respectively. (D) Adult Drosophila expressing UAS-30R under the control of the inducible, pan-neuronal elavGS driver induced with 200 µM RU486 have decreased climbing ability at 7 days of age. Co-expressing Mitf Dp with UAS-30R rescues climbing ability. One-way ANOVA, p<0.0001, followed by Sidak’s multiple comparisons, n = 14–17 groups of 10 flies per genotype. (E) Representative images of motor neurons expressing UAS-GFP:Lamp1 for control (w1118), UAS-30R, or coexpressing Mitf Dp and UAS-30R. Scale bar = 10 µm (F) Quantification of the GFP positive (GFP+) area of GFP:Lamp1 in E. Data are reported as mean ± SEM. Brown-Forsythe and Welch ANOVA, p<0.0001, test followed by Dunnett’s T3 multiple comparisons, n = 15 per genotype. (G) Representative images of motor neurons coexpressing UAS-p62:GFP with no repeats (control, w1118), UAS-30R, and Mitf Dp with UAS-30R. Scale bar = 10 µm. (H) Quantification of p62:GFP GFP+ puncta area in F. Data are reported as mean ± SEM. Brown-Forsythe and Welch ANOVA test, p<0.0001, followed by Dunnett’s T3 multiple comparisons, n = 12–14 larvae per genotype.
Figure 6—figure supplement 1.
Figure 6—figure supplement 1.. Genetic increase of lysosome function rescues degeneration caused by G4C2 expression but not by poly-GR.
(A) 15-day-old Drosophila eyes expressing poly-GR36 under the control of the GMR-Gal4 with control (w1118) or Mitf Dp. (B) Quantification of external eye degeneration in A. Data are presented as mean ± SEM. Mann-Whitney test, n = 48 and 59 adult flies. (C) 15-day-old Drosophila eyes expressing UAS-30R under the control of the GMR-Gal4 driver accompanying overexpression (top) or knockdown (bottom) of lysosomal genes. (D) Quantification of external eye degeneration in A. Data are presented as mean ± SEM. Kruskal-Wallis test, p<0.0001 (left) and p=0.0202 (right) followed by Dunn’s multiple comparisons, n = 10, 10, 10, 10, 8, 4, 5, 8, 6, 10, 9, 10, 4, and 10 adult flies, respectively. (E) Percent of pupal eclosion in Drosophila expressing UAS-30R under the control of the motor neuron vGlut-Gal4 driver with UAS-lacZ (control) or overexpression of lysosomal genes. Fisher’s exact test, n = 89, 120, 88, 146, 119, 123, and 105 pupa.
Figure 7.
Figure 7.. Nuclear TFEB is reduced in human cells expressing GGGGCC repeats and in C9-ALS human motor cortex.
(A) HeLa cells stably expressing TFEB:GFP transfected with 0R (Control) or a 47R construct (Flag tag in frame with poly-GR) in normal media (DMEM) or starved (3 hr in EBSS) conditions. White arrowheads indicate transfected cells in the 47R starved group. (B) Quantification of cells from A showing the percent (%) nuclear TFEB:GFP (nuclear/total) for each group. Data are presented as mean + SEM. One-way ANOVA, p<0.0001, with Sidak’s multiple comparisons, n = 47, 47, 35, and 38 cells. (C) Western blot for TFEB of human motor cortex samples fractionated into cytoplasmic and nuclear samples from postmortem control and C9-ALS patient brains. (D) Quantification of TFEB levels against total protein loading (Faststain) in control and C9-ALS patients. Data reported are mean ± SEM. One-way ANOVA, p=0.0142, with Sidak’s multiple comparisons, n = 4.
Figure 7—figure supplement 1.
Figure 7—figure supplement 1.. DPRs affect TFEB import in HeLa Cells.
(A) Representative images of transfection of codon-optimized poly-GA-mCherry, poly-GR-mCherry, and poly-PR-mCherry into HeLa cells with stably incorporated TFEB:GFP. (B) Quantification of percent nuclear TFEB:GFP in A. Data are presented as mean ± SEM. One-way ANOVA, p<0.0001, with Sidak’s multiple comparisons n = 80, 90, 92, 84, 19, 21, 21, and 21 cells, respectively. Scale bars = 20 µm. (C) Nuclear and cytoplasmic fractions of human motor cortex samples in Figure 7C blotted for cytoplasmic (beta-actin) and nuclear (histone H3) control proteins.
Figure 8.
Figure 8.. A proposed model of GGGGCC repeat expansion pathogenesis.
G4C2 repeat expansion causes nucleocytoplasmic transport disruption through multiple proposed mechanisms including G4C2 RNA binding of RanGAP and stress granule recruitment of nucleocytoplasmic transport machinery. Transport disruption leads to a blockage in the translocation of autophagy-mediating transcription factors such as Mitf/TFEB to the nucleus in response to proteotoxic stress. Failure to induce autophagic flux leads to autophagy pathway disruption such as the accumulation of large, non-degradative lysosomes and MLBs. Loss of autophagic flux leads to accumulation of Ref(2)P/ p62 and ubiquitinated protein aggregates, leading to chronic protein stress signaling and eventually neuronal cell death.
Author response image 1.
Author response image 1.. Multiple commercially available TFEB antibodies fail to show specific staining as demonstrated by lack of reduced staining with TFEB siRNA.
HEK293T cells stained with (A) Abcam anti-TFEB ab174745, (B) Bethyl anti-TFEB A303-673A and (C) Proteintech 13372-1-AP in control (left) or transfected with TFEB siRNA (ONTarget-Plus, Dharmacon) (right).
Author response image 2.
Author response image 2.. Multiple commercially available TFEB antibodies fail to show specific staining as demonstrated by lack of increase in nuclear localization of TFEB after treatment with Torin1, an mTOR inhibitor known to induce nuclear translocation of TFEB.
HEK293T cells stained with (A) Abcam anti-TFEB ab174745, (B) Bethyl anti-TFEB A303-673A and (C) Proteintech 13372-1-AP in control (left) or treated with 2μm Torin for 2 hours.

Similar articles

Cited by

References

    1. Al-Sarraj S, King A, Troakes C, Smith B, Maekawa S, Bodi I, Rogelj B, Al-Chalabi A, Hortobágyi T, Shaw CE. p62 positive, TDP-43 negative, neuronal cytoplasmic and intranuclear inclusions in the cerebellum and Hippocampus define the pathology of C9orf72-linked FTLD and MND/ALS. Acta Neuropathologica. 2011;122:691–702. doi: 10.1007/s00401-011-0911-2. - DOI - PubMed
    1. Almeida S, Gascon E, Tran H, Chou HJ, Gendron TF, Degroot S, Tapper AR, Sellier C, Charlet-Berguerand N, Karydas A, Seeley WW, Boxer AL, Petrucelli L, Miller BL, Gao FB. Modeling key pathological features of frontotemporal dementia with C9ORF72 repeat expansion in iPSC-derived human neurons. Acta Neuropathologica. 2013;126:385–399. doi: 10.1007/s00401-013-1149-y. - DOI - PMC - PubMed
    1. Balendra R, Isaacs AM. C9orf72-mediated ALS and FTD: multiple pathways to disease. Nature Reviews Neurology. 2018;14:544–558. doi: 10.1038/s41582-018-0047-2. - DOI - PMC - PubMed
    1. Bharadwaj R, Cunningham KM, Zhang K, Lloyd TE. FIG4 regulates lysosome membrane homeostasis independent of phosphatase function. Human Molecular Genetics. 2016;25:681–692. doi: 10.1093/hmg/ddv505. - DOI - PMC - PubMed
    1. Boeynaems S, Bogaert E, Michiels E, Gijselinck I, Sieben A, Jovičić A, De Baets G, Scheveneels W, Steyaert J, Cuijt I, Verstrepen KJ, Callaerts P, Rousseau F, Schymkowitz J, Cruts M, Van Broeckhoven C, Van Damme P, Gitler AD, Robberecht W, Van Den Bosch L. Drosophila screen connects nuclear transport genes to DPR pathology in c9ALS/FTD. Scientific Reports. 2016;6:20877. doi: 10.1038/srep20877. - DOI - PMC - PubMed

Publication types

MeSH terms

Substances