Longitudinal data in peripheral blood confirm that PM20D1 is a quantitative trait locus (QTL) for Alzheimer's disease and implicate its dynamic role in disease progression
- PMID: 33298155
- PMCID: PMC7724832
- DOI: 10.1186/s13148-020-00984-5
Longitudinal data in peripheral blood confirm that PM20D1 is a quantitative trait locus (QTL) for Alzheimer's disease and implicate its dynamic role in disease progression
Abstract
Background: While Alzheimer's disease (AD) remains one of the most challenging diseases to tackle, genome-wide genetic/epigenetic studies reveal many disease-associated risk loci, which sheds new light onto disease heritability, provides novel insights to understand its underlying mechanism and potentially offers easily measurable biomarkers for early diagnosis and intervention.
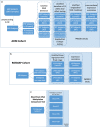
Methods: We analyzed whole-genome DNA methylation data collected from peripheral blood in a cohort (n = 649) from the Alzheimer's Disease Neuroimaging Initiative (ADNI) and compared the DNA methylation level at baseline among participants diagnosed with AD (n = 87), mild cognitive impairment (MCI, n = 175) and normal controls (n = 162), to identify differentially methylated regions (DMRs). We also leveraged up to 4 years of longitudinal DNA methylation data, sampled at approximately 1 year intervals to model alterations in methylation levels at DMRs to delineate methylation changes associated with aging and disease progression, by linear mixed-effects (LME) modeling for the unchanged diagnosis groups (AD, MCI and control, respectively) and U-shape testing for those with changed diagnosis (converters).
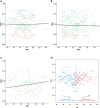
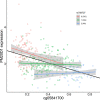
Results: When compared with controls, patients with MCI consistently displayed promoter hypomethylation at methylation QTL (mQTL) gene locus PM20D1. This promoter hypomethylation was even more prominent in patients with mild to moderate AD. This is in stark contrast with previously reported hypermethylation in hippocampal and frontal cortex brain tissues in patients with advanced-stage AD at this locus. From longitudinal data, we show that initial promoter hypomethylation of PM20D1 during MCI and early stage AD is reversed to eventual promoter hypermethylation in late stage AD, which helps to complete a fuller picture of methylation dynamics. We also confirm this observation in an independent cohort from the Religious Orders Study and Memory and Aging Project (ROSMAP) Study using DNA methylation and gene expression data from brain tissues as neuropathological staging (Braak score) advances.
Conclusions: Our results confirm that PM20D1 is an mQTL in AD and demonstrate that it plays a dynamic role at different stages of the disease. Further in-depth study is thus warranted to fully decipher its role in the evolution of AD and potentially explore its utility as a blood-based biomarker for AD.
Keywords: Alzheimer’s disease; Epigenetics; Mixed-effects model; PM20D1.
Conflict of interest statement
The authors declare that they have no competing interests.
Figures


Similar articles
-
Comprehensive analysis of PM20D1 QTL in Alzheimer's disease.Clin Epigenetics. 2020 Feb 3;12(1):20. doi: 10.1186/s13148-020-0814-y. Clin Epigenetics. 2020. PMID: 32014019 Free PMC article.
-
Harnessing peripheral DNA methylation differences in the Alzheimer's Disease Neuroimaging Initiative (ADNI) to reveal novel biomarkers of disease.Clin Epigenetics. 2020 Jun 15;12(1):84. doi: 10.1186/s13148-020-00864-y. Clin Epigenetics. 2020. PMID: 32539856 Free PMC article.
-
Association of peripheral blood DNA methylation level with Alzheimer's disease progression.Clin Epigenetics. 2021 Oct 15;13(1):191. doi: 10.1186/s13148-021-01179-2. Clin Epigenetics. 2021. PMID: 34654479 Free PMC article.
-
Genetic studies of quantitative MCI and AD phenotypes in ADNI: Progress, opportunities, and plans.Alzheimers Dement. 2015 Jul;11(7):792-814. doi: 10.1016/j.jalz.2015.05.009. Alzheimers Dement. 2015. PMID: 26194313 Free PMC article. Review.
-
Sixteen-Year Longitudinal Evaluation of Blood-Based DNA Methylation Biomarkers for Early Prediction of Alzheimer's Disease.J Alzheimers Dis. 2023;94(4):1443-1464. doi: 10.3233/JAD-230039. J Alzheimers Dis. 2023. PMID: 37393498 Free PMC article. Review.
Cited by
-
The Role of Magnesium in Parkinson's Disease: Status Quo and Implications for Future Research.Int J Mol Sci. 2024 Aug 1;25(15):8425. doi: 10.3390/ijms25158425. Int J Mol Sci. 2024. PMID: 39125993 Free PMC article. Review.
-
Associations of vitamin D receptor polymorphisms with risk of Alzheimer's disease, Parkinson's disease, and mild cognitive impairment: a systematic review and meta-analysis.Front Aging Neurosci. 2024 Apr 12;16:1377058. doi: 10.3389/fnagi.2024.1377058. eCollection 2024. Front Aging Neurosci. 2024. PMID: 38681668 Free PMC article.
-
Integrative multi-omics analysis reveals the critical role of the PBXIP1 gene in Alzheimer's disease.Aging Cell. 2024 Feb;23(2):e14044. doi: 10.1111/acel.14044. Epub 2023 Nov 20. Aging Cell. 2024. PMID: 37984333 Free PMC article.
-
Dietary Responses of Dementia-Related Genes Encoding Metabolic Enzymes.Nutrients. 2023 Jan 27;15(3):644. doi: 10.3390/nu15030644. Nutrients. 2023. PMID: 36771351 Free PMC article.
-
Multi-task deep autoencoder to predict Alzheimer's disease progression using temporal DNA methylation data in peripheral blood.Comput Struct Biotechnol J. 2022 Oct 23;20:5761-5774. doi: 10.1016/j.csbj.2022.10.016. eCollection 2022. Comput Struct Biotechnol J. 2022. PMID: 36756173 Free PMC article.
References
Publication types
MeSH terms
Substances
Grants and funding
LinkOut - more resources
Full Text Sources
Medical
Molecular Biology Databases
Miscellaneous

