. 2021 Mar 1;218(3):e20200533.
doi: 10.1084/jem.20200533.

Targeting transcriptional coregulator OCA-B/Pou2af1 blocks activated autoreactive T cells in the pancreas and type 1 diabetes

Affiliations

Targeting transcriptional coregulator OCA-B/Pou2af1 blocks activated autoreactive T cells in the pancreas and type 1 diabetes

Heejoo Kim et al. J Exp Med. .

Abstract

The transcriptional coregulator OCA-B promotes expression of T cell target genes in cases of repeated antigen exposure, a necessary feature of autoimmunity. We hypothesized that T cell-specific OCA-B deletion and pharmacologic OCA-B inhibition would protect mice from autoimmune diabetes. We developed an Ocab conditional allele and backcrossed it onto a diabetes-prone NOD/ShiLtJ strain background. T cell-specific OCA-B loss protected mice from spontaneous disease. Protection was associated with large reductions in islet CD8+ T cell receptor specificities associated with diabetes pathogenesis. CD4+ clones associated with diabetes were present but associated with anergic phenotypes. The protective effect of OCA-B loss was recapitulated using autoantigen-specific NY8.3 mice but diminished in monoclonal models specific to artificial or neoantigens. Rationally designed membrane-penetrating OCA-B peptide inhibitors normalized glucose levels and reduced T cell infiltration and proinflammatory cytokine expression in newly diabetic NOD mice. Together, the results indicate that OCA-B is a potent autoimmune regulator and a promising target for pharmacologic inhibition.


Conflict of interest statement

Disclosures: D. Tantin reported a patent (62/666,325). No other disclosures were reported.

Figures

None
Graphical abstract
Figure S1.
Figure S1.
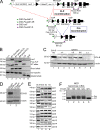
Ocab (Pou2af1) conditional allele. (A) Targeting event. Crossing with FLPRosa26 results in conditional (fl) allele. Primer pairs used for genotyping are depicted with arrows. FRT, flippase recognition target. (B) Example genotyping of the targeted allele and recombination events. The founder animal is in lane 2. The primer pairs shown in A were used. (C) OCA-B immunoblots from spleens of control, fl/fl, and Δ/Δ animals. BJA-B B cell nuclear extract is shown as a positive control (lane 1). (D) The Ocab (Pou2af1) conditional allele was crossed to CD4-cre. Total splenic CD4+ T cells were isolated from an Ocabfl/flCD4-cre animal or a Ocab+/flCD4-cre littermate control, and stimulated for 2 d in vitro using plate-bound CD3ε and soluble CD28 antibodies. An OCA-B immunoblot of stimulated total T cells is shown. β-Actin is shown as a loading control. (E) To generate NOD.Ocab conditional mice by speed congenic backcross, microsatellite repeat polymorphisms at the Idd loci were tested by PCR using the primers in Table S1. Backcross generations 2 and 4 (B2 and B4) are shown (lanes 3 and 4), together with parent C57BL/6 (lane 1) and target NOD (lane 2) genomic DNA as controls. Images are of different PCR products resolved using agarose or PAGE. (F) Example genotyping of Ocab WT and conditional alleles in B4 backcrossed mice. An agarose gel image is shown. Mouse 122 corresponds to the B4 animal shown in B and was used as the founder animal. This animal was crossed with NOD.CD4-cre for subsequent experiments with the conditional allele.
Figure S2.
Figure S2.
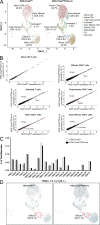
Unaltered T cell populations and TCR representation in prediabetic NOD.Ocabfl/flCD4-cre PLNs compared with NOD.Ocabfl/fl littermate controls. (A) CD3+ T cells were isolated and combined from the PLNs of three 8-wk-old NOD.Ocabfl/flCD4-cre mice or three NOD.Ocabfl/fl littermate controls. scRNAseq was performed. Clusters were overlaid in UMAP plots. DC, dendritic cell. (B) Six different populations from A were analyzed for differential gene expression. Identified genes are shown as scatter plots. Significantly differentially expressed genes (adjusted P value <0.05) are shown in red. ln, natural logarithm. (C) Percentage contribution of individual variable β chains is shown. (D) Trbv13-3–expressing cells are shown in blue superimposed on the same UMAP scRNAseq data as in A. The effector CD8+ T cell cluster is highlighted in red.
Figure 1.
Figure 1.
Loss of OCA-B protects NOD mice from T1D. (A) Kaplan–Meier plot of diabetes-free survival in littermate female NOD.Ocabfl/flCD4-cre (n = 12) and NOD.Ocabfl/fl (n = 14) mice. (B) Average blood glucose levels from mice shown in A. Student’s t test P values: day 23, 0.0458; day 24, 0.0403; and day 25, 0.0494. (C) Percentage of diabetes-free survival in germline knockout NOD.Ocab−/− (n = 16) and control NOD.Ocab+/+ (n = 17) mice was plotted. (D) Pancreatic islet leukocytes were isolated from 8-wk-old or 24-wk-old littermate female NOD.Ocabfl/flCD4-cre (8 wk, n = 3; 24 wk, n = 5) or NOD.Ocabfl/fl (8 wk, n = 3; 24 wk, n = 4) mice and analyzed by flow cytometry. Mean CD45+CD11b+F4/80+ cell frequencies are depicted. Student’s t test P value = 0.0397. (E) Frequencies of CD45+CD11b+F4/80+ cells from representative animals in D are shown. Plots were gated on CD45. (F) Mean percentages of total pancreatic-infiltrating CD8+ T cells in 9 experimental NOD.Ocabfl/flCD4-cre or 11 littermate control NOD.Ocabfl/fl 12-wk-old mice are plotted. Cells were gated on CD45. (G) IFN-γ–expressing CD8+ T cell percentages in 16-wk-old NOD.Ocabfl/flCD4-cre (n = 3) and littermate control islets (n = 5) are shown. Student’s t test P value = 0.0477. All error bars denote ±SEM. *, P ≤ 0.05; ***, P ≤ 0.001. ns, not significant; HR, hazard ratio.
Figure 2.
Figure 2.
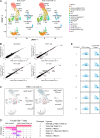
T cell conditional OCA-B loss reduces the numbers of activated, autoreactive pancreatic islet T cells. (A) scRNAseq using total islet CD45+ cells from prediabetic NOD.Ocabfl/flCD4-cre or littermate control NOD.Ocabfl/fl mice (n = 4 for each group). Cell populations were plotted using UMAP (Seurat R package), and percentages in each cluster are shown for each genotype. Clusters were identified using the Seurat R package function FindMarkers. (B) Four clusters from A were analyzed for differential gene expression. Identified genes are shown as a scatter plot. Significantly differentially expressed genes (adjusted P value <0.05) are shown in red. For Cxcl2 in neutrophils, P = 3.75 × 10⁻⁶, adjusted P = 0.055. (C) UMAP plots similar to A, except cells expressing TCR clonotype 13–3 are shown. The nonnaive (activated + memory) CD8+ cell population identified in A is shown in red. (D) Percent contribution of the top six identified TCR clonotypes to total activated + memory CD8+ cells is shown. V genes comprising the clonotypes are shown below. (E) Cells positive for clonotypes 1–5 are shown for two clusters, nonnaive (activated + memory) CD8+ T cells and CTLA4+FR4+ anergic cells (consisting of mostly CD4+ cells). For each cluster, positive cells are shown in dark blue. An overlay of control and OCA-B–deficient cell populations is shown. Each clonotype is only observed in a single genotype (D), allowing all cells to be mapped back entirely to OCA-B–deficient (clonotypes 1 and 4) or control (clonotypes 2, 3, and 5).
Figure S3.
Figure S3.
TCR β-chain representation across the entire population of prediabetic NOD.Ocabfl/flCD4-cre pancreatic islets compared with NOD.Ocabfl/fl littermate controls. Four 12-wk-old mice in each group were combined for scRNAseq TCR analysis.
Figure 3.
Figure 3.
Autoantigen-specific CD8+ cells become nonreactive and fail to infiltrate islets in the OCA-B–deficient condition. (A) Pancreatic leukocytes were isolated from prediabetic 12-wk-old littermate female NOD.Ocabfl/flCD4-cre (n = 9) or NOD.Ocabfl/fl (n = 10) mice and analyzed by flow cytometry. Representative plots (left) and total CD8+Vβ8.1+ T cell numbers (right) are shown. Student’s t test P value = 0.0416. (B) PLN leukocytes were isolated from the same mice (NOD.Ocabfl/flCD4-cre, n = 7 or NOD.Ocabfl/fl, n = 5) as in A. Representative plots (left) and total CD8+Vβ8.1+ T cell frequencies (right) are shown. Student’s t test P value = 0.0355. (C) Representative plots (left) and total cell numbers (right) of CD8+Vβ8.1+ H-2Kd IGRP206-214 tetramer-positive islet T cells are depicted from NOD.Ocabfl/flCD4-cre (n = 9) or NOD.Ocabfl/fl (n = 10). Student’s t test P value = 0.0449. (D) Total PLN WBCs were isolated from prediabetic 12-wk-old littermate NOD.Ocab−/− or NOD.Ocab+/+ mice and restimulated with IGRP peptides (IGRP206-214 or IGRP225-233). Cells were analyzed for IFN-γ expression by flow cytometry. (E) Mean percentages of cells expressing IFN-γ from nine experiments (three replicates from three Ocab+/+ and three Ocab−/− mice) for the peptides in D, as well as two GAD65 peptides (206–214 and 546–554) and three additional IGRP peptides (21–29, 241–249, and 324–332). Significant Student’s t test P values were as follows: GAD65546-554, 0.046; IGRP206-214, 0.005; IGRP225-233, 0.0197; IGRP241-249, 0.0018; IGRP324-332, 0.0063. All error bars denote ±SEM. *, P ≤ 0.05; **, P ≤ 0.01. ns, not significant.
Figure 4.
Figure 4.
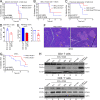
OCA-B loss protects NOD mice from T1D in spontaneous and polyclonal splenocyte transfer models but not monoclonal transfer models. (A) 2 × 10⁵ purified CD4+CD25 splenic T cells from NOD.BDC2.5.Ocab−/− or control NOD.BDC2.5.Ocab+/+ donors were injected retro-orbitally into NOD.Scid (n = 6 for each group) mice. Diabetes-free survival is shown. (B) 1.5 × 10⁶ purified splenic total CD4+ T cells from NOD.BDC2.5.Ocab−/− or control donors were transferred into NCG mice (n = 5 for each group). Mice were monitored for diabetes development. (C) Total NOD splenocytes (5 × 10⁶) from prediabetic 6–8-wk-old NOD.Ocabfl/flCD4-cre or control NOD.Ocabfl/fl donors were adoptively transferred into sex-matched NOD.Scid (n = 7 for each group) recipients. T1D-free survival is shown. (D) 13 wk after transfer, the proportion of IFN-γ–expressing islet CD8+ T cells was assessed by flow cytometry from mice in C. Student’s t test P value = 0.0136. (E) Pancreata from the same mice as in C were fixed, sectioned, and H&E stained. Pathological scores are shown based on six or seven islets per slide, three slides per mouse, and three mice per group (>60 islets/group). Student’s t test P value = 1.46 × 10⁻¹⁵. (F) Example pancreatic images from endpoint animals. Yellow arrows indicate islet positions. Images were collected at 10× magnification. (G) The Ocab null allele was crossed to NY8.3 TCR transgenic mice. Spontaneous T1D was measured in female Ocab−/− (n = 20) or control Ocab+/+ (n = 12) littermates. (H) Naive CD4+ or CD8+ T cells (CD8aneg or CD4neg,CD11bneg,CD45Rneg,DX5neg,Ter-119neg,CD44lo) were isolated from C57BL/6 spleens and stimulated for up to 2 d in vitro using anti-CD3ε and CD28 antibodies. Cells were then washed and replated in the presence of exogenous IL-2. After 8 d rest in culture, cells were restimulated for 6 h. Lysates were prepared from each step and subjected to OCA-B immunoblotting to assess changes in expression. Oct1 and β-actin are shown as controls. All error bars denote ±SEM. *, P ≤ 0.05; ****, P ≤ 0.0001. HR, hazard ratio; restim, restimulated.
Figure S4.
Figure S4.
Germline and T cell conditional OCA-B loss has no effect in two different T1D transplant model systems. (A) 5 × 10⁵ purified CD4+CD62L+Vb4+ T cells from NOD.BDC2.5.Ocab−/− or heterozygous control NOD.BDC2.5.Ocab+/− donors were injected retro-orbitally into NOD.SCID recipients (n = 7 or 8 per group). T1D-free survival following transplant is shown. (B) 10,000 OT-I T cells were transferred retro-orbitally into C57BL6 RIP-mOVA;Ocabfl/flCD4-cre mice or littermate RIP-mOVA;Ocabfl/fl controls. Mice were infected with 2,000 colony-forming units L. monocytogenes expressing chicken OVA (Lm-OVA) later the same day. Glucose was measured every 2 d and plotted. Two mice in each group were used.
Figure 5.
Figure 5.
OCA-B loss in CD4+ T cells increases anergy in vitro. (A) Naive CD4+ C57BL/6 T cells were stimulated in vitro for 24 h with anti-CD3ε antibodies ± costimulation with CD28 antibodies. Lysates were prepared and subjected to immunoblotting using OCA-B antibodies. β-Actin is shown as a loading control. (B) Naive OCA-B–deficient and control CD4+ T cells were stimulated in vitro with anti-CD3ε antibodies. 48 h later, the cells were restimulated with PMA and ionomycin for 6 h in the presence of brefeldin A, stained for intracellular IL-2, and analyzed by flow cytometry. Cells were gated on CD4 and CD44. (C) Quantitation using independently purified cells from the spleens of four mice treated similar to those in B. Student’s t test P value = 0.0019. (D) Naive OCA-B–deficient and littermate control splenic CD4+ T cells from 6-wk-old NOD mice were stimulated for 2 d in vitro with indicated antibodies, replated, and rested in the absence of antibody for 2 d, and analyzed by flow cytometry. Mean FR4hi CD73hiCD4+CD44+ cell frequencies are shown using independently purified cells from the spleens of two mice, with four independent culture replicates performed for each mouse (n = 8). Student’s t test P values: CD3ε only, 0.0002; CD3ε/CD28, 1.04 × 10⁻⁵; control CD3ε vs. CD3ε/CD28, 0.0053; OCA-B–deficient CD3ε vs. CD3ε/CD28, 0.0068. (E) Similar to D, except frequencies of CD4+CD44+ICOS+ cells are plotted. CD3ε-only Student’s t test P value = 0.0026. (F) Similar to D, except average percentages of CD4+CD44+CD25+ cells are plotted. CD3ε-only Student’s t test P value = 1.80 × 10⁻⁵. All error bars denote ±SEM. **, P ≤ 0.01; ***, P ≤ 0.001; ****, P ≤ 0.0001. n.s., not significant.
Figure 6.
Figure 6.
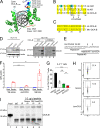
Design and validation of OCA-B peptide inhibitors. (A) OCA-B N terminus (residues 16 and 38)/Oct1 DNA binding domain/octamer binding DNA cocrystal structure (Protein Data Bank identification 1CQT; Green, 2016). Gray: DNA. Green: Oct1 DNA binding domain. Cyan: OCA-B. Red dashed line shows position of the Oct1 linker domain. N, number. DBD, DNA binding domain. Untransf., untransfected. (B) Top alignment of the human AR isoform transcript variant 1 (sequence identification ADD26780.1) coactivator interaction domain (residues 698–721) with full-length human Oct1 and OCA-B. The aligned regions are from the Oct1 linker domain and OCA-B N terminus. Green serines: putative ERK phospho-acceptor sites. Yellow: similar or identical amino acids. Asterisks: known human point mutations that block coactivator binding and cause androgen insensitivity syndrome in humans. Pairwise alignments were performed using the FASTA algorithm (https://embnet.vital-it.ch/software/LALIGN_form.html) and trimmed for three-way overlap. (C) Alignment of human and mouse primary OCA-B peptide sequences. (D) coIP of Jmjd1a with L31A/R34A double-point mutant OCA-B and WT control. HCT116 cells transfected with WT or mutant OCA-B constructs were used. Protein expression was checked 48 h after transfection by Western blotting. 50 µg input protein was loaded in lanes 1–3. (E) Indicated peptide sequences were synthesized as C-terminal Tat fusions for membrane permeability. Arrows indicate position of mutant in B and D. (F) Il2 mRNA expression in primary naive CD4+ T cells treated with 50 µM JumOCA peptide was measured relative to β-actin internal standard by RT quantitative PCR. Cells were stimulated with CD3ε/CD28 antibodies for 2 d, rested for a further 8 d in the presence of exogenous recombinant IL-2, and restimulated for 6 h. Peptide was included during resting and restimulation only and replaced every other day with media changes. Three independent biological replicates were used for each condition. Tat vs. JumOCA restimulated (Restim) Student’s t test P value = 0.0007. Tat vs. vehicle Student’s t test P value = 0.0022. (G) IL-2 cytokine expression in primary naive CD4+ T cells cultured with 50 µM peptide at initial treatment and with 25 µM peptide from the secondary treatment was measured by flow cytometry. Cells were treated similarly to those in F except collection, brefeldin A treatment, and processing for flow cytometry occurred 24 h after restimulation. Three independent biological replicates were used for each condition. Vehicle vs. JumOCA Student’s t test P value = 9.62 × 10⁻⁷. Scrambled peptide vs. JumOCA Student’s t test P value = 0.0006. (H) CD4+CD44+IL2+ T cell frequencies from representative samples in G. Plots were gated on CD4 and CD44. (I) Peptide effects on the interaction between OCA-B and Jmjd1a were measured by coIP. M12 B cells were used. After incubation with protein-G beads, 0.2 µg/µl control scrambled (Scram), double-point mutant (DM) peptide, or JumOCA peptide were added for a further 3 h before precipitation and washing. 1% input (lane 1) is shown as a control. All error bars denote ±SEM. **, P ≤ 0.01; ***, P ≤ 0.001; ****, P ≤ 0.0001. n.s., not significant.
Figure S5.
Figure S5.
Tat- but not OVA-conjugated peptides concentrate in cultured T cells. CD3+ T cells were isolated from the spleens or pancreata of NOD mice and were incubated with 40 µM FITC-conjugated OVA control peptide, or FITC-conjugated to the TAT membrane–penetrating peptide for 15 min. Cells with concentrated FITC fluorescence were observed by epifluorescence microscopy. Images were taken at 40× magnification.
Figure 7.
Figure 7.
OCA-B inhibitor peptide reduces blood glucose and inflammatory cytokine levels in the pancreas in NOD mice with newly arisen diabetes. (A) Three doses of 10 mg/kg JumOCA (n = 4), Tat only (n = 6), or scrambled peptide (n = 3) were injected retro-orbitally every 12 h into 12–18-wk-old NOD female littermate mice whose glucose levels were newly risen above 225 mg/dl but still below 275 mg/dl. Glucose levels are shown immediately before the first injection, after the second injection, and 4 h after the final injection. Data were collected on a rolling basis as mice became spontaneously diabetic. JumOCA vs. Tat peptide Student’s t test P value = 0.0004. JumOCA vs. scrambled peptide Student’s t test P value = 0.0064. (B) 12 h after the last injection of peptides in A, PLN CD4+ and CD8+ T cell percentages were analyzed by flow cytometry. Mean of islet IL-17–expressing T cells was analyzed by flow cytometry and plotted. Results are from three independent mice in the case of Tat and four independent mice in the case of JumOCA. CD4+IL-17+ Student’s t test P value = 0.002. (C) Similar analysis as B except for IFN-γ. CD4+ Student’s t test P value = 0.0062. CD8+ Student’s t test P value = 0.0002. (D) Percentages of PLN CD4+ and CD8+ T cells from mice in A. (E) NOD mice were treated with three intravenous peptide injections as before, except that 12-wk prediabetic mice were used, and scrambled peptide was additionally included as a control. 4 h after the final injection, PLN WBCs were stimulated with IGRP peptides and brefeldin A for 4 h, stained for IFN-γ, and analyzed by flow cytometry as in Fig. 3 D. Representative animals are shown. (F) Mean percentages of cells expressing IFN-γ from six experiments. IGRP206-214 Student’s t test P value = 0.0244. IGRP225-233 Student’s t test P value = 0.0201. All error bars denote ±SEM. *, P ≤ 0.05; **, P ≤ 0.01; ***, P ≤ 0.001. n.s., not significant.

Similar articles

Cited by

References

    1. Antony-Debré, I., Paul A., Leite J., Mitchell K., Kim H.M., Carvajal L.A., Todorova T.I., Huang K., Kumar A., Farahat A.A., et al. . 2017. Pharmacological inhibition of the transcription factor PU.1 in leukemia. J. Clin. Invest. 127:4297–4313. 10.1172/JCI92504 - DOI - PMC - PubMed
    1. Ban, M., Booth D., Heard R., Stewart G., Goris A., Vandenbroeck K., Dubois B., Laaksonen M., Ilonen J., Alizadeh M., et al. . Games Collaborative Group . 2006. Linkage disequilibrium screening for multiple sclerosis implicates JAG1 and POU2AF1 as susceptibility genes in Europeans. J. Neuroimmunol. 179:108–116. 10.1016/j.jneuroim.2006.06.003 - DOI - PubMed
    1. Berry, G., and Waldner H.. 2013. Accelerated type 1 diabetes induction in mice by adoptive transfer of diabetogenic CD4+ T cells. J. Vis. Exp. 6:e50389. 10.3791/50389 - DOI - PMC - PubMed
    1. Cantor, J., and Haskins K.. 2007. Recruitment and activation of macrophages by pathogenic CD4 T cells in type 1 diabetes: evidence for involvement of CCR8 and CCL1. J. Immunol. 179:5760–5767. 10.4049/jimmunol.179.9.5760 - DOI - PubMed
    1. Caron, N.J., Quenneville S.P., and Tremblay J.P.. 2004. Endosome disruption enhances the functional nuclear delivery of Tat-fusion proteins. Biochem. Biophys. Res. Commun. 319:12–20. 10.1016/j.bbrc.2004.04.180 - DOI - PubMed

Publication types

MeSH terms