Immune phenotype of patients with stage IV metastatic inflammatory breast cancer
- PMID: 33267869
- PMCID: PMC7709446
- DOI: 10.1186/s13058-020-01371-x
Immune phenotype of patients with stage IV metastatic inflammatory breast cancer
Abstract
Background: Inflammatory breast cancer (IBC) is a rare but aggressive carcinoma characterized by severe erythema and edema of the breast, with many patients presenting in advanced metastatic disease. The "inflammatory" nature is not due to classic immune-mediated inflammation, but instead results from tumor-mediated blockage of dermal lymphatic ducts. Previous work has shown that expression of PD-L1 on tumor cells can suppress T cell activation in triple-negative (TN) non-IBC breast cancer. In the present work, we investigated immune parameters in peripheral blood of metastatic IBC patients to determine whether cellular components of the immune system are altered, thereby contributing to pathogenesis of the disease. These immune parameters were also compared to PD-1 and PD-L1 expression in IBC tumor biopsies.
Methods: Flow cytometry-based immune phenotyping was performed using fresh peripheral blood from 14 stage IV IBC patients and compared to 11 healthy age-similar control women. Immunohistochemistry for CD20, CD3, PD-1, and PD-L1 was performed on tumor biopsies of these metastatic IBC patients.
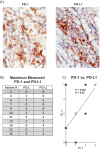
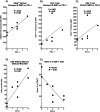
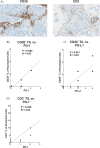
Results: IBC patients with Stage IV disease had lymphopenia with significant reductions in circulating T, B, and NK cells. Reductions were observed in all subsets of CD4+ T cells, whereas reductions in CD8+ T cells were more concentrated in memory subsets. Immature cytokine-producing CD56bright NK cells expressed higher levels of FcγRIIIa and cytolytic granule components, suggesting accelerated maturation to cytolytic CD56dim cells. Immunohistochemical analysis of tumor biopsies demonstrated moderate to high expression of PD-1 in 18.2% of patients and of PD-L1 in 36.4% of patients. Interestingly, a positive correlation was observed between co-expression levels of PD-L1 and PD-1 in tumor biopsies, and higher expression of PD-L1 in tumor biopsies correlated with higher expression of cytolytic granule components in blood CD4+ T cells and CD56dim NK cells, and higher numbers of CD8+ effector memory T cells in peripheral blood. PD-1 expression in tumor also correlated with increased infiltration of CD20+ B cells in the tumor.
Conclusions: Our results suggest that while lymphocyte populations are severely compromised in stage IV IBC patients, an immune response toward the tumor had occurred in some patients, providing biological rationale to evaluate PD-1/PD-L1 immunotherapies for IBC.
Keywords: Checkpoint inhibitors; Immunotherapy; Inflammatory breast cancer (IBC); Lymphopenia; Metastatic IBC; NK cells; PD-1; PD-L1; Stage IV IBC; T cells; Tumor microenvironment; Tumor-infiltrating lymphocytes.
Conflict of interest statement
This work was partially supported by funds from Merck Sharp & Dohme Corp., a subsidiary of Merck & Co., Inc., Kenilworth, NJ, USA (MSD), and JY, LA, and CM are employees of MSD. MC has advised Lilly, Cytodyn, Foundation Medicine, G1 Therapeutics, Amarex, and Sermonix and received honoraria from Pfizer and Foundation Medicine. KSC has received research funding from Janssen, Immune Oncology Biosciences, Genentech, BMS, Horizon Pharma, and NantKwest.
Figures


Similar articles
-
Genetic Variants and Tumor Immune Microenvironment: Clues for Targeted Therapies in Inflammatory Breast Cancer (IBC).Int J Mol Sci. 2021 Aug 19;22(16):8924. doi: 10.3390/ijms22168924. Int J Mol Sci. 2021. PMID: 34445631 Free PMC article.
-
The combined presence of CD20 + B cells and PD-L1 + tumor-infiltrating lymphocytes in inflammatory breast cancer is prognostic of improved patient outcome.Breast Cancer Res Treat. 2018 Sep;171(2):273-282. doi: 10.1007/s10549-018-4834-7. Epub 2018 Jun 1. Breast Cancer Res Treat. 2018. PMID: 29858752 Free PMC article.
-
Infiltrating stromal immune cells in inflammatory breast cancer are associated with an improved outcome and increased PD-L1 expression.Breast Cancer Res. 2019 Feb 18;21(1):28. doi: 10.1186/s13058-019-1108-1. Breast Cancer Res. 2019. PMID: 30777104 Free PMC article.
-
Determining Factors in the Therapeutic Success of Checkpoint Immunotherapies against PD-L1 in Breast Cancer: A Focus on Epithelial-Mesenchymal Transition Activation.J Immunol Res. 2021 Jan 7;2021:6668573. doi: 10.1155/2021/6668573. eCollection 2021. J Immunol Res. 2021. PMID: 33506060 Free PMC article. Review.
-
PD‑L1/PD‑1 blockade in breast cancer: The immunotherapy era (Review).Oncol Rep. 2021 Jan;45(1):5-12. doi: 10.3892/or.2020.7831. Epub 2020 Nov 3. Oncol Rep. 2021. PMID: 33416128 Review.
Cited by
-
Aberrant Alteration of Circulating Lymphocyte Subsets in Small Cell Lung Cancer Patients Treated with Radiotherapy.Technol Cancer Res Treat. 2021 Jan-Dec;20:15330338211039948. doi: 10.1177/15330338211039948. Technol Cancer Res Treat. 2021. PMID: 34851203 Free PMC article.
-
Abnormal variation and prognostic significance of circulating immune cells in patients with nasopharyngeal carcinoma treated with chemoradiotherapy: a prospective cohort study.Transl Cancer Res. 2023 Dec 31;12(12):3718-3727. doi: 10.21037/tcr-23-2024. Epub 2023 Dec 14. Transl Cancer Res. 2023. PMID: 38192995 Free PMC article.
-
Alterations of circulating lymphocyte subsets in patients with colorectal carcinoma.Cancer Immunol Immunother. 2022 Aug;71(8):1937-1947. doi: 10.1007/s00262-021-03127-8. Epub 2021 Dec 20. Cancer Immunol Immunother. 2022. PMID: 34928423 Free PMC article.
-
Genetic Variants and Tumor Immune Microenvironment: Clues for Targeted Therapies in Inflammatory Breast Cancer (IBC).Int J Mol Sci. 2021 Aug 19;22(16):8924. doi: 10.3390/ijms22168924. Int J Mol Sci. 2021. PMID: 34445631 Free PMC article.
-
Breast cancer relapses considering molecular biological characteristics.J Med Life. 2023 Jan;16(1):70-75. doi: 10.25122/jml-2022-0189. J Med Life. 2023. PMID: 36873133 Free PMC article.
References
-
- Levine PH, Steinhorn SC, Ries LG, Aron JL. Inflammatory breast cancer: the experience of the surveillance, epidemiology, and end results (SEER) program. J Natl Cancer Inst. 1985;74(2):291–297. - PubMed
Publication types
MeSH terms
Substances
Grants and funding
LinkOut - more resources
Full Text Sources
Medical
Research Materials

