. 2020 Nov 30;16(11):e1009062.
doi: 10.1371/journal.ppat.1009062. eCollection 2020 Nov.

Structural intermediates in the low pH-induced transition of influenza hemagglutinin

Affiliations

Structural intermediates in the low pH-induced transition of influenza hemagglutinin

Jingjing Gao et al. PLoS Pathog. .

Abstract

The hemagglutinin (HA) glycoproteins of influenza viruses play a key role in binding host cell receptors and in mediating virus-host cell membrane fusion during virus infection. Upon virus entry, HA is triggered by low pH and undergoes large structural rearrangements from a prefusion state to a postfusion state. While structures of prefusion state and postfusion state of HA have been reported, the intermediate structures remain elusive. Here, we report two distinct low pH intermediate conformations of the influenza virus HA using cryo-electron microscopy (cryo-EM). Our results show that a decrease in pH from 7.8 to 5.2 triggers the release of fusion peptides from the binding pockets and then causes a dramatic conformational change in the central helices, in which the membrane-proximal ends of the central helices unwind to an extended form. Accompanying the conformational changes of the central helices, the stem region of the HA undergoes an anticlockwise rotation of 9.5 degrees and a shift of 15 Å. The HA head, after being stabilized by an antibody, remains unchanged compared to the neutral pH state. Thus, the conformational change of the HA stem region observed in our research is likely to be independent of the HA head. These results provide new insights into the structural transition of HA during virus entry.


Conflict of interest statement

The authors have declared that no competing interests exist.

Figures

Fig 1
Fig 1. Cryo-EM structure of the influenza virus HA in complex with Fab F005-126 (HA-Fab) at pH 7.8.
(A) A schematic diagram showing the domain organization of the influenza virus HA. HA1 subunit (9–324), gray. Fusion peptide (1–20), green. Hairpin 1 (21–38), orange. Helix A (39–56), blue. Loop B (57–75), hot pink. Helix C (76–105), yellow. Helix D (106–125), cornflower blue. Hairpin 2 (126–141), purple. C-terminus (142–172), brown. The transmembrane domain and the cytoplasmic tail (173–222) are represented as stripe lines. (B) Surface-shadowed (left) and ribbon diagrams (right) showing the 2.8 Å cryo-EM structure of the HA-Fab at pH 7.8. The map is contoured at 8 σ. The disordered transmembrane domain and the bound detergent micelle are visible only at a lower map contour level, and the profile of the corresponding part at a contour level of 3 σ is therefore indicated in the diagram by brown lines. The three HA1/HA2 heterodimers are colored hot pink, cornflower blue and orange, respectively. The bound Fabs are colored tan. (C) Ribbon diagrams showing the structure elements of a HA1/HA2 heterodimer. The structure elements are labeled and colored the same as in (A). (D) Ribbon and surface diagrams showing the central helices. Side chains of the residues in the core of one central helix are shown in balls and sticks. The surface of one central helix is shown and colored according to the surface electrostatic potentials, with blue representing positive electrostatic potential and red representing negative electrostatic potential. The ribbons of the fusion peptides are colored green. (E) Ribbon and surface diagrams showing one fusion peptide in the surface pocket between the Helix Ds. The surface is colored according to the surface electrostatic potentials. The backbone of the fusion peptide is colored green, and the sidechains of the hydrophobic residues are colored gray. (F) Ribbon diagrams showing the hydrophobic core constituted by the hydrophobic fusion peptide terminal residues. The backbone of the fusion peptide is shown in green. The N-terminal hydrophobic residues of the fusion peptide are shown as orange spheres. The central helices are colored cornflower blue.
Fig 2
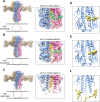
Fig 2. Structures of the HA-Fab complex at pH 5.2 showing the release of the fusion peptide.
(A to C) Surface-shadowed and ribbon diagrams showing the HA-Fab-pH 5.2 conformation A (A), conformation B (B) and conformation C (C). Semitransparent surfaces displayed with the backbone ribbons in the density maps. The density maps are contoured at 7 σ (A), 11 σ (B) and 7 σ (C), respectively. The profiles of the disordered transmembrane domain and the bound detergent micelle (map contoured at 3 σ) are indicated by brown lines. The fusion peptides are colored green. The zoomed-in views show the densities around the fusion peptides. (D to F) Surface-shadowed and ribbon diagrams showing the residue densities of the “zero out” maps for the three low pH conformations. The “zero out” maps were calculated by setting the values of the map grid points within a radius of 2.5 Å of each fitted model atom to zero [52]. The fusion peptide (residues 1–20 of the HA2) was excluded for all the calculations. The “zero out” residue density maps are colored yellow and contoured at 7 σ (D), 11 σ (E) and 7 σ (F), respectively.
Fig 3
Fig 3. Structure comparisons of the pH 7.8 and pH 5.2 conformations.
(A) Structure superimpositions of the central helices in neutral (cornflower blue) and low pH conformations (hot pink). Side view (left) and bottom-up view (right) are shown. The coiled-coil parameters of the Helix Cs and the Helix Ds in neutral and low pH conformations are listed under the top view. The rotation directions of the membrane-proximal ends are indicated by black arrows in the bottom-up view. The rotation angles of the helices are measured with the membrane-distal ends as the pivot point. (B) Structure comparisons between the Helix Ds in neutral (cornflower blue) and low pH (hot pink) conformations showing the changes in the residue side chains. (C) Ribbon and surface-rendered diagrams showing the surface electrostatic potential changes of the central helices upon pH change. The surface is colored according to the surface electrostatic potential with positive charges colored blue and negative charges colored red. (D) Surface-rendered diagrams showing the changes in surface and inner cavity of the central helices upon pH change. The surface is colored from white to green to purple according to the distances from the voxels to the three-fold axis.
Fig 4
Fig 4. Structure changes in the stem region of the pH 5.2 conformation C.
(A) Ribbon and surface rendered diagrams showing the fitted beta sheet, C-terminal helices of the stem region (residues 23–37 and 126–172 of HA2 subunits and 9–17 of HA1 subunits) in the pH 5.2 conformation C density map low-pass filtered to 7 Å. The fitted structures in the HA density are colored hot pink, cornflower blue and orange, respectively. The head and central helices are shown in gray. The low-pass filtered pH 5.2 conformation C density map is contoured at 6 σ and shown as a semi-transparent surface. Zoom-in views of the fitted region are shown at the right. The fitting was done in Chimera by treating the beta sheet and the C-terminal helices of the stem region as a rigid body and by maximizing the density values around the fitted atoms [52]. (B) Models are shown as the same as in (A) with a “zero-out” density map of the pH 5.2 conformation C shown as solid surfaces in cyan. The “zero-out” density map was calculated by setting the density value within 3 Å around the atoms of the model to zero. (C) Models of pH 5.2 conformation C (hot pink) and pH 5.2 conformation A (gray) are superimposed by using the head domains. The steric clashes between the central helices of the pH 5.2 conformation C and the stem region (fusion peptide and beta sheets) of the pH 5.2 conformation A are shown in blue. (D) Structure comparisons of the stem regions under different pH conditions. The stem region rotates and shifts upon the decrease of the pH. The shift of the C terminus is approximately 15 Å and the shift of the center of mass is approximately 7 Å. The rotation of the C terminus with the membrane-distal end of each central helix as the pivot point (residue Arg76) is approximately 9.5 degrees.
Fig 5
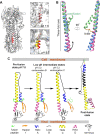
Fig 5. Molecular basis of the pH-induced conformational changes of HA.
(A) Structure comparisons of the Helix As in neutral and low pH conformations. Left: Ribbon diagrams showing the position of Helix A in the stem region. Helix A is colored red. Right: Zoomed-in views showing the Helix As in neutral (red) and low pH (yellow) conditions. The ribbons of the stem are colored dark gray for the neutral pH conformation and blue for the low pH conformation. (B) Structure comparisons of the neutral pH (cornflower blue), low pH intermediate (hot pink) and postfusion (green, PDB accession: 1HTM) HA central helices. The linker conducting helix to loop conformational change in the post-fusion transition is colored orange. (C) A schematic diagram illustrating the low pH-induced structural transition of HA.

Similar articles

Cited by

References

    1. Hamilton BS, Whittaker GR, Daniel S. Influenza virus-mediated membrane fusion: determinants of hemagglutinin fusogenic activity and experimental approaches for assessing virus fusion. Viruses. 2012;4(7):1144–68. 10.3390/v4071144 - DOI - PMC - PubMed
    1. Dopheide TA, Ward CW. The disulphide bonds of a Hong Kong influenza virus hemagglutinin. FEBS Lett. 1980;110(2):181–3. 10.1016/0014-5793(80)80067-6 - DOI - PubMed
    1. Wiley DC, Skehel JJ. The Structure and Function of the Hemagglutinin Membrane Glycoprotein of Influenza-Virus. Annu Rev Biochem. 1987;56:365–94. 10.1146/annurev.bi.56.070187.002053 - DOI - PubMed
    1. Sieczkarski SB, Whittaker GR. Differential requirements of Rab5 and Rab7 for endocytosis of influenza and other enveloped viruses. Traffic. 2003;4(5):333–43. 10.1034/j.1600-0854.2003.00090.x - DOI - PubMed
    1. Chen J, Lee KH, Steinhauer DA, Stevens DJ, Skehel JJ, Wiley DC. Structure of the hemagglutinin precursor cleavage site, a determinant of influenza pathogenicity and the origin of the labile conformation. Cell. 1998;95(3):409–17. 10.1016/s0092-8674(00)81771-7 - DOI - PubMed

Publication types

MeSH terms

Substances

Grants and funding

This work was supported by funds from the Ministry of Science and Technology of China (grant: 2016YFA0501100), the National Natural Science Foundation of China (grants: 31925023, 21827810, 31861143027 & 31470721), the Beijing Frontier Research Center for Biological Structure and the Beijing Advanced Innovation Center for Structure Biology to Y.X. The funders had no role in study design, data collection and analysis, decision to publish, or preparation of the manuscript.