Effects of dexamethasone on hepatic macrophages in normal livers and thioacetamide-induced acute liver lesions in rats
- PMID: 33239842
- PMCID: PMC7677630
- DOI: 10.1293/tox.2020-0016
Effects of dexamethasone on hepatic macrophages in normal livers and thioacetamide-induced acute liver lesions in rats
Abstract
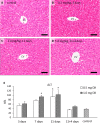
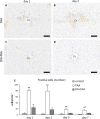
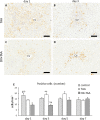
Resident and infiltrative macrophages play important roles in the development of pathological lesions. M1/M2 macrophage polarization with respective CD68 and CD163 expression remains unclear in chemically induced liver injury. This study was aimed at investigating the influence of macrophages on normal and chemically induced liver injury. For this, dexamethasone (DX), an immunosuppressive drug, was administered in normal rats and thioacetamide (TAA)-treated rats. Liver samples were collected and analyzed with immunohistochemical methods. Repeated injections of DX (0.5 or 1.0 mg/kg BW) for 3, 7 and 11 days reduced the number of CD163 positive hepatic resident macrophages (Kupffer cells) in normal livers, while increasing AST and ALT levels. In TAA (300 mg/kg BW)-treated rats injected with DX (0.5 mg/kg BW) pretreatment, the number of M1 and M2 macrophages showed a significant decrease compared with that of TAA-treated rats without DX treatment. Additionally, reparative fibrosis resulting from hepatocyte injury induced by TAA injection was suppressed by DX pretreatment. Our data suggested that macrophages could influence not only normal hepatic homeostasis (reflected by AST and ALT levels) but also chemically induced hepatic lesion development (reduced reparative fibrosis).
Keywords: M1 macrophage; M2 macrophage; dexamethasone; thioacetamide.
©2020 The Japanese Society of Toxicologic Pathology.
Conflict of interest statement
The authors have no conflicts of interest directly relevant to the content of this article.
Figures


Similar articles
-
Histopathological Analysis of Rat Hepatotoxicity Based on Macrophage Functions: in Particular, an Analysis for Thioacetamide-induced Hepatic Lesions.Food Saf (Tokyo). 2016 Sep 17;4(3):61-73. doi: 10.14252/foodsafetyfscj.2016012. eCollection 2016 Sep. Food Saf (Tokyo). 2016. PMID: 32231908 Free PMC article. Review.
-
Depletion of Hepatic Macrophages Aggravates Liver Lesions Induced in Rats by Thioacetamide (TAA).Toxicol Pathol. 2016 Feb;44(2):246-58. doi: 10.1177/0192623315621191. Toxicol Pathol. 2016. PMID: 26957569
-
M1- and M2-macrophage polarization in thioacetamide (TAA)-induced rat liver lesions; a possible analysis for hepato-pathology.Histol Histopathol. 2014 Apr;29(4):497-511. doi: 10.14670/HH-29.10.497. Epub 2013 Oct 15. Histol Histopathol. 2014. PMID: 24127400
-
M1- and M2-macrophage polarization in rat liver cirrhosis induced by thioacetamide (TAA), focusing on Iba1 and galectin-3.Exp Mol Pathol. 2014 Jun;96(3):382-92. doi: 10.1016/j.yexmp.2014.04.003. Epub 2014 Apr 18. Exp Mol Pathol. 2014. PMID: 24747241
-
M1-/M2-macrophage polarization in pseudolobules consisting of adipohilin-rich hepatocytes in thioacetamide (TAA)-induced rat hepatic cirrhosis.Exp Mol Pathol. 2016 Aug;101(1):133-42. doi: 10.1016/j.yexmp.2016.07.005. Epub 2016 Jul 21. Exp Mol Pathol. 2016. PMID: 27453055
Cited by
-
3D Stem Cell Spheroids with 2D Hetero-Nanostructures for In Vivo Osteogenic and Immunologic Modulated Bone Repair.Adv Healthc Mater. 2024 May;13(12):e2303772. doi: 10.1002/adhm.202303772. Epub 2024 Feb 11. Adv Healthc Mater. 2024. PMID: 38271276
-
Macrophage pathology in hepatotoxicity.J Toxicol Pathol. 2023 Apr;36(2):51-68. doi: 10.1293/tox.2022-0112. Epub 2022 Nov 29. J Toxicol Pathol. 2023. PMID: 37101958 Free PMC article. Review.
References
-
- Wijesundera KK, Izawa T, Tennakoon AH, Golbar HM, Tanaka M, Kuwamura M, and Yamate J. M1-/M2-macrophages contribute to the development of GST-P-positive preneoplastic lesions in chemically-induced rat cirrhosis. Exp Toxicol Pathol. 67: 467–475. 2015. - PubMed
-
- Golbar HM, Izawa T, Wijesundera KK, Bondoc A, Tennakoon AH, Kuwamura M, and Yamate J. Depletion of hepatic macrophages aggravates liver lesions induced in rats by thioacetamide (TAA). Toxicol Pathol. 44: 246–258. 2016. - PubMed
-
- Wijesundera KK, Izawa T, Tennakoon AH, Murakami H, Golbar HM, Katou-Ichikawa C, Tanaka M, Kuwamura M, and Yamate J. M1- and M2-macrophage polarization in rat liver cirrhosis induced by thioacetamide (TAA), focusing on Iba1 and galectin-3. Exp Mol Pathol. 96: 382–392. 2014. - PubMed

