. 2021 Feb;70(2):562-576.
doi: 10.2337/db20-0660. Epub 2020 Nov 25.

Podocyte EGFR Inhibits Autophagy Through Upregulation of Rubicon in Type 2 Diabetic Nephropathy

Affiliations

Podocyte EGFR Inhibits Autophagy Through Upregulation of Rubicon in Type 2 Diabetic Nephropathy

Yan Li et al. Diabetes. 2021 Feb.

Abstract

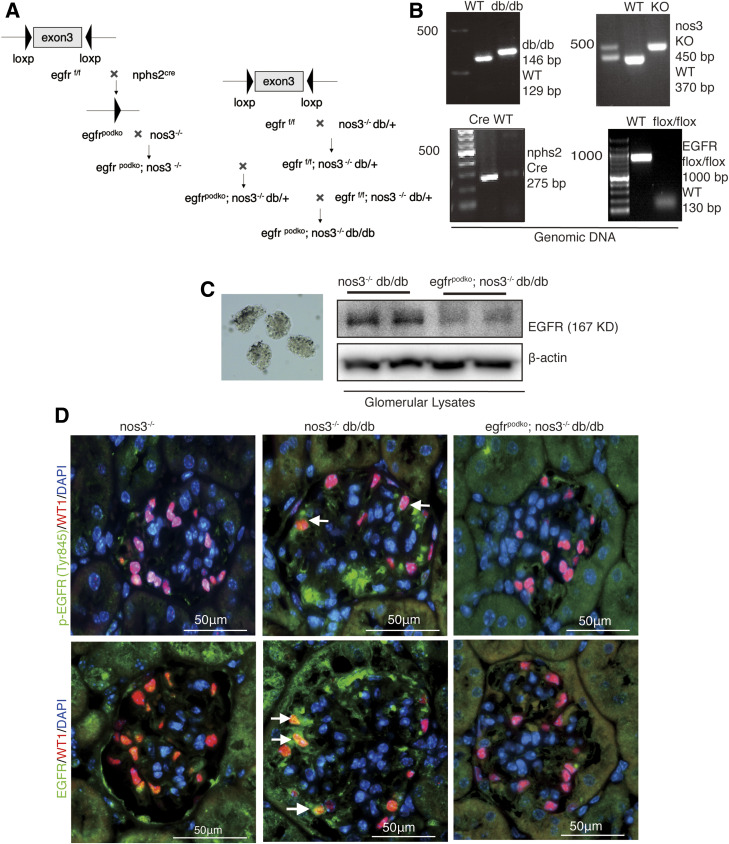
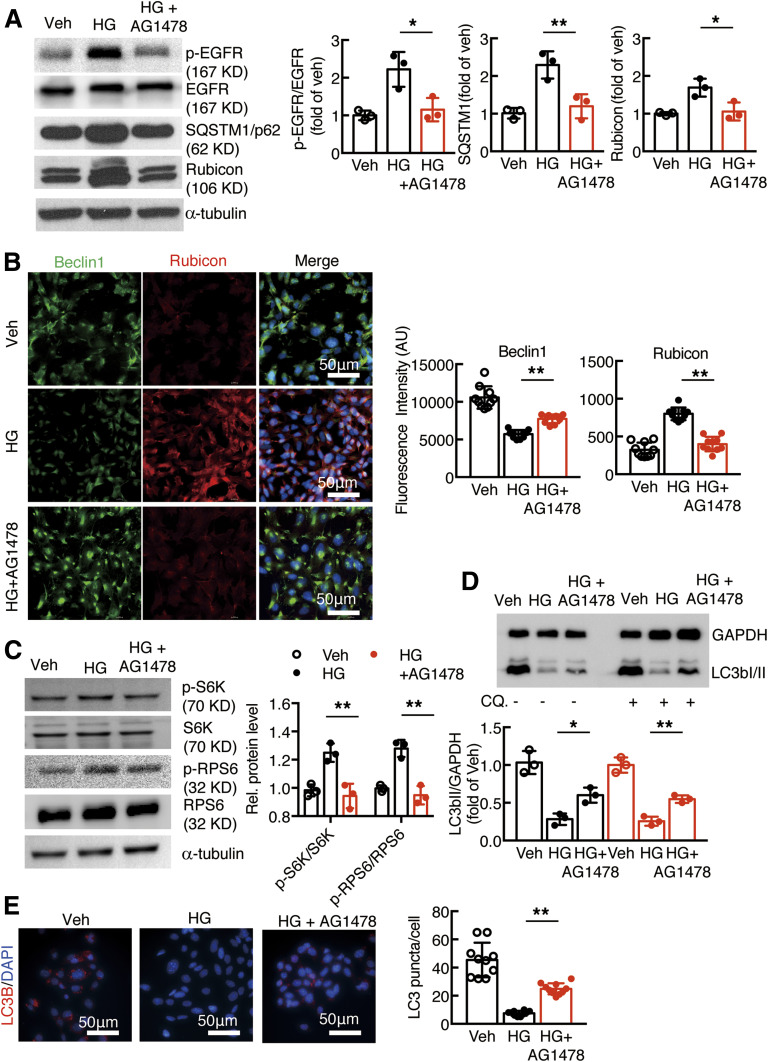
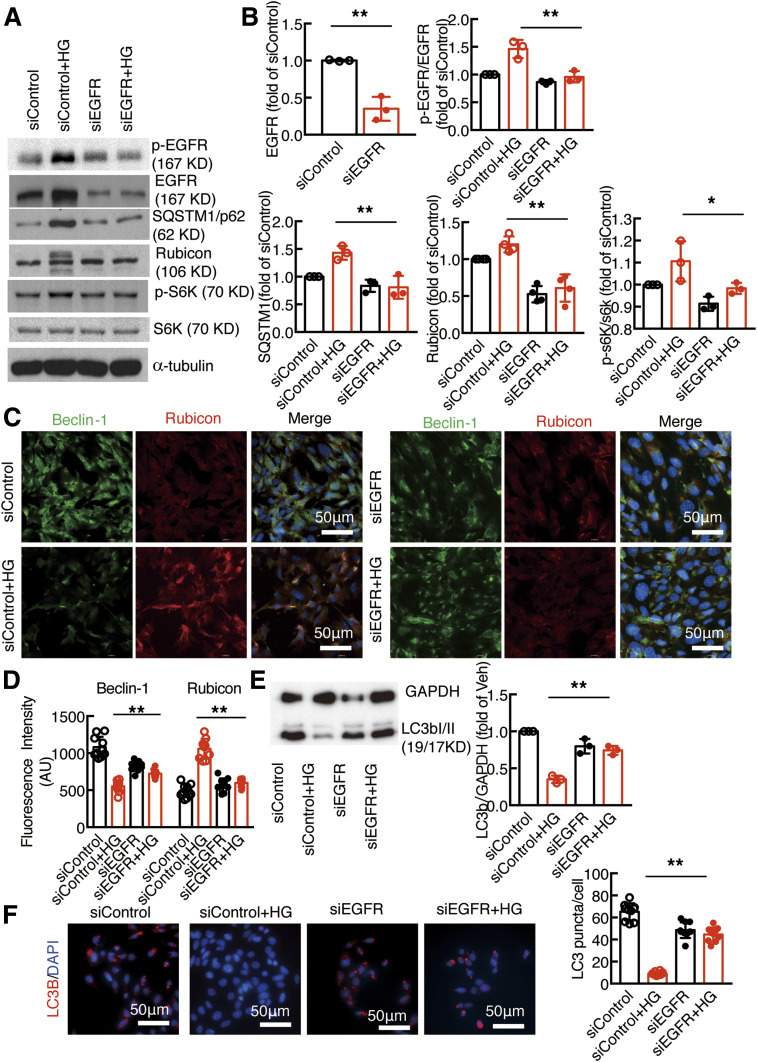
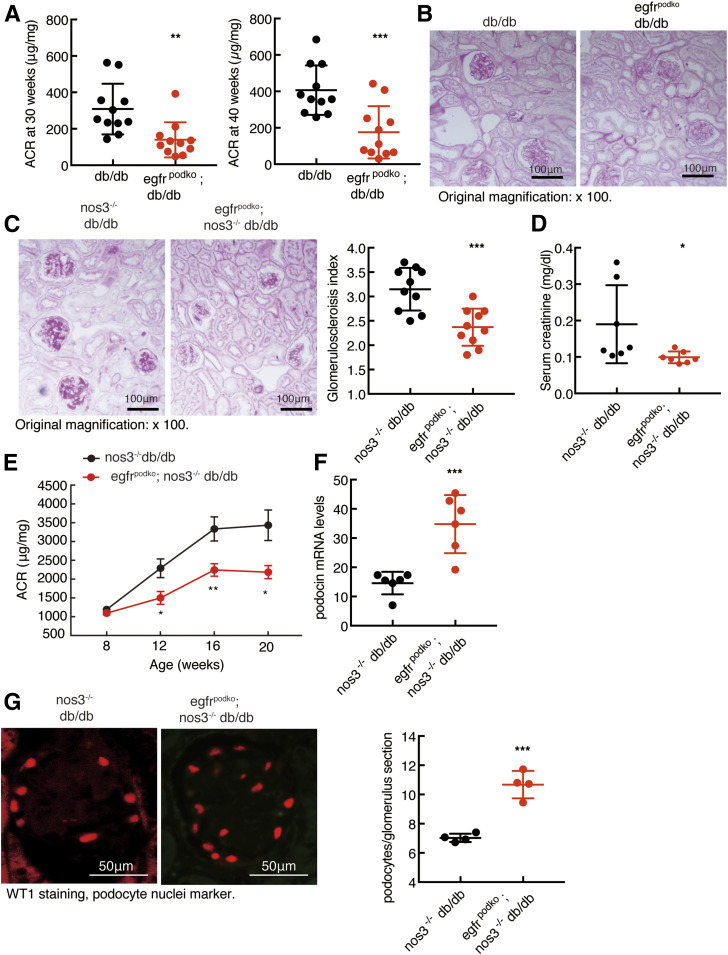
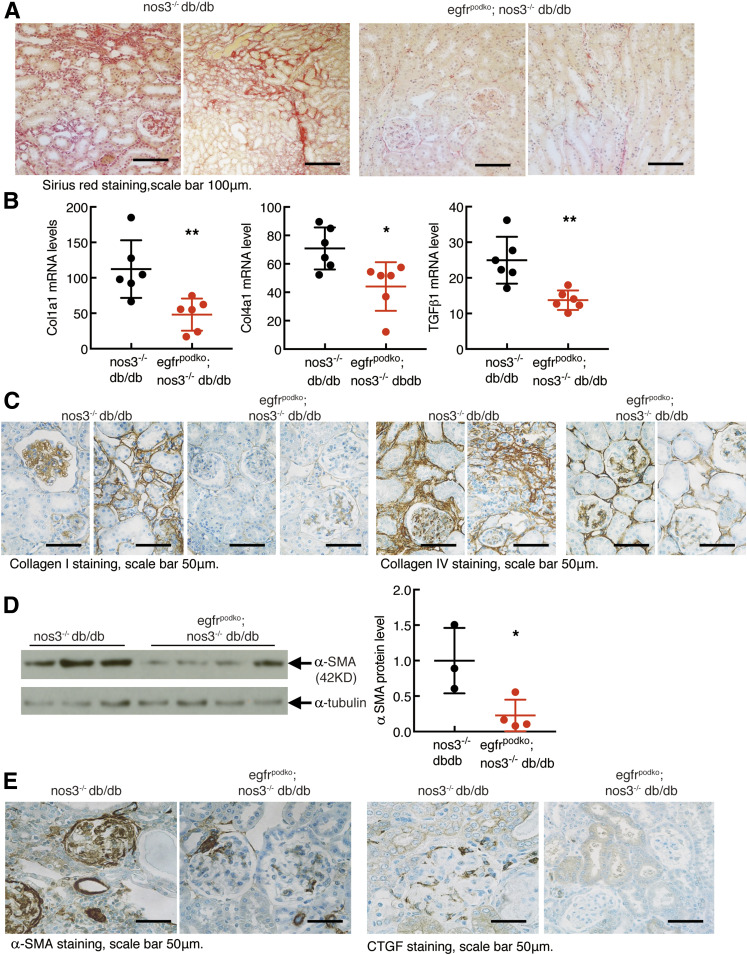
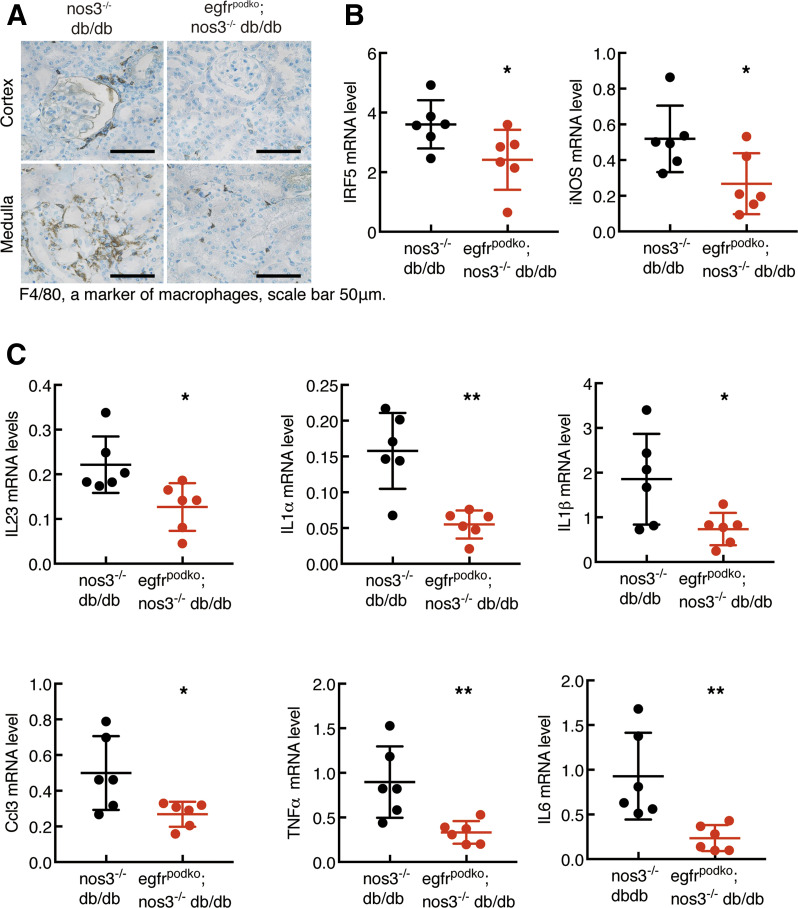
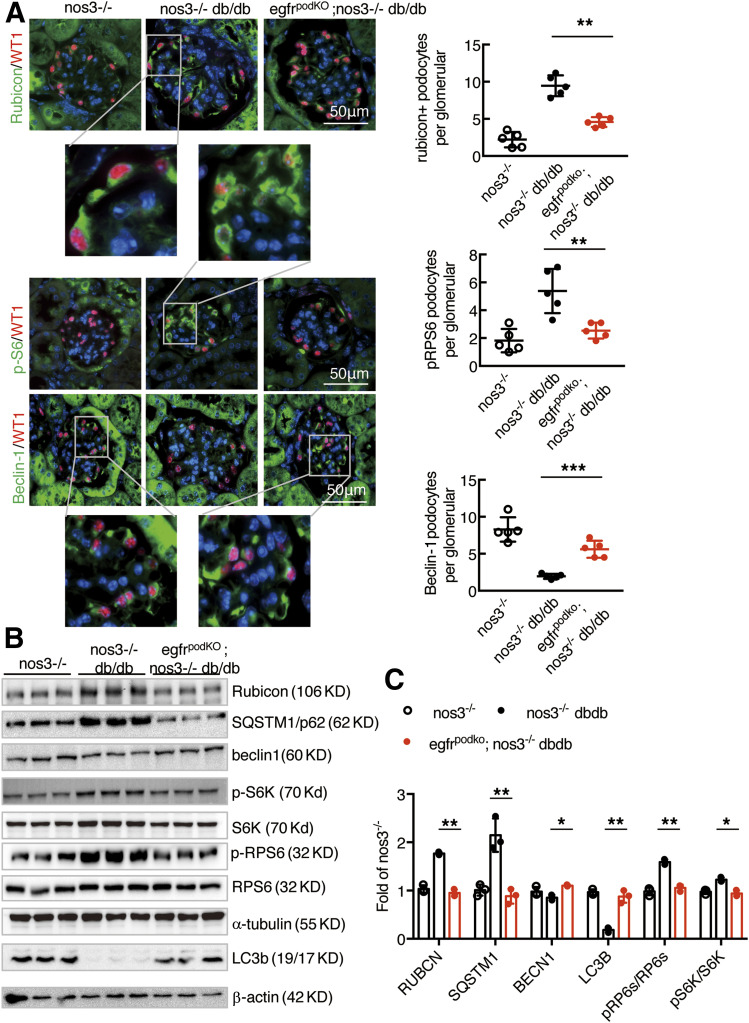
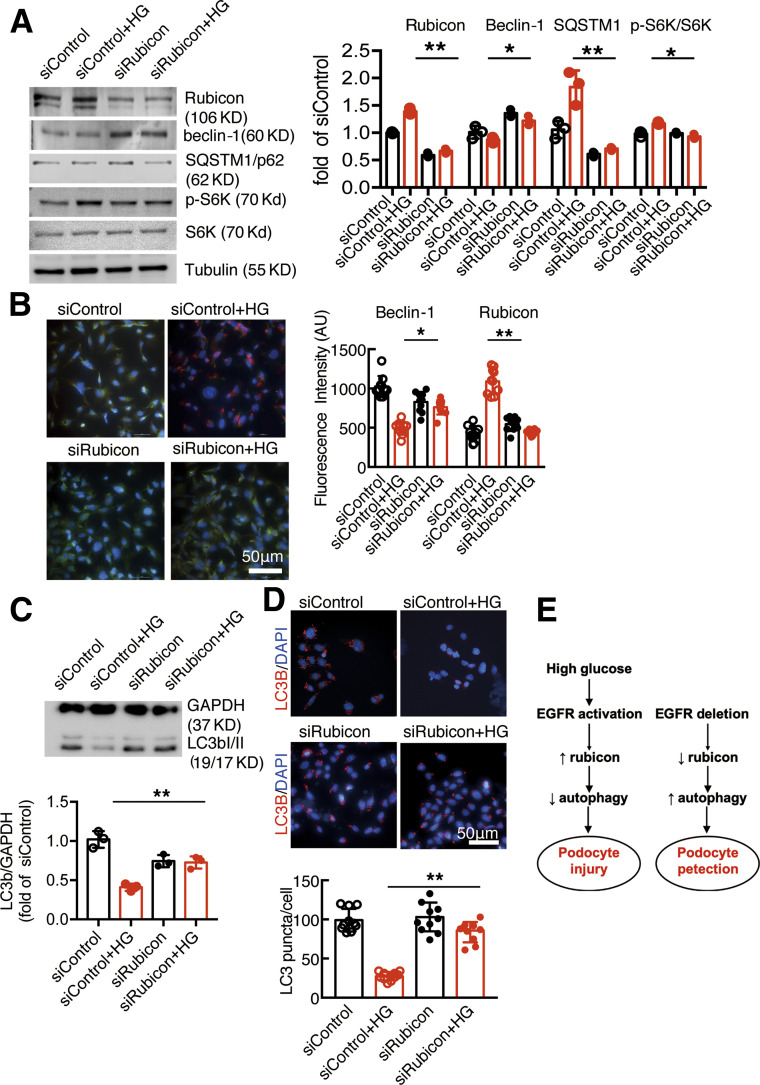
Renal epidermal growth factor receptor (EGFR) signaling is activated in models of diabetic nephropathy (DN), and inhibition of the EGFR signaling pathway protects against the development of DN. We have now determined that in cultured podocytes, high glucose led to increases in activation of EGFR signaling but decreases in autophagy activity as indicated by decreased beclin-1 and inhibition of LC3B autophagosome formation as well as increased rubicon (an autophagy inhibitor) and SQSTM1 (autophagy substrate). Either genetic (small interfering [si]EGFR) or pharmacologic (AG1478) inhibition of EGFR signaling attenuated the decreased autophagy activity. In addition, rubicon siRNA knockdown prevented high glucose-induced inhibition of autophagy in podocytes. We further examined whether selective EGFR deletion in podocytes affected the progression of DN in type 2 diabetes. Selective podocyte EGFR deletion had no effect on body weight or fasting blood sugars in either db/db mice or nos3 -/-; db/db mice, a model of accelerated type 2 DN. However selective podocyte EGFR deletion led to relative podocyte preservation and marked reduction in albuminuria and glomerulosclerosis, renal proinflammatory cytokine/chemokine expression, and decreased profibrotic and fibrotic components in nos3 -/-; db/db mice. Podocyte EGFR deletion led to decreased podocyte expression of rubicon, in association with increased podocyte autophagy activity. Therefore, activation of EGFR signaling in podocytes contributes to progression of DN at least in part by increasing rubicon expression, leading to subsequent autophagy inhibition and podocyte injury.


Figures

Figure 3
Figure 3
Confirmation of selective EGFR deletion in podocytes in nos3−/− db/db mice. A: schematic of generating podocyte-specific deletion of egfr using Nphs2-Cre mice and Cre-Lox technique. B: NOS3 knockout, db/db, EGFR deletion of exon 3, and Cre expression were verified by PCR using genomic DNA as the template. C: EGFR attenuation in podocytes was confirmed by immunoblotting of isolated glomerular lysates. D: With mice at 20 weeks of age, phosphorylated EGFR (Try845) and EGFR were colocalized with most of the WT1-positive (a marker of podocyte nuclei) cells (arrows) in egfrf/f; nos3−/−; db/db (nos3−/−; db/db) mice. In contrast, most of the WT1-positive cells were phosphorylated EGFR (Try845) and EGFR negative or had very weak EGFR staining (arrowheads) in nphs2-Cre; egfrf/f; nos3−/−; db/db (egfrpodKO; nos3−/−; db/db), confirming efficient and selective EGFR deletion in podocytes. bp, base pairs; WT, wild type.
Figure 1
Figure 1
EGFR activation increased rubicon expression and inhibited autophagic flux in cultured podocytes. A: Exposure of podocytes to high glucose (HG) led to activation of EGFR signaling, and increases in SQSTM1 and rubicon expression were inhibited with AG1478, an EGFR tyrosine kinase inhibitor. B: High glucose–induced beclin-1 inhibition and rubicon stimulation were inhibited with AG1478 (C). AG1478 inhibited HG-induced phosphorylated (p-)S6K and phosphorylated S6 activation. D and E: AG1478 increased LC3B abundance (N = 10 fields per group) and LC3B autophagosomes in podocytes. For measurement of LC3B II turnover, the podocytes were examined without (−) or with (+) treatment with 50 μmol/L chloroquine (CQ.) for 16 h. *P < 0.05 and **P < 0.01 vs. high glucose group, N = 3 independent repeats, one-way ANOVA with Bonferroni post hoc test. AU, arbitrary units; Veh, vehicle.
Figure 2
Figure 2
Knockdown of EGFR attenuated increased rubicon expression and promoted autophagic flux in cultured podocytes. A and B: siRNA knockdown of podocyte EGFR led to less activation of EGFR signaling and decreased SQSTM1, rubicon, and phosphorylated (p-)S6K expression. C and D: High glucose–induced beclin-1 inhibition and rubicon stimulation in podocytes were abolished by siEGFR. E and F: siRNA knockdown of podocyte EGFR increased LC3B abundance after exposure to high glucose compared with control siRNA, which promoted autophagosome production. *P < 0.05 and **P < 0.01 vs. siControl group with high glucose (HG), N = 3 independent repeats, one-way ANOVA with Bonferroni post hoc test. AU, arbitrary units.
Figure 4
Figure 4
Podocyte EGFR deficiency attenuated the development of DN in type 2 diabetes. A and B: egfrf/f; db/db (db/db) mice had moderate albuminuria at 30 and 40 weeks of age (A) as well as mesangial expansion at 40 weeks of age (B), and EGFR deletion in podocytes attenuated these parameters. **P < 0.01, ***P < 0.001 (n = 11 in each group). Original magnification: ×100. C: EGFR deletion in podocytes decreased glomerulosclerosis in nos3−/−; db/db mice as indicated by periodic acid Schiff staining (right panel shows quantitative glomerular sclerosis index). ***P < 0.001, n = 10 in each group. D: EGFR deletion in podocytes decreased serum creatinine. *P < 0.05, n = 7 in each group. E: The progressive increases in albuminuria seen in egfrf/f; nos3−/−; db/db (nos3−/−; db/db) mice were attenuated in nphs2-Cre; egfrf/f; nos3−/−; db/db (egfrpodKO; nos3−/−; db/db) mice. *P < 0.05, **P < 0.01 vs. the corresponding nos3−/−; db/db group (n = 16 in nos3−/−; db/db group and n = 12 in egfrpodKO; nos3−/−; db/db group). F: Podocyte EGFR deficiency markedly slowed the loss of podocytes in nos3−/−; db/db mice, as indicated by increased renal mRNA levels of nphs2, a specific marker of podocytes. ***P < 0.001, n = 6 in each group. G: Podocyte EGFR deficiency significantly slowed the loss of podocytes in nos3−/−; db/db mice, as indicated by fluorescent red WT1 staining, a marker of podocyte nuclei. Right panel shows podocyte number in each glomerulus section from different groups. ***P < 0.001, n = 4 in each group, two-tailed unpaired Student t test.
Figure 5
Figure 5
Podocyte EGFR deficiency decreased renal fibrosis in glomerulus and tubulointerstitium in nos3−/− db/db mice. Both egfrf/f; nos3−/−; db/db (nos3−/−; db/db) mice and nphs2-Cre; egfrf/f; nos3−/−; db/db (EgfrpodKO; nos3−/−; db/db) mice were sacrificed at 20 weeks old. A: EGFR deletion in podocytes led to markedly decreased renal fibrosis in glomerulus and tubulointerstitium, as indicated by Sirius red staining. Original magnification: ×200. B: EGFR deletion in podocytes led to decreased renal mRNA levels of profibrotic and fibrotic components, including Col1a1 (collagen I), Col4a1 (collagen IV), and Tgfb1 (TGF-β1). **P < 0.01, n = 6 in each group. CE: EGFR deletion in podocytes also decreased renal protein expression of col1a1, col4a1, acta2, and CTGF in both glomerulus and tubulointerstitium. *P < 0.05, n = 3 in nos3−/−; db/db group and n = 4 in egfrpodKO; nos3−/−; db/db group. Two-tailed unpaired Student t test.
Figure 6
Figure 6
Podocyte EGFR deficiency decreased renal macrophage infiltration and renal proinflammatory cytokines in nos3−/− db/db mice. Both egfrf/f; nos3−/−; db/db (nos3−/−; db/db) mice and nphs2-Cre; egfrf/f; nos3−/−; db/db (egfrpodKO; nos3−/−; db/db) mice were sacrificed at 20 weeks of age. A: EGFR deletion in podocytes led to decreased renal macrophage infiltration, as indicated by F4/80 staining, a marker of macrophages. Original magnification: ×400. B: EGFR deletion in podocytes decreased renal mRNA levels of IRF5, a transcription factor inducing macrophage M1 polarization, and NOS2, a marker of M1 macrophages. *P < 0.05, n = 6 in each group. C: EGFR deletion in podocytes led to decreased renal mRNA levels of proinflammatory cytokines/chemokines, including IL23, IL1α, IL1β, CCL3, TNFα, and IL6. *P < 0.05, **P < 0.01 (n = 6 in each group), two-tailed unpaired Student t test.
Figure 7
Figure 7
Podocyte EGFR deficiency led to increased autophagy in podocytes in nos3−/− db/db mice. Both nos3−/−; db/db (nos3−/−; db/db) mice and nos3−/−; db/db (EgfrpodKO; nos3−/−; db/db) mice were sacrificed at 20 weeks old. A: Representative kidney sections were stained and indicated that podocyte EGFR deletion decreased rubicon, SQSTM1, and phosphorylated (p)RPS6 (Ser240/244) protein expression and increased renal beclin-1. Quantification for rubicon, pRPS6/RPS6, and beclin-1 (colocalized with WT1, a podocyte nucleus marker) glomerulus represents results from 30 glomeruli each from five mice. **P < 0.01. B and C: Western blot of glomerular lysates obtained from nos3−/−; db/db (nos3−/−; db/db) mice and nos3−/−; db/db (egfrpodKO; nos3−/−; db/db) mice for rubicon, beclin-1, phosphorylated RPS6/RPS6 protein expression, LC3B I/II turnover and SQSTM1 abundance. *P < 0.05, **P < 0.01, n = 3 in nos3−/− group, n = 3 in nos3−/−; db/db group, and n = 3 in egfrpodKO; nos3−/−; db/db group; one-way ANOVA with Bonferroni post hoc test.
Figure 8
Figure 8
Rubicon knocking down attenuated EGFR-mediated inhibition of podocyte autophagy. A: Knocking down of rubicon increased beclin-1 but decreased SQSTM1 and phosphorylated (p-)s6K levels in podocyte in the presence of high glucose (HG). B: High glucose–induced beclin-1 inhibition and rubicon stimulation in podocytes were abolished by siRubicon. C and D: Knocking down of rubicon increased autophagy flux in podocytes in the presence of high glucose. *P < 0.05 and **P < 0.01 vs. siControl with high glucose. N = 3 independent repeats. E: Left: High glucose activates podocyte EGFR, leading to increased rubicon and subsequent inhibition of autophagy and podocyte injury. Right: EGFR inhibition leads to decreased rubicon and subsequent activation of autophagy and podocyte protection. One-way ANOVA with Bonferroni post hoc test. AU, arbitrary units.

Similar articles

Cited by

References

    1. Fineberg D, Jandeleit-Dahm KA, Cooper ME. Diabetic nephropathy: diagnosis and treatment. Nat Rev Endocrinol 2013;9:713–723 - PubMed
    1. Wang X, Yao B, Wang Y, et al. . Macrophage cyclooxygenase-2 protects against development of diabetic nephropathy. Diabetes 2017;66:494–504 - PMC - PubMed
    1. Wolf G, Chen S, Ziyadeh FN. From the periphery of the glomerular capillary wall toward the center of disease: podocyte injury comes of age in diabetic nephropathy. Diabetes 2005;54:1626–1634 - PubMed
    1. Zhang MZ, Wang X, Yang H, et al. . Lysophosphatidic acid receptor antagonism protects against diabetic nephropathy in a type 2 diabetic model. J Am Soc Nephrol 2017;28:3300–3311 - PMC - PubMed
    1. Yi M, Zhang L, Liu Y, et al. . Autophagy is activated to protect against podocyte injury in adriamycin-induced nephropathy. Am J Physiol Renal Physiol 2017;313:F74–F84 - PMC - PubMed

Publication types

Substances