. 2020 Nov 25;6(48):eabc5739.
doi: 10.1126/sciadv.abc5739. Print 2020 Nov.

Functionally distinct resident macrophage subsets differentially shape responses to infection in the bladder

Affiliations

Functionally distinct resident macrophage subsets differentially shape responses to infection in the bladder

Livia Lacerda Mariano et al. Sci Adv. .

Abstract

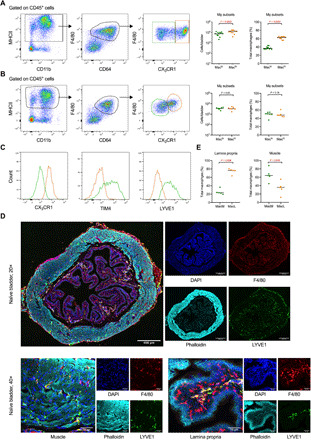
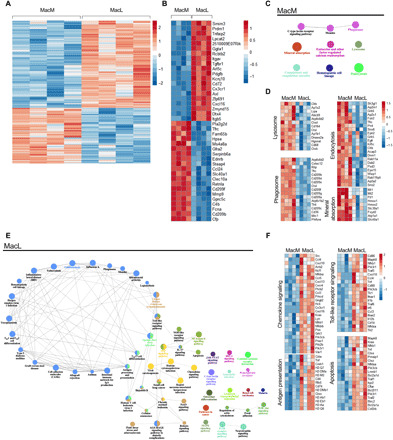
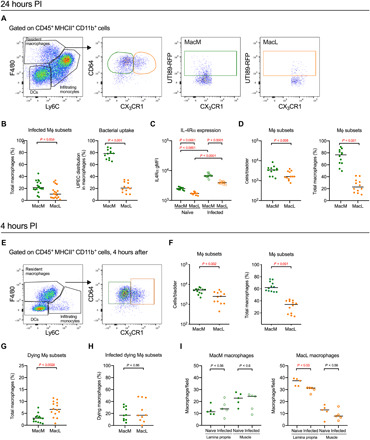
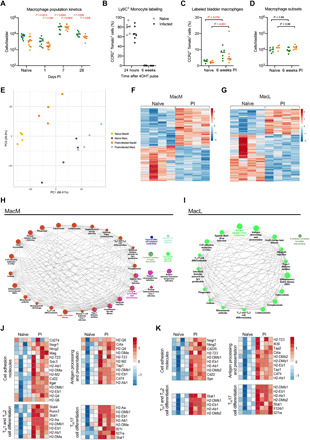
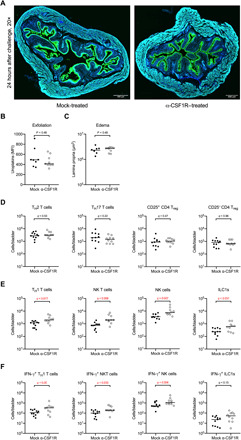
Resident macrophages are abundant in the bladder, playing key roles in immunity to uropathogens. Yet, whether they are heterogeneous, where they come from, and how they respond to infection remain largely unknown. We identified two macrophage subsets in mouse bladders, MacM in muscle and MacL in the lamina propria, each with distinct protein expression and transcriptomes. Using a urinary tract infection model, we validated our transcriptomic analyses, finding that MacM macrophages phagocytosed more bacteria and polarized to an anti-inflammatory profile, whereas MacL macrophages died rapidly during infection. During resolution, monocyte-derived cells contributed to tissue-resident macrophage pools and both subsets acquired transcriptional profiles distinct from naïve macrophages. Macrophage depletion resulted in the induction of a type 1-biased immune response to a second urinary tract infection, improving bacterial clearance. Our study uncovers the biology of resident macrophages and their responses to an exceedingly common infection in a largely overlooked organ, the bladder.


Figures

Fig. 1
Fig. 1. Two macrophage subsets are resident in adult naïve mouse bladders.
(A to C) Bladders from 7-week-old female CX3CR1GFP/+ and C57BL6/J mice were analyzed by flow cytometry. (A and B) Dot plots depict the gating strategy for macrophages subsets and graphs show the total cell number (log scale, left) and proportion (right) of bladder macrophage subset, derived from cytometric analysis in (A) CX3CR1GFP/+ and (B) C57BL6/J mice. (C) Histograms show the relative expression of CX3CR1, TIM4, and LYVE1 on macrophage subsets in C57BL6/J mice, Maclo is green and Machi is orange. (See fig. S1 for data on expression of additional proteins). (D) Representative confocal images of bladders from C57BL6/J mice at 20× and 40×. Merged images and single channels with the target of interest are shown. DAPI, 4′,6-diamidino-2-phenylindole. (E) Graphs show the proportion of each macrophage subset in the lamina propria and muscle of naïve C57BL6/J mice. Data are pooled from three experiments, n = 3 to 6 mice per experiment. Each dot represents one mouse; lines are medians. Significance was determined using the nonparametric Mann-Whitney test to compare macrophage subset numbers (A and B) and the nonparametric Wilcoxon matched-pairs signed-rank test to compare the macrophage subset percentages (A, B, and E). All P values are shown; statistically significant P values (<0.05) are in red.
Fig. 2
Fig. 2. Bladder-resident macrophages are long-lived HSC-derived cells.
(A) Merged confocal and single channel images from a C57BL/6 newborn mouse bladder. Left image is enlarged at the right. Gating strategy in Cdh5-CreERT2Rosa26tdTomato CX3CR1GFP newborn mice and E16.5 embryos; histograms show CX3CR1 and MHC II expression. (B to E) Reporter recombination in microglia, monocytes, bladder macrophages, and MacM and MacL subsets in Cdh5-CreERT2Rosa26tdTomato mice: (B) E16.5 embryos, newborns 4-hydroxytamoxifen (4OHT)-treated at E7.5, (C) adults 4OHT-treated at E7.5, (D) E16.5 embryos, newborns 4OHT-treated at E10.5, (E) adults 4OHT-treated at E10.5. (F) Percentage of YFP+ cells in microglia, monocytes, MacM, and MacL macrophages in adult Flt3CreRosa26YFP mice. (G to I) Adult shield-irradiated C57BL/6 CD45.2 mice reconstituted with CCR2+/+ CD45.1 BM and C57BL/6 CD45.1 mice reconstituted with CCR2−/− CD45.2 BM. Percentage of donor cells (G) in monocytes or (H) bladder-resident macrophages in mice transplanted with CCR2+/+ or CCR2−/− BM at 3 and 6 months after transplantation. (See fig. S2 for data on blood leukocyte chimerism). (I) Bladder-resident macrophage replacement rate. Data pooled from two to three experiments, n = 2 to 6 mice per experiment. Each point represents one mouse; lines are medians. Significance determined using the Mann-Whitney test comparing (B to F) macrophages or subsets to monocytes or (G and H) CCR2+/+ to CCR2−/− recipients, P values were corrected for multiple testing using the false discovery rate (FDR) method. All P values are shown; statistically significant P values (<0.05) are in red.
Fig. 3
Fig. 3. Naïve macrophage subsets have different transcriptional programs in the naïve bladder.
MacM and MacL macrophages were sorted from 7- to 8-week-old female naïve adult C57BL/6 mouse bladders and analyzed by RNA-seq (fig. S3, gating strategy). (A) Heatmaps show the gene expression profile of the 1475 differentially expressed genes and (B) the 20 most differentially expressed genes between the MacM and MacL subsets. (C to F) Using Kyoto Encyclopedia of Genes and Genomes (KEGG) pathway analysis of significantly up-regulated genes, the following are depicted: (C) pathways enriched in MacM macrophages, (D) up-regulated genes associated with selected pathways in MacM macrophages, (E) pathways enriched in MacL macrophages, and (F) up-regulated genes associated with selected pathways in MacL macrophages. In (C) and (E), the size of the nodes reflects the statistical significance of the term. (Q < 0.05; terms > 3 genes; % genes/term > 3; κ 0.4).
Fig. 4
Fig. 4. Macrophage subsets have divergent roles in UTI.
(A to H) Female C57BL6/J mice were infected with UTI89-RFP and bladders were analyzed by flow cytometry at (A to D) 24 hours or (E to H) 4 hours PI. (A) Gating strategy, resident macrophage subsets, and cells containing bacteria. (B) Percentage of infected macrophage subsets and UPEC distribution (fig. S4B, gating strategy). (C) IL-4Rα gMFI (geometric mean fluorescence intensity) in naïve mice and 24 hours PI. (D) Total number and frequency of bladder macrophage subsets. (E) Gating strategy. (F) Total number and frequency of bladder macrophage subsets. Percentage of (G) macrophage subsets labeled with a live/dead marker (fig. S4D, gating strategy) and (H) dying macrophages containing UPEC. (I) MacM and MacL macrophage quantification in naïve mice and 4 hours PI. (B to D and F to H) Data pooled from three experiments, n = 3 to 6 mice per experiment. (I) Data are pooled from two experiments, n = 2 to 3 mice per experiment. Each dot represents one mouse; lines are medians. In (D) and (F), Mann-Whitney test was used to compare the numbers and the nonparametric Wilcoxon matched-pairs signed-rank test was used to compare the percentages of each macrophage subset. (B and C and G to I) Mann-Whitney test. P values were corrected for multiple testing using the FDR method. All P values are shown; statistically significant P values (<0.05) are in red.
Fig. 5
Fig. 5. Macrophage subset transcriptional profiles are altered by UTI.
(A) Total number of MacM (green) and MacL (orange) in naïve and 1-, 7-, or 28-day PI mice. (B and C) CCR2CreERT2Rosa26tdTomato mice were pulsed with 4OHT. Twenty-four hours later, half were infected with UTI89-RFP. Percentage of Tomato+ (B) Ly6C+ monocytes 24 hours and 6 weeks after 4OHT-pulse or (C) bladder macrophage subsets 6 weeks after 4OHT-pulse. (D) Total number of macrophage subsets in naïve and 6-week PI bladders. (E) Replicate-adjusted principal component analysis of all genes from naïve and post-infected bladder macrophage subsets. Differentially expressed genes between naïve and 6-week PI (F) MacM (513 genes) and (G) MacL (617 genes) macrophages. KEGG pathway analysis of significantly up-regulated genes, enriched in 6-week PI (H) MacM and (I) MacL macrophages. Up-regulated genes from selected pathways in 6-week PI (J) MacM and (K) MacL macrophages. (A, C, and D) Mann-Whitney test comparing infection to naïve. P values were corrected for multiple testing using the FDR method. Higher left-shifted P values refer to MacM and lower right-shifted P values refer to MacL. (H and I) Node size reflects statistical significance of the term (Q < 0.05; terms > 3 genes; %genes/term > 3; κ 0.4). All P values are shown; statistically significant P values (<0.05) are in red.
Fig. 6
Fig. 6. Macrophage depletion before challenge infection promotes improved bacterial clearance.
(A) Experimental scheme. (B) Efficacy of macrophage subset depletion in naïve C57BL/6 mice treated with 500 or 800 μg of anti-CSF1R antibody. (C and D) Bacterial burden per bladder 24 hours after challenge in female C57BL/6 mice infected with UTI89-RFP according to (A) and treated with phosphate-buffered saline (PBS) (mock) or (C) 500 μg or (D) 800 μg of anti-CSF1R antibody 72 hours before being challenged with the isogenic UTI89-GFP strain. (E to G) Mice were infected according to (A) and treated with 800 μg of anti-CSF1R antibody 72 hours before challenge infection with 107 CFU of the isogenic UTI89-GFP strain. Graphs depict the (E) total number of the indicated cell type, (F) the percentage of the indicated cell type that was infected, and (G) the total number of the indicated cell type that contained UPEC at 24 hours after challenge in mice treated with PBS or 800 μg of anti-CSF1R antibody. Data are pooled from three experiments, n = 3 to 6 mice per experiment. Each dot represents one mouse; lines are medians. (C to G) Mann-Whitney test, P values were corrected for multiple testing using the FDR method. All P values are shown; statistically significant P values (<0.05) are in red.
Fig. 7
Fig. 7. Depletion of replaced macrophages leads to a type I immune bias.
Female C57BL/6 mice were infected according to the scheme shown in Fig. 6A and treated with 800 μg of anti-CSF1R antibody 72 hours before challenge infection with 107 CFU of UTI89. (A) Representative confocal images of bladders from mice treated with PBS or 800 μg of anti-CSF1R antibody 24 hours after challenge. Uroplakin, green; phalloidin, turquoise; DAPI, blue. (B) The graph shows the mean fluorescence intensity of uroplakin expression, quantified from imaging, at 24 hours after challenge. (C) The graph shows the area of the lamina propria, quantified from imaging, at 24 hours after challenge. (D to F) Graphs depict the (D and E) total number of the indicated cell type or (F) the total number of the indicated cell type expressing IFN-γ at 24 hours after challenge infection. Data are pooled from two experiments, n = 4 to 6 mice per experiment. Each dot represents one mouse; lines are medians. In (B) to (F), significance was determined using the nonparametric Mann-Whitney test and P values were corrected for multiple testing using the FDR method. All calculated/corrected P values are shown and P values meeting the criteria for statistical significance (P < 0.05) are depicted in red.

Similar articles

Cited by

References

    1. Wynn T. A., Chawla A., Pollard J. W., Macrophage biology in development, homeostasis and disease. Nature 496, 445–455 (2013). - PMC - PubMed
    1. Epelman S., Lavine K. J., Randolph G. J., Origin and functions of tissue macrophages. Immunity 41, 21–35 (2014). - PMC - PubMed
    1. Amit I., Winter D. R., Jung S., The role of the local environment and epigenetics in shaping macrophage identity and their effect on tissue homeostasis. Nat. Immunol. 17, 18–25 (2016). - PubMed
    1. Ingersoll M. A., Albert M. L., From infection to immunotherapy: Host immune responses to bacteria at the bladder mucosa. Mucosal Immunol. 6, 1041–1053 (2013). - PubMed
    1. Lacerda Mariano L., Ingersoll M. A., Bladder resident macrophages: Mucosal sentinels. Cell. Immunol. 330, 136–141 (2018). - PubMed

Publication types