. 2020 Nov 23;21(22):8852.
doi: 10.3390/ijms21228852.

Connexin43 Region 266-283, via Src Inhibition, Reduces Neural Progenitor Cell Proliferation Promoted by EGF and FGF-2 and Increases Astrocytic Differentiation

Affiliations

Connexin43 Region 266-283, via Src Inhibition, Reduces Neural Progenitor Cell Proliferation Promoted by EGF and FGF-2 and Increases Astrocytic Differentiation

Rocío Talaverón et al. Int J Mol Sci. .

Abstract

Neural progenitor cells (NPCs) are self-renewing cells that give rise to the major cells in the nervous system and are considered to be the possible cell of origin of glioblastoma. The gap junction protein connexin43 (Cx43) is expressed by NPCs, exerting channel-dependent and -independent roles. We focused on one property of Cx43-its ability to inhibit Src, a key protein in brain development and oncogenesis. Because Src inhibition is carried out by the sequence 266-283 of the intracellular C terminus in Cx43, we used a cell-penetrating peptide containing this sequence, TAT-Cx43266-283, to explore its effects on postnatal subventricular zone NPCs. Our results show that TAT-Cx43266-283 inhibited Src activity and reduced NPC proliferation and survival promoted by epidermal growth factor (EGF) and fibroblast growth factor-2 (FGF-2). In differentiation conditions, TAT-Cx43266-283 increased astrocyte differentiation at the expense of neuronal differentiation, which coincided with a reduction in Src activity and β-catenin expression. We propose that Cx43, through the region 266-283, reduces Src activity, leading to disruption of EGF and FGF-2 signaling and to down-regulation of β-catenin with effects on proliferation and differentiation. Our data indicate that the inhibition of Src might contribute to the complex role of Cx43 in NPCs and open new opportunities for further research in gliomagenesis.

Keywords: Cx43; astrocytes; connexin; glioma stem cells; neural precursors; neural progenitor cells; neurons; ß-catenin.


Conflict of interest statement

The authors declare no conflict of interest.

Figures
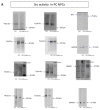
Figure A1
Figure A1
Full Western blots and replicates analyzed in different conditions. (A) Full Western blots and replicates analyzed in Figure 3C. (B) Full Western blots and replicates analyzed in Figure 5C,D. (C) Full Western blots and replicates analyzed in Figure 6A. (D) Full Western blots and replicates analyzed in Figure 6D.
Figure A1
Figure A1
Full Western blots and replicates analyzed in different conditions. (A) Full Western blots and replicates analyzed in Figure 3C. (B) Full Western blots and replicates analyzed in Figure 5C,D. (C) Full Western blots and replicates analyzed in Figure 6A. (D) Full Western blots and replicates analyzed in Figure 6D.
Figure A2
Figure A2
Effect of TAT-Cx43266–283 on Cx43 expression in neural progenitor cells in differentiation conditions. Representative images showing Cx43 immunoreactivity (green) in neural progenitor cells grown in differentiation conditions (DC NPCs) treated with 25 µM TAT or TAT-Cx43266–283 for 96 h. Cell nuclei were labeled with DAPI (blue). Bar: 50 µm. Bar graphs show the percentage of Cx43-positive cells after 96 h of treatment in each experimental condition. Results are the mean ± SEM (n= 6 TAT, n = 6 TAT-Cx43266–283, not significant; Student’s t-test).
Figure 1
Figure 1
Neural progenitor cells of the postnatal subventricular zone in proliferation and differentiation conditions. (A). Schematic drawing of the design of the protocol used in this study. The subventricular zones (SVZ, in red) adjacent to the lateral ventricles (LV) were dissected out from coronal slices obtained from 7-day postnatal rat brains, and neural progenitor cells (NPCs) contained in this region were cultured in the form of neurospheres, as described in Methods. Neurosphere-derived NPCs were exposed to different treatments in proliferation conditions (PC) or in differentiation conditions (DC). (B). Phase-contrast photomicrograph showing neurospheres or floating cell aggregates of NPCs in proliferation conditions (PC NPCs) without treatments. (C). Phase-contrast photomicrograph showing NPCs grown in differentiation conditions (DC NPCs) without treatments. Bar: 100 µm. EGF (epidermal growth factor), FGF-2 (fibroblast growth factor).
Figure 2
Figure 2
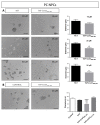
Effect of TAT-Cx43266–283 on neurosphere size in proliferation conditions. (A) Phase-contrast images of neural progenitor cells grown in proliferation conditions (PC NPCs) after treatment with 10, 25, or 50 μM of TAT or TAT-Cx43266–283 for 72 h. Bar: 100 µm. Quantification of neurosphere diameter after 72 h treatment with 10–50 µM of TAT or TAT-Cx43266–283. Data are the mean ± SEM of n = 6–7 (** p < 0.01, Mann–Whitney Rank Sum Test). (B) Phase-contrast images of PC NPCs untreated (control) or treated with 25 μM control peptide, TAT-Cx43274–291, for 72 h. Bar: 100 µm. Quantification of neurosphere diameter in untreated cultures (control) or cultures treated with 25 µM TAT, 25 μM TAT-Cx43266–283, or 25 μM TAT-Cx43274–291 for 72 h. Data are the mean ± SEM, n = 12 (control), n = 9 (TAT), n = 7 (TAT-Cx43266–283), n = 4 (TAT-Cx43274–291) (*** p < 0.001 vs. control; ### p < 0.001 vs. TAT; @@@ p < 0.001 vs. TAT-Cx43274–291, ANOVA, followed by Holm–Sidak).
Figure 3
Figure 3
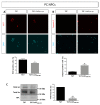
Effect of TAT-Cx43266–283 on neural progenitor cell proliferation, apoptosis, and Src activity in proliferation conditions. (A,B) Representative epifluorescence images and quantifications of Ki67 (A, in red) or caspase-3 (B, in red) immunostaining in cultures of neural progenitor cells in proliferation conditions (PC NPCs) treated with 25 μM TAT or TAT-Cx43266–283 for 72 h. Cell nuclei of the same fields were visualized by DAPI staining (turquoise). Bar: 75 µm. Results are expressed as percentage of Ki67-positive cells (in A) or caspase-3-positive cells (in B) and are the mean ± SEM (n = 3; * p < 0.05; ** p < 0.01; Student’s t-test). (C) Western blotting showing Y416 Src and total Src in PC NPCs treated with 25 µM TAT or TAT-Cx43266–283 for 72 h. Quantification of Y416 Src/Src ratio expressed as a percentage with respect to TAT. Results are expressed as mean ± SEM (n = 4; *** p < 0.001; Student’s t-test).
Figure 4
Figure 4
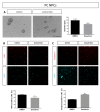
Effect of Dasatinib on neurosphere size, neural progenitor cell proliferation, and apoptosis in proliferation conditions. (A) Phase-contrast images of neural progenitor cells in proliferation conditions (PC NPCs) after 72 h treatment with dimethyl sulfoxide (DMSO) or with 1 μM Dasatinib. Bar: 100 µm. Quantification of neurosphere diameter after 72 h treatment with DMSO or with 1 μM Dasatinib. Data are the mean ± SEM (n = 8; * p < 0.05 compared to DMSO; Mann–Whitney Rank Sum Test). (B,C) Representative epifluorescence images and quantifications of Ki67 (B, in red) or caspase-3 (C, in red) immunostaining in PC NPCs treated with DMSO or with 1 μM Dasatinib for 72 h. Cell nuclei of the same fields were identified by DAPI staining (turquoise). Bar: 75 µm. Results are expressed as percentage of Ki67-positive cells or caspase-3-positive cells and are the mean ± SEM (n = 3; * p < 0.05, *** p < 0.001; Student’s t-test).
Figure 5
Figure 5
Effect of TAT-Cx43266–283 on neural progenitor cells in differentiation conditions. (A,B) Representative images showing doublecortin (DCX) immunoreactivity (red) and glial fibrillary acidic protein (GFAP) immunoreactivity (green) in neural progenitor cells grown in differentiation conditions (DC NPCs) treated with 25 µM TAT, TAT-Cx43266–283, or TAT-Cx43274–291 for 96 h. Cell nuclei are labeled with DAPI (blue). Bar: 50 µm. Bar graphs show the percentage of DCX-positive and GFAP-positive cells after 96 h of treatment in each experimental condition. Results are the mean ± SEM (n= 9 TAT, n = 4 TAT-Cx43266–283, n = 3 TAT-Cx43274–291; *** p < 0.001, ** p < 0.01 vs. TAT; @@ p < 0.01, @ p < 0.05 vs. TAT-Cx43274–291; ANOVA, followed by Hom Sidak). (C,D) Total DCX and GFAP levels were analyzed by Western blot in DC NPCs treated with 25 µM TAT or TAT-Cx43266–283 for 96 h. Results were normalized against GAPDH and are expressed as percentage with respect to TAT (mean ± SEM, n = 4; * p < 0.05; *** p < 0.001; Student’s t-test).
Figure 6
Figure 6
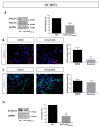
Involvement of Src and β-catenin in the effects of TAT-Cx43266–283 on neural progenitor cell differentiation. (A) Western blots showing Y416 Src and total Src in neural progenitor cells treated with 25 µM of TAT or TAT-Cx43266–283 in differentiation conditions for 96 h. Quantification of Y416 Src/Src ratio expressed as a percentage of TAT. Results are the mean ± SEM (n = 5; ** p < 0.01; Student’s t-test). (B) Representative images showing doublecortin (DCX) immunoreactivity (red) in neural progenitor cells in differentiation conditions (DC NPCs) after 96 h of treatment with DMSO or with 1 µM Dasatinib. Cell nuclei were labeled with DAPI (blue). Bar: 50 µm. Percentage of DCX-positive cells in both experimental conditions. Results are shown as mean ± SEM (n = 5; ** p < 0.01; Student’s t-test). (C) Representative images showing glial fibrillary acidic protein (GFAP) immunoreactivity (green) in DC NPCs after 96 h of treatment with DMSO or with 1 µM Dasatinib. Cell nuclei are labeled with DAPI (blue). Bar: 50 µm. Percentage of GFAP-positive cells in both experimental conditions. Results are shown as mean ± SEM (n= 6; non-significant differences; Student’s t-test). (D) β-catenin levels were analyzed by western blotting in DC NPCs treated with 25 µM of TAT or TAT-Cx43266–283 for 96 h. The bar graph shows the ratio of β-catenin/GAPDH in percentage with respect to TAT (mean ± SEM; n = 3; ** p < 0.01; Student’s t-test).

Similar articles

Cited by

References

    1. Gage F.H. Mammalian neural stem cells. Science. 2000;287:1433–1438. doi: 10.1126/science.287.5457.1433. - DOI - PubMed
    1. Anderson D.J. Stem cells and pattern formation in the nervous system: The possible versus the actual. Neuron. 2001;30:19–35. doi: 10.1016/s0896-6273(01)00260-4. - DOI - PubMed
    1. Alvarez-Buylla A., Seri B., Doetsch F. Identification of neural stem cells in the adult vertebrate brain. Brain Res. Bull. 2002;57:751–758. doi: 10.1016/s0361-9230(01)00770-5. - DOI - PubMed
    1. Lee J.H., Lee J.E., Kahng J.Y., Kim S.H., Park J.S., Yoon S.J., Um J.Y., Kim W.K., Lee J.K., Park J., et al. Human glioblastoma arises from subventricular zone cells with low-level driver mutations. Nature. 2018;560:243–247. doi: 10.1038/s41586-018-0389-3. - DOI - PubMed
    1. Duan S., Yuan G., Liu X., Ren R., Li J., Zhang W., Wu J., Xu X., Fu L., Li Y., et al. PTEN deficiency reprogrammes human neural stem cells towards a glioblastoma stem cell-like phenotype. Nat. Commun. 2015;6:10068. doi: 10.1038/ncomms10068. - DOI - PMC - PubMed

MeSH terms

LinkOut - more resources