Candesartan modulates microglia activation and polarization via NF-κB signaling pathway
- PMID: 33237822
- PMCID: PMC7691946
- DOI: 10.1177/2058738420974900
Candesartan modulates microglia activation and polarization via NF-κB signaling pathway
Abstract
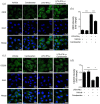
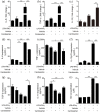
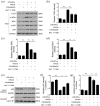
Microglia are diverse cells that acquire different functional phenotypes in response to microenvironment in which they reside. Several transcriptional regulators have been identified that regulate different microglia phenotypes. They are mainly stimulated into two opposing phenotypes, classically (M1) and alternatively (M2) phenotype. Regulating microglia polarization from M1 to M2 state has been suggested as a potential therapeutic approach in treatment of CNS disorders. Candesartan, an angiotensin II type I receptors antagonist, exerts beneficial effects for antioxidant, anti-inflammation, neurotrophic, and anti-apoptotic function. However, the effect of candesartan on microglia polarization and underlying mechanisms remain unknown. In this study, the resting microglia were stimulated to M1 microglia with lipopolysaccharide (LPS) and interferon-γ (IFN-γ), and then treated with vehicle or candesartan for 24 h. RT-PCR was utilized to detect the mRNA expression of microglia phenotype markers and inflammatory cytokines. Microglia phenotype markers and toll-like receptor 4 (TLR4)/nuclear factor kappa B (NF-κB) pathway were determined by western blot. A neuron-microglia co-culture system was used to determine whether candesartan could ameliorate the neurotoxic effect of M1 microglia to oxygen-glucose deprivation (OGD) neuron. Candesartan treatment reduced the expression of M1 markers, and increased M2 markers. Meanwhile, candesartan reduced fluorescence intensity and protein level of M1 marker and enhanced M2 marker. Candesartan also regulated the neuroinflammatory response via reducing the release of pro-inflammatory cytokines and increasing anti-inflammatory cytokines in LPS + IFN-γ stimulated BV2 cells. Candesartan markedly inhibited the protein level of TLR4, the phosphorylation of IKBα and p65, and suppressed nuclear translocation of NF-κB p65. BAY 11-7085, a NF-κB inhibitor, remarkably enlarged the inhibitory effect of candesartan on NF-κB pathway. In addition, M1 phenotype microglia exacerbated post-OGD N2a cells death and LDH release, whereas candesartan reversed such neurotoxic effect. Candesartan treatment may ameliorate stroke-induced neuronal damage through shifting microglia to M2 phenotype in a TLR4/NF-κB-dependent manner.
Keywords: BV2 cells; NF-κB; candesartan; microglia polarization; neuroinflammation.
Conflict of interest statement
Figures


Similar articles
-
Oxymatrine inhibits neuroinflammation byRegulating M1/M2 polarization in N9 microglia through the TLR4/NF-κB pathway.Int Immunopharmacol. 2021 Nov;100:108139. doi: 10.1016/j.intimp.2021.108139. Epub 2021 Sep 10. Int Immunopharmacol. 2021. PMID: 34517275
-
Baicalein ameliorates ischemic brain damage through suppressing proinflammatory microglia polarization via inhibiting the TLR4/NF-κB and STAT1 pathway.Brain Res. 2021 Nov 1;1770:147626. doi: 10.1016/j.brainres.2021.147626. Epub 2021 Aug 19. Brain Res. 2021. PMID: 34418356
-
Curcumin inhibits LPS-induced neuroinflammation by promoting microglial M2 polarization via TREM2/ TLR4/ NF-κB pathways in BV2 cells.Mol Immunol. 2019 Dec;116:29-37. doi: 10.1016/j.molimm.2019.09.020. Epub 2019 Oct 4. Mol Immunol. 2019. PMID: 31590042
-
The natural (poly)phenols as modulators of microglia polarization via TLR4/NF-κB pathway exert anti-inflammatory activity in ischemic stroke.Eur J Pharmacol. 2022 Jan 5;914:174660. doi: 10.1016/j.ejphar.2021.174660. Epub 2021 Dec 1. Eur J Pharmacol. 2022. PMID: 34863710 Review.
-
Ciprofloxacin and levofloxacin attenuate microglia inflammatory response via TLR4/NF-kB pathway.J Neuroinflammation. 2019 Jul 18;16(1):148. doi: 10.1186/s12974-019-1538-9. J Neuroinflammation. 2019. PMID: 31319868 Free PMC article. Review.
Cited by
-
Candesartan Effectively Preserves Cognition in Senescence Accelerated Mouse Prone 8 (SAMP8) mice.J Alzheimers Dis Rep. 2022 Jun 2;6(1):257-269. doi: 10.3233/ADR-220016. eCollection 2022. J Alzheimers Dis Rep. 2022. PMID: 35891637 Free PMC article.
-
Glia-Neurotrophic Factor Relationships: Possible Role in Pathobiology of Neuroinflammation-Related Brain Disorders.Int J Mol Sci. 2023 Mar 28;24(7):6321. doi: 10.3390/ijms24076321. Int J Mol Sci. 2023. PMID: 37047292 Free PMC article. Review.
-
Curcumin loaded hydrogel with double ROS-scavenging effect regulates microglia polarization to promote poststroke rehabilitation.Mater Today Bio. 2024 Aug 2;28:101177. doi: 10.1016/j.mtbio.2024.101177. eCollection 2024 Oct. Mater Today Bio. 2024. PMID: 39211291 Free PMC article.
-
Microglial Phenotypic Transition: Signaling Pathways and Influencing Modulators Involved in Regulation in Central Nervous System Diseases.Front Cell Neurosci. 2021 Sep 14;15:736310. doi: 10.3389/fncel.2021.736310. eCollection 2021. Front Cell Neurosci. 2021. PMID: 34594188 Free PMC article. Review.
-
Microglia Polarization From M1 to M2 in Neurodegenerative Diseases.Front Aging Neurosci. 2022 Feb 16;14:815347. doi: 10.3389/fnagi.2022.815347. eCollection 2022. Front Aging Neurosci. 2022. PMID: 35250543 Free PMC article. Review.
References
MeSH terms
Substances
LinkOut - more resources
Full Text Sources

