Effects of Agricultural Fungicide Use on Aspergillus fumigatus Abundance, Antifungal Susceptibility, and Population Structure
- PMID: 33234685
- PMCID: PMC7701986
- DOI: 10.1128/mBio.02213-20
Effects of Agricultural Fungicide Use on Aspergillus fumigatus Abundance, Antifungal Susceptibility, and Population Structure
Abstract
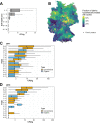
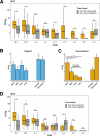
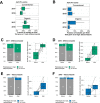
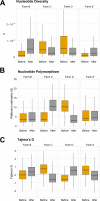
Antibiotic resistance is an increasing threat to human health. In the case of Aspergillus fumigatus, which is both an environmental saprobe and an opportunistic human fungal pathogen, resistance is suggested to arise from fungicide use in agriculture, as the azoles used for plant protection share the same molecular target as the frontline antifungals used clinically. However, limiting azole fungicide use on crop fields to preserve their activity for clinical use could threaten the global food supply via a reduction in yield. In this study, we clarify the link between azole fungicide use on crop fields and resistance in a prototypical human pathogen through systematic soil sampling on farms in Germany and surveying fields before and after fungicide application. We observed a reduction in the abundance of A. fumigatus on fields following fungicide treatment in 2017, a finding that was not observed on an organic control field with only natural plant protection agents applied. However, this finding was less pronounced during our 2018 sampling, indicating that the impact of fungicides on A. fumigatus population size is variable and influenced by additional factors. The overall resistance frequency among agricultural isolates is low, with only 1 to 3% of isolates from 2016 to 2018 displaying resistance to medical azoles. Isolates collected after the growing season and azole exposure show a subtle but consistent decrease in susceptibility to medical and agricultural azoles. Whole-genome sequencing indicates that, despite the alterations in antifungal susceptibility, fungicide application does not significantly affect the population structure and genetic diversity of A. fumigatus in fields. Given the low observed resistance rate among agricultural isolates as well the lack of genomic impact following azole application, we do not find evidence that azole use on crops is significantly driving resistance in A. fumigatus in this context.IMPORTANCE Antibiotic resistance is an increasing threat to human health. In the case of Aspergillus fumigatus, which is an environmental fungus that also causes life-threatening infections in humans, antimicrobial resistance is suggested to arise from fungicide use in agriculture, as the chemicals used for plant protection are almost identical to the antifungals used clinically. However, removing azole fungicides from crop fields threatens the global food supply via a reduction in yield. In this study, we survey crop fields before and after fungicide application. We find a low overall azole resistance rate among agricultural isolates, as well as a lack of genomic and population impact following fungicide application, leading us to conclude azole use on crops does not significantly contribute to resistance in A. fumigatus.
Keywords: Aspergillus; Aspergillus fumigatus; antibiotic resistance; antifungal resistance; azole; fungicide; population genomics.
Copyright © 2020 Barber et al.
Figures


Similar articles
-
Extensive Genetic Diversity and Widespread Azole Resistance in Greenhouse Populations of Aspergillus fumigatus in Yunnan, China.mSphere. 2021 Feb 10;6(1):e00066-21. doi: 10.1128/mSphere.00066-21. mSphere. 2021. PMID: 33568450 Free PMC article.
-
Azole and fungicide resistance in clinical and environmental Aspergillus fumigatus isolates.Med Mycol. 2005 May;43 Suppl 1:S307-11. doi: 10.1080/13693780500090826. Med Mycol. 2005. PMID: 16110825
-
Isolation of azole-resistant Aspergillus fumigatus from the environment in the south-eastern USA.J Antimicrob Chemother. 2017 Sep 1;72(9):2443-2446. doi: 10.1093/jac/dkx168. J Antimicrob Chemother. 2017. PMID: 28575384
-
Resistance in the Environmental Pathogenic Fungus Aspergillus fumigatus.Med Mycol J. 2019;60(3):61-63. doi: 10.3314/mmj.19.004. Med Mycol J. 2019. PMID: 31474691 Review.
-
Clinical implications of globally emerging azole resistance in Aspergillus fumigatus.Philos Trans R Soc Lond B Biol Sci. 2016 Dec 5;371(1709):20150460. doi: 10.1098/rstb.2015.0460. Philos Trans R Soc Lond B Biol Sci. 2016. PMID: 28080986 Free PMC article. Review.
Cited by
-
Drug Repurposing in Medical Mycology: Identification of Compounds as Potential Antifungals to Overcome the Emergence of Multidrug-Resistant Fungi.Pharmaceuticals (Basel). 2021 May 20;14(5):488. doi: 10.3390/ph14050488. Pharmaceuticals (Basel). 2021. PMID: 34065420 Free PMC article. Review.
-
The Stress of Fungicides Changes the Expression of Clock Protein CmFRQ and the Morphology of Fruiting Bodies of Cordyceps militaris.J Fungi (Basel). 2024 Feb 13;10(2):150. doi: 10.3390/jof10020150. J Fungi (Basel). 2024. PMID: 38392822 Free PMC article.
-
Selective Flamingo Medium for the Isolation of Aspergillus fumigatus.Microorganisms. 2021 May 27;9(6):1155. doi: 10.3390/microorganisms9061155. Microorganisms. 2021. PMID: 34072240 Free PMC article.
-
Mitogenome Variations in a Global Population of Aspergillus fumigatus.J Fungi (Basel). 2023 Oct 8;9(10):995. doi: 10.3390/jof9100995. J Fungi (Basel). 2023. PMID: 37888251 Free PMC article.
-
Chronic Occupational Mold Exposure Drives Expansion of Aspergillus-Reactive Type 1 and Type 2 T-Helper Cell Responses.J Fungi (Basel). 2021 Aug 27;7(9):698. doi: 10.3390/jof7090698. J Fungi (Basel). 2021. PMID: 34575736 Free PMC article.
References
-
- Leading International Fungal Education . Invasive aspergillosis. http://www.life-worldwide.org/fungal-diseases/invasive-aspergillosis. Accessed 1 November 2019.
-
- Patterson TF, Thompson GR, Denning DW, Fishman JA, Hadley S, Herbrecht R, Kontoyiannis DP, Marr KA, Morrison VA, Nguyen MH, Segal BH, Steinbach WJ, Stevens DA, Walsh TJ, Wingard JR, Young J-AH, Bennett JE. 2016. Practice guidelines for the diagnosis and management of aspergillosis: 2016 update by the Infectious Diseases Society of America. Clin Infect Dis 63:433–442. doi:10.1093/cid/ciw444. - DOI - PMC - PubMed
Publication types
MeSH terms
Substances
LinkOut - more resources
Full Text Sources
Molecular Biology Databases

