Integrated Proteo-Transcriptomic Analyses Reveal Insights into Regulation of Pollen Development Stages and Dynamics of Cellular Response to Apple Fruit Crinkle Viroid (AFCVd)-Infection in Nicotiana tabacum
- PMID: 33218043
- PMCID: PMC7698868
- DOI: 10.3390/ijms21228700
Integrated Proteo-Transcriptomic Analyses Reveal Insights into Regulation of Pollen Development Stages and Dynamics of Cellular Response to Apple Fruit Crinkle Viroid (AFCVd)-Infection in Nicotiana tabacum
Abstract
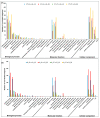
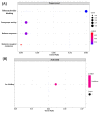
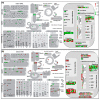
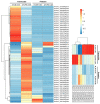
Tobacco (Nicotiana tabacum) pollen is a well-suited model for studying many fundamental biological processes owing to its well-defined and distinct development stages. It is also one of the major agents involved in the transmission of infectious viroids, which is the primary mechanism of viroid pathogenicity in plants. However, some viroids are non-transmissible and may be possibly degraded or eliminated during the gradual process of pollen development maturation. The molecular details behind the response of developing pollen against the apple fruit crinkle viroid (AFCVd) infection and viroid eradication is largely unknown. In this study, we performed an integrative analysis of the transcriptome and proteome profiles to disentangle the molecular cascade of events governing the three pollen development stages: early bicellular pollen (stage 3, S3), late bicellular pollen (stage 5, S5), and 6 h-pollen tube (PT6). The integrated analysis delivered the molecular portraits of the developing pollen against AFCVd infection, including mechanistic insights into the viroid eradication during the last steps of pollen development. The isobaric tags for label-free relative quantification (iTRAQ) with digital gene expression (DGE) experiments led us to reliably identify subsets of 5321, 5286, and 6923 proteins and 64,033, 60,597, and 46,640 expressed genes in S3, S5, and PT6, respectively. In these subsets, 2234, 2108 proteins and 9207 and 14,065 mRNAs were differentially expressed in pairwise comparisons of three stages S5 vs. S3 and PT6 vs. S5 of control pollen in tobacco. Correlation analysis between the abundance of differentially expressed mRNAs (DEGs) and differentially expressed proteins (DEPs) in pairwise comparisons of three stages of pollen revealed numerous discordant changes in mRNA/protein pairs. Only a modest correlation was observed, indicative of divergent transcription, and its regulation and importance of post-transcriptional events in the determination of the fate of early and late pollen development in tobacco. The functional and enrichment analysis of correlated DEGs/DEPs revealed the activation in pathways involved in carbohydrate metabolism, amino acid metabolism, lipid metabolism, and cofactor as well as vitamin metabolism, which points to the importance of these metabolic pathways in pollen development. Furthermore, the detailed picture of AFCVd-infected correlated DEGs/DEPs was obtained in pairwise comparisons of three stages of infected pollen. The AFCVd infection caused the modulation of several genes involved in protein degradation, nuclear transport, phytohormone signaling, defense response, and phosphorylation. Intriguingly, we also identified several factors including, DNA-dependent RNA-polymerase, ribosomal protein, Argonaute (AGO) proteins, nucleotide binding proteins, and RNA exonucleases, which may plausibly involve in viroid stabilization and eradication during the last steps of pollen development. The present study provides essential insights into the transcriptional and translational dynamics of tobacco pollen, which further strengthens our understanding of plant-viroid interactions and support for future mechanistic studies directed at delineating the functional role of candidate factors involved in viroid elimination.
Keywords: AFCVd propagation and eradication; Nicotiana tabacum; Proteome; RNA sequencing; RT qPCR; male gametophyte; viroid degradation; viroid replication.
Conflict of interest statement
The authors declare no conflict of interest.
Figures


Similar articles
-
Transformation of Seed Non-Transmissible Hop Viroids in Nicotiana benthamiana Causes Distortions in Male Gametophyte Development.Plants (Basel). 2021 Nov 6;10(11):2398. doi: 10.3390/plants10112398. Plants (Basel). 2021. PMID: 34834761 Free PMC article.
-
Elimination of Viroids from Tobacco Pollen Involves a Decrease in Propagation Rate and an Increase of the Degradation Processes.Int J Mol Sci. 2020 Apr 24;21(8):3029. doi: 10.3390/ijms21083029. Int J Mol Sci. 2020. PMID: 32344786 Free PMC article.
-
Mapping the Gene Expression Spectrum of Mediator Subunits in Response to Viroid Infection in Plants.Int J Mol Sci. 2020 Apr 3;21(7):2498. doi: 10.3390/ijms21072498. Int J Mol Sci. 2020. PMID: 32260277 Free PMC article.
-
Vertical and Horizontal Transmission of Pospiviroids.Viruses. 2018 Dec 12;10(12):706. doi: 10.3390/v10120706. Viruses. 2018. PMID: 30545048 Free PMC article. Review.
-
Viroid Diseases in Pome and Stone Fruit Trees and Koch's Postulates: A Critical Assessment.Viruses. 2018 Nov 7;10(11):612. doi: 10.3390/v10110612. Viruses. 2018. PMID: 30405008 Free PMC article. Review.
Cited by
-
Transformation of Seed Non-Transmissible Hop Viroids in Nicotiana benthamiana Causes Distortions in Male Gametophyte Development.Plants (Basel). 2021 Nov 6;10(11):2398. doi: 10.3390/plants10112398. Plants (Basel). 2021. PMID: 34834761 Free PMC article.
References
-
- Škorić D. Viroids and Satellites. Elsevier; Amsterdam, The Netherlands: 2017. Viroid biology; pp. 53–61.
MeSH terms
Grants and funding
LinkOut - more resources
Full Text Sources

