. 2021 Jan 28;95(4):e01800-20.
doi: 10.1128/JVI.01800-20. Print 2021 Jan 28.

Dual Effects of Let-7b in the Early Stage of Hepatitis C Virus Infection

Affiliations

Dual Effects of Let-7b in the Early Stage of Hepatitis C Virus Infection

Yung-Ju Yeh et al. J Virol. .

Abstract

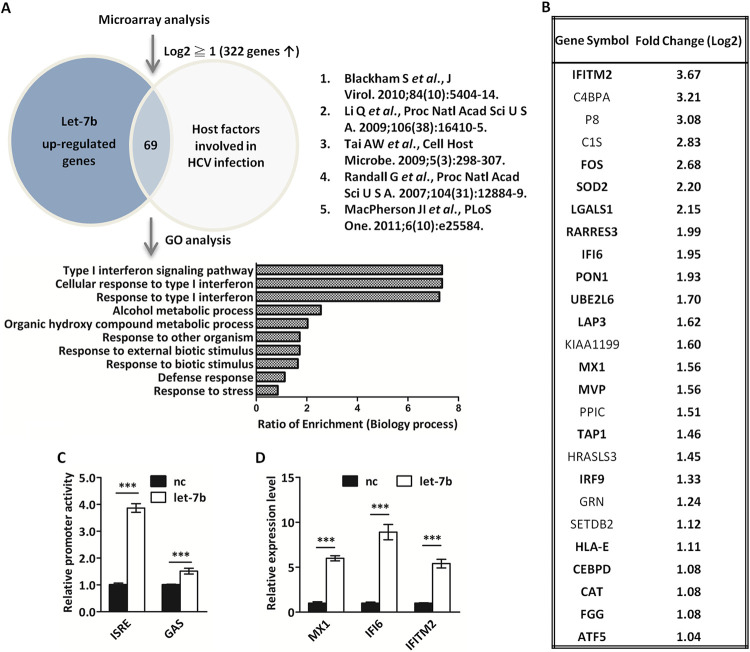
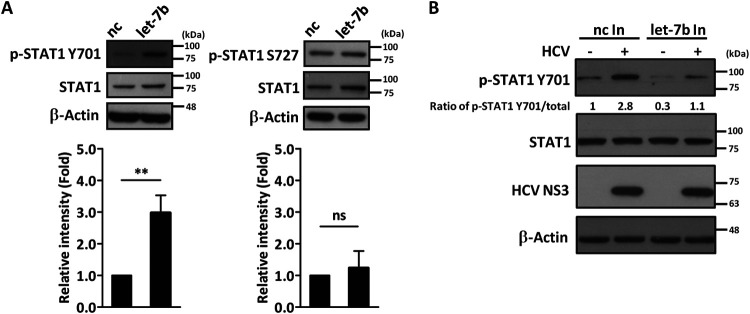
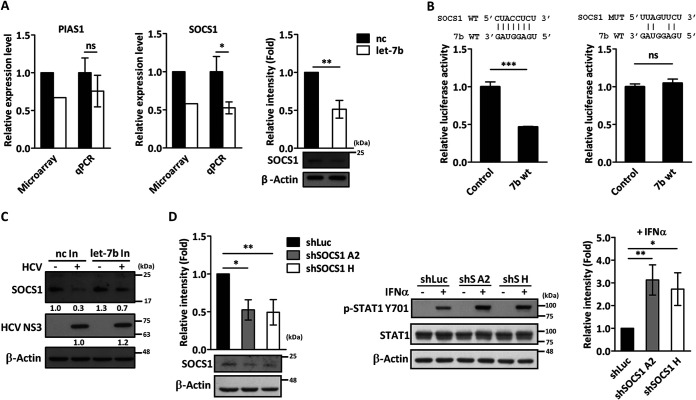
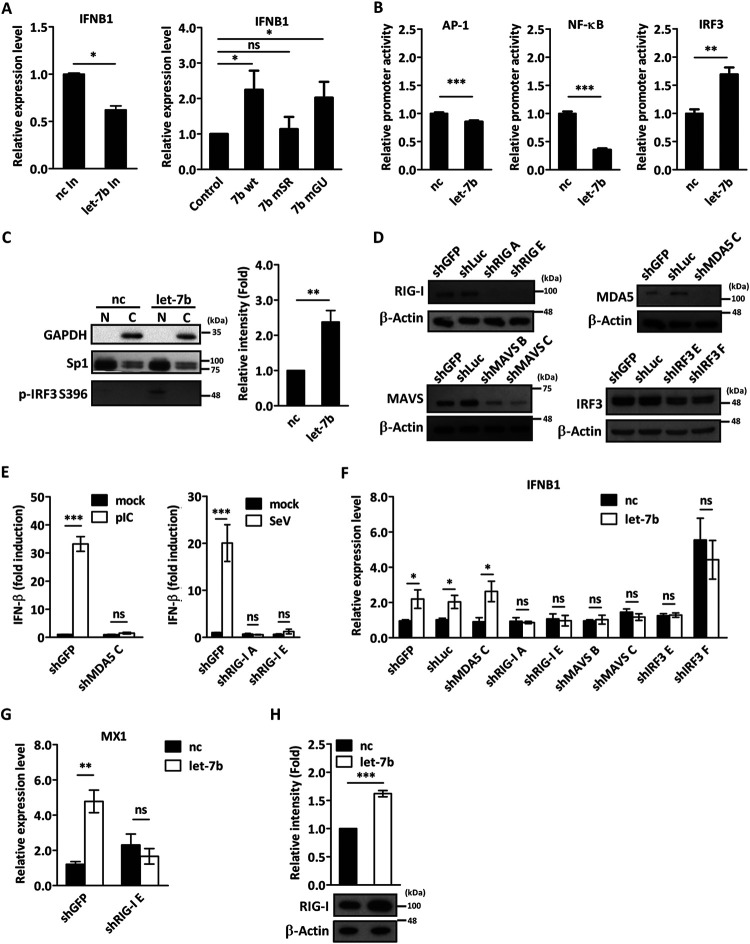
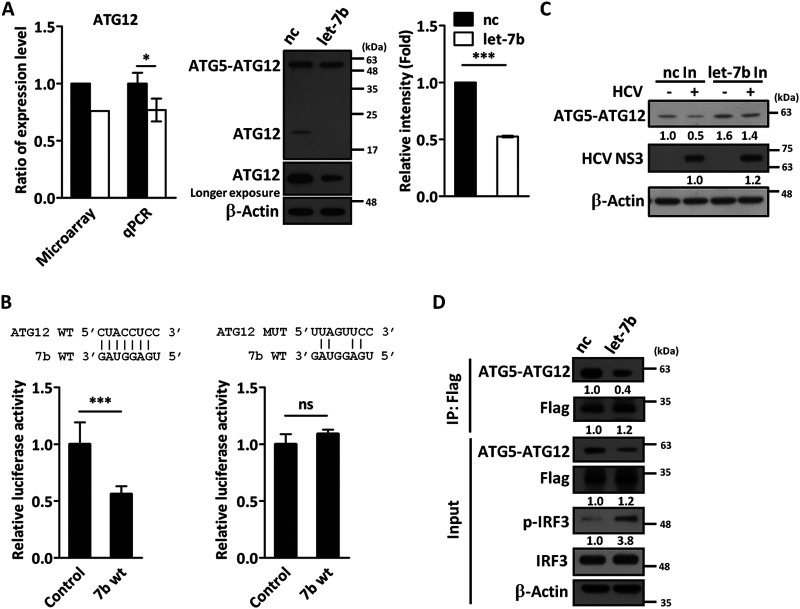
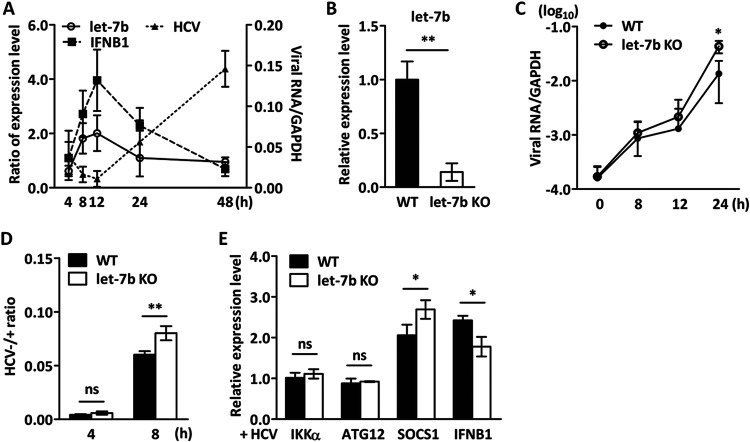
MicroRNA let-7b expression is induced by infection of hepatitis C virus (HCV) and is involved in the regulation of HCV replication by directly targeting the HCV genome. The current study demonstrated that let-7b directly targets negative regulators of type I interferon (IFN) signaling thereby limiting HCV replication in the early stage of HCV infection. Let-7b-regulated genes which are involved in host cellular responses to HCV infection were unveiled by microarray profiling and bioinformatic analyses, followed by various molecular and cellular assays using Huh7 cells expressing wild-type (WT) or the seed region-mutated let-7b. Let-7b targeted the cytokine signaling 1 (SOCS1) protein, a negative regulator of JAK/STAT signaling, which then enhanced STAT1-Y701 phosphorylation leading to increased expression of the downstream interferon-stimulated genes (ISGs). Let-7b augmented retinoic acid-inducible gene I (RIG-I) signaling, but not MDA5, to phosphorylate and nuclear translocate IRF3 leading to increased expression of IFN-β. Let-7b directly targeted the ATG12 and IκB kinase alpha (IKKα) transcripts and reduced the interaction of the ATG5-ATG12 conjugate and RIG-I leading to increased expression of IFN, which may further stimulate JAK/STAT signaling. Let-7b induced by HCV infection elicits dual effects on IFN expression and signaling, along with targeting the coding sequences of NS5B and 5' UTR of the HCV genome, and limits HCV RNA accumulation in the early stage of HCV infection. Controlling let-7b expression is thereby crucial in the intervention of HCV infection.IMPORTANCE HCV is a leading cause of liver disease, with an estimated 71 million people infected worldwide. During HCV infection, type I interferon (IFN) signaling displays potent antiviral and immunomodulatory effects. Host factors, including microRNAs (miRNAs), play a role in upregulating IFN signaling to limit HCV replication. Let-7b is a liver-abundant miRNA that is induced by HCV infection and targets the HCV genome to suppress HCV RNA accumulation. In this study, we demonstrated that let-7b, as a positive regulator of type I IFN signaling, plays dual roles against HCV replication by increasing the expression of IFN and interferon-sensitive response element (ISRE)-driven interferon-stimulated genes (ISGs) in the early stage of HCV infection. This study sheds new insight into understanding the role of let-7b in combatting HCV infection. Clarifying IFN signaling regulated by miRNA during the early phase of HCV infection may help researchers understand the initial defense mechanisms to other RNA viruses.

Keywords: hepatitis C virus; interferon; let-7b.


Figures

FIG 1
FIG 1
Identification of the genes upregulated by let-7b and involved in type I interferon signaling. (A) Microarray analysis was performed to profile gene expression of Huh7 cells transfected with let-7b or control miRNA (nc). The 322 genes that were upregulated by let-7b with a fold change of log2 ≥ 1 were cross-analyzed with the genes that were reported to be involved in the HCV life cycle in the references shown (18–22). A Venn diagram shows the 69 genes that were upregulated by let-7b and were involved in HCV infection. Differentially expressed genes were selected, and enrichment analyses were performed using the Gene Ontology database (biological process) (P < 0.01). The ratio of enrichment refers to the number of observed genes divided by the number of reference genes. (B) The list presents 26 genes that were upregulated by let-7b and appeared in the interferon-regulated gene databases. The 18 genes that are associated with HCV infection are in bold. (C) The pISRE-luc or pGAS-luc plasmid was cotransfected with the indicated miRNA and pRL-TK into Huh7 cells. The firefly and Renilla luciferase activities were measured at 48 h after transfection, and the promoter activity was defined as the ratio of firefly to Renilla luciferase activity. The promoter activity for the constructs cotransfected with the negative-control miRNA (nc) was arbitrarily denoted as 1.0. Data represent the mean ± SD (n = 3; ***, P < 0.001). (D) Huh7 cells were transfected with let-7b or control miRNA (nc), and the expression of the selected let-7b upregulated genes was validated by RT-qPCR. The level of gene expression in the cells transfected with control miRNA (nc) was arbitrarily denoted as 1.0. Data represent the mean ± SD (n = 3; ***, P < 0.001).
FIG 2
FIG 2
Seed region of let-7b was essential for regulating ISRE-driven ISG expression. (A) The sequences of the seed region and GU region for the wild type (7b WT), seed region mutant (7b mSR), and GU region mutant (7b mGU) are shown. Base substitutions are underlined. (B) The indicated miRNA was cotransfected with pISRE-luc and pRL-TK into Huh7 cells. The firefly and Renilla luciferase activities were measured at 48 h after transfection, and the promoter activity was defined as the ratio of firefly to Renilla luciferase activity (left). On the other hand, Huh7 cells were transfected with the indicated miRNA, and the expression of MX1 and OAS1 was determined by RT-qPCR (middle and right). The promoter activity of pISRE-luc and the level of gene expression in the cells transfected with control miRNA (control) were arbitrarily denoted as 1.0. Data represent the mean ± SD (n = 3; **, P < 0.01; ***, P < 0.001; ns, not significant).
FIG 3
FIG 3
Let-7b induced STAT1 Y701 phosphorylation during HCV infection. (A) Huh7 cells were transfected with either let-7b or the negative-control miRNA (nc). At 72 h posttransfection, cell lysates were collected for Western blotting using anti-STAT1, anti-p-STAT1-Y701, and anti-p-STAT1-S727 antibodies. The expression of β-actin was used as an equal loading control. The relative levels of the phosphorylated status of STAT1 in the cells transfected with let-7b and nc were presented. Data represented the mean ± SD (n = 3; **, P < 0.01; ns, not significant). (B) Huh7 cells were transfected with negative-control miRNA inhibitor (nc In) or let-7b inhibitor (let-7b In) for 48 h. The transfected cells were reseeded and then infected with HCVcc (JFH-1, MOI of 3) for 6 h. The cell lysates were collected for Western blotting using the antibodies against the indicated proteins. The expression of β-actin was used as an equal loading control. The levels of STAT1-Y701 phosphorylation and the expression of NS3 protein among different experimental groups were determined by using the Image J analysis software.
FIG 4
FIG 4
SOCS1 was the target gene of let-7b on JAK/STAT signaling. (A) Huh7 cells were transfected with let-7b or negative-control miRNA (nc). At 72 h posttransfection, the RNA levels of PIAS1 and SOCS1 were measured by RT-qPCR (left and middle, respectively). The relative expression levels of PIAS1 and SOCS1 as revealed in the microarray studies are also shown. SOCS1 expression in Huh7 cells transfected with nc or let-7b were further analyzed by Western blotting and were quantified by Image J analysis (right). (B) The pluc-SOCS1-WT or pluc-SOCS1-MUT plasmid was cotransfected with let-7b or its control miRNA (control) and pRL-TK into Huh7 cells. At 48 h posttransfection, the cell extracts were collected and the luciferase activity was measured. The relative firefly versus Renilla luciferase activities were determined. The luciferase activity for the control miRNA (nc) was denoted arbitrarily as 1.0. Data represent the mean ± SD (n = 3). (C) Huh7 cells were transfected with control miRNA inhibitor (nc In) or let-7b inhibitor (let-7b In) for 48 h. The transfected cells were reseeded and then infected with HCVcc (JFH-1, MOI of 3) for 6 h. At 48 h postinfection, the cell lysates were collected for Western blotting by using antibodies against the indicated proteins. The expression of β-actin was used as a loading control. (D) Huh7 cells were infected with shSOCS1 (A2 and H, MOI of 3) for 24 h followed by selection with 2 μg/ml puromycin in culture medium. After incubation for 48 h, cell lysates were collected to determine the expression of SOCS1 by Western blotting. The level of SOCS1 expression for the cells expressing control shRNA (shLuc) was denoted as 1.0 (left). Furthermore, the cells with SOCS1 knockdown were treated with or without 0.1 ng/ml IFN-α for 15 min, followed by Western blotting (middle). Image J analysis was performed for quantifying STAT1 phosphorylation.*, P < 0.05; **, P < 0.01; ***, P < 0.001; ns, not significant.
FIG 5
FIG 5
Let-7b induced IFN-β expression through the RIG-I signaling pathway. (A) Huh7 cells were transfected with the indicated inhibitor (left) or miRNAs (right) for 48 h. The expression of IFN-β was determined by RT-qPCR. The expression of the control miRNA inhibitor (nc) or miRNA (control) was denoted arbitrarily as 1.0. (B) Let-7b or the control miRNA (nc) was cotransfected with pRL-TK and the indicated reporter plasmid containing basic promoter element and the indicated transcriptional factor binding sequences of the IFN promoter into Huh7 cells. Luciferase activity was measured at 48 h posttransfection. The relative firefly versus Renilla luciferase activities were determined. The promoter activity of control miRNA (nc) was denoted arbitrarily as 1.0. (C) Huh7 cells were transfected with either let-7b or control miRNA (nc). At 72 h posttransfection, the cell lysates were collected and separated into nuclear (N) and cytosolic (C) fractions. The phosphorylation status of Ser396 on IRF3 (p-IRF3 S396) was determined by Western blotting (left). The nuclear protein Sp1 was used as a control for the nuclear fraction, while the cytosolic protein GAPDH was used as a control for the cytosolic fraction. For quantification, the levels of p-IRF3 S396 were normalized by the expression of SP1, and the value of nc group was denoted arbitrarily as 1.0 (right). (D) Huh7 cells were infected with the indicated lentiviral vector-based shRNA. At 48 h posttransfection, the expression of the indicated proteins were determined by Western blotting using antibodies against the indicated proteins. The expression of β-actin was used as a loading control. (E) Huh7 cells were infected with the indicated lentiviral vector-based shRNA. At 24 h postinfection, the cells were transfected with pIFN-β-luc and pRL-TK and stimulated with 100 ng/ml poly(I·C) (pIC, left) for 16 h or infected with Sendai virus (SeV) (200 hemagglutinating units [HAU]/ml, right) for 20 h. Luciferase activity was measured at 48 h after stimulation or infection, and the relative firefly versus Renilla luciferase activities were determined. The luciferase activity of the cells infected with shGFP and with mock treatment was denoted arbitrarily as 1.0. (F) Huh7 cells infected with the indicated lentiviral vector-based shRNA were transfected with control miRNA (nc) or let-7b. The cellular RNA was collected at 24 h posttransfection, and the expression of IFN-β was determined by RT-qPCR. The level of IFN-β expression in the cells infected with shGFP and transfected with control miRNA (nc) was denoted arbitrarily as 1.0. (G) Huh7 cells infected with the indicated lentiviral vector-based shRNA were transfected with the control miRNA (nc) or let-7b. The cellular RNA was collected at 24 h posttransfection, and the level of MX1 expression was determined by RT-qPCR. The level of MX1 expression in the cells infected with shGFP andtransfected with control miRNA was denoted arbitrarily as 1.0. (H) Huh7 cells were transfected with control miRNA (nc) or let-7b. At 72 h posttransfection, cell lysates were collected for Western blotting using the anti-RIG-I antibody. The expression of β-actin was used as a loading control. RIG-I expression in the cells transfected with control miRNA was denoted arbitrarily as 1.0. Data represent the mean ± SD (n = 3). *, P < 0.05; **, P < 0.01; ***, P < 0.001; ns, not significant.
FIG 6
FIG 6
Let-7b targeted negative regulator ATG12 of RIG-I signaling. (A) Huh7 cells were transfected with either let-7b or control miRNA (nc). At 72 h posttransfection, the mRNA level of ATG12 was measured by RT-qPCR (left). The relative expression level of ATG12 as revealed in the microarray studies are also shown. ATG12 and ATG5-ATG12 expression in Huh7 cells transfected with either nc or let-7b were further analyzed by Western blotting (middle) and were quantified (right). The expression of β-actin was used as a loading control. ATG12 expression in the nc group was denoted arbitrarily as 1.0 (B) The pluc-ATG12 WT or pluc-ATG12 MUT were cotransfected with pRL-TK and the indicated miRNA into Huh7 cells. Luciferase activity was measured at 48 h posttransfection. The relative firefly versus Renilla luciferase activities were determined, and the luciferase activity in the control miRNA (control)-transfected cells was denoted arbitrarily as 1.0. Data represent the mean ± SD (n = 3). (C) Huh7 cells were transfected with the inhibitor of control miRNA inhibitor (nc In) or let-7b (let-7b In) for 48 h. The transfected cells were reseeded and then infected with cell culture-derived infectious HCV (HCVcc) (JFH-1, MOI of 3) for 6 h. The protein lysates were collected at 24 h postinfection for Western blotting using the antibodies against the indicated proteins. Quantification was performed by Image J analysis. (D) Huh7 cells were transfected with control miRNA (nc) or let-7b. At 72 h posttransfection, the cells were reseeded and transfected with pEF-Bos-Flag N-RIG-I. Cell lysates were collected for immunoprecipitation using the anti-Flag M2 agarose beads. The cell lysate (input) and immunoprecipitated protein complexes were analyzed by Western blotting using antibodies against the indicated proteins. *, P < 0.05; ***, P < 0.001; ns, not significant.
FIG 7
FIG 7
Let-7b targets IKKα and regulates the expression of ATG5. (A) Huh7 cells were transfected with let-7b or control miRNA (nc). At 72 h posttransfection, the RNA levels of ATG5 and IKKα were measured by RT-qPCR (left and middle). The relative expression levels of ATG5 and IKKα as revealed in the microarray studies are also shown. IKKα expression in Huh7 cells transfected with control miRNA (nc) or let-7b was further analyzed by Western blotting and was quantified by Image J analysis (right). The expression of β-actin was used as a loading control. The expression level of ATG5 and IKKα in nc-transfected cells was denoted arbitrarily as 1.0. (B) The pluc-CHUK WT or pluc-CHUK MUT construct was cotransfected with pRL-TK and the indicated miRNA into Huh7 cells. Luciferase activity was measured at 48 h posttransfection. The relative firefly versus Renilla luciferase activities were determined, and the luciferase activity in the cells transfected with control miRNA (control) was denoted arbitrarily as 1.0. Data represent the mean ± SD (n = 3). (C) The expression of IKKα and ATG5-ATG12 conjugate in Huh7 cells expressing the indicated shRNA was determined by Western blotting using the antibodies against the indicated proteins and was quantified by Image J analysis (left). The RNA levels of ATG5 in Huh7 cells expressing the indicated shRNA was determined and quantified by RT-qPCR (middle). The total RNA from Huh7 cells expressing the indicated shRNA and transfected with control miRNA (nc) or let-7b were collected for RT-qPCR analysis of IFN-β expression. The level of IFN-β in Huh7 cells expressing shGFP and transfected with nc was denoted arbitrarily as 1.0. Data represent the mean ± SD (n = 3). (D) Huh7 cells were infected with HCVcc (JFH-1, MOI of 3) for the indicated time. Cell lysates were collected for Western blotting using the antibodies against the indicated proteins. The expression of β-actin was used as a loading control. *, P < 0.05; **, P < 0.01; ***, P < 0.001; ns, not significant.
FIG 8
FIG 8
Let-7b targeted SOCS1, ATG12, and IKKα genes to modulate HCV replication. (A) Huh7 cells were infected with HCVcc (JFH-1, MOI of 3). The total RNAs of the infected cells were collected at the indicated time points for quantification of let-7b, interferon beta 1 (IFN-β1), and HCV expression by RT-qPCR. (B) Let-7b expression in let-7b knockout cells (let-7b KO) and parental Huh7 cells (WT). (C) Huh7 or let-7b KO cells were infected with HCVcc (JFH-1, MOI of 3). The total RNAs of the infected cells were collected at the indicated time points for an analysis of HCV expression by RT-qPCR. (D) The levels of negative- and positive-sense RNA of HCV were detected at 4 and 8 h postinfection. The ratio of HCV negative- to positive-sense RNA was presented. (E) Huh7 (WT) or let-7b KO cells were infected with HCVcc (JFH-1, MOI of 3). At 12 h postinfection, total cellular RNAs were collected for an RT-qPCR analysis of the indicated genes. The level of IKKα in HCV-infected Huh7 cells was denoted arbitrarily as 1.0. Data represent the mean ± SD (n = 3). *, P < 0.05; **, P < 0.01; ns, not significant.
FIG 9
FIG 9
Proposed model for the dual effects of let-7b on interferon expression and signaling in the early stage of HCV infection. Let-7b was induced during the early stage of HCV infection. By targeting and downregulating IKKα and ATG12 transcripts, let-7b led to the attenuated ATG5 and ATG12 expression, respectively. This subsequently caused a decrease in the formation of the ATG5-ATG12 conjugate, leading to an increase in IFN-β expression. On the other hand, let-7b targeted and downregulated SOCS1, leading to the augmentation JAK/STAT1 signaling and the expression of ISGs. The proteins or protein complex representing the negative regulators of IFN expression and signaling were denoted with an asterisk (*).

Similar articles

Cited by

References

    1. Szabo G, Bala S. 2013. MicroRNAs in liver disease. Nat Rev Gastroenterol Hepatol 10:542–552. doi:10.1038/nrgastro.2013.87. - DOI - PMC - PubMed
    1. Liu X, Wang T, Wakita T, Yang W. 2010. Systematic identification of microRNA and messenger RNA profiles in hepatitis C virus-infected human hepatoma cells. Virology 398:57–67. doi:10.1016/j.virol.2009.11.036. - DOI - PubMed
    1. Steuerwald NM, Parsons JC, Bennett K, Bates TC, Bonkovsky HL. 2010. Parallel microRNA and mRNA expression profiling of (genotype 1b) human hepatoma cells expressing hepatitis C virus. Liver Int 30:1490–1504. doi:10.1111/j.1478-3231.2010.02321.x. - DOI - PubMed
    1. Li H, Jiang JD, Peng ZG. 2016. MicroRNA-mediated interactions between host and hepatitis C virus. World J Gastroenterol 22:1487–1496. doi:10.3748/wjg.v22.i4.1487. - DOI - PMC - PubMed
    1. Li Q, Lowey B, Sodroski C, Krishnamurthy S, Alao H, Cha H, Chiu S, El-Diwany R, Ghany MG, Liang TJ. 2017. Cellular microRNA networks regulate host dependency of hepatitis C virus infection. Nat Commun 8:1789. doi:10.1038/s41467-017-01954-x. - DOI - PMC - PubMed

Publication types

MeSH terms