

In vivo imaging of injured cortical axons reveals a rapid onset form of Wallerian degeneration
- PMID: 33208154
- PMCID: PMC7677840
- DOI: 10.1186/s12915-020-00869-2
In vivo imaging of injured cortical axons reveals a rapid onset form of Wallerian degeneration
Abstract
Background: Despite the widespread occurrence of axon and synaptic loss in the injured and diseased nervous system, the cellular and molecular mechanisms of these key degenerative processes remain incompletely understood. Wallerian degeneration (WD) is a tightly regulated form of axon loss after injury, which has been intensively studied in large myelinated fibre tracts of the spinal cord, optic nerve and peripheral nervous system (PNS). Fewer studies, however, have focused on WD in the complex neuronal circuits of the mammalian brain, and these were mainly based on conventional endpoint histological methods. Post-mortem analysis, however, cannot capture the exact sequence of events nor can it evaluate the influence of elaborated arborisation and synaptic architecture on the degeneration process, due to the non-synchronous and variable nature of WD across individual axons.
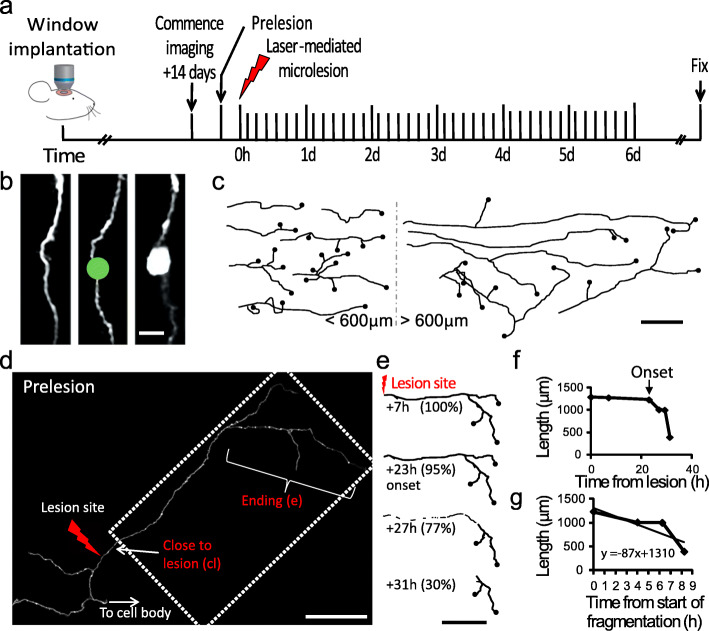
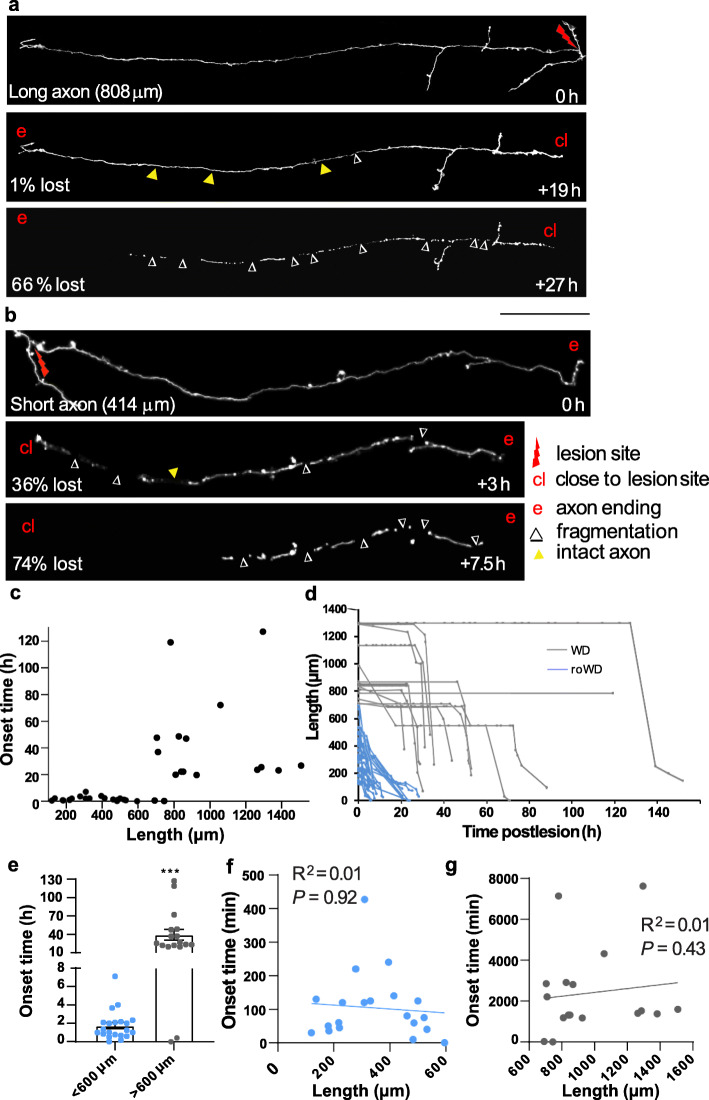
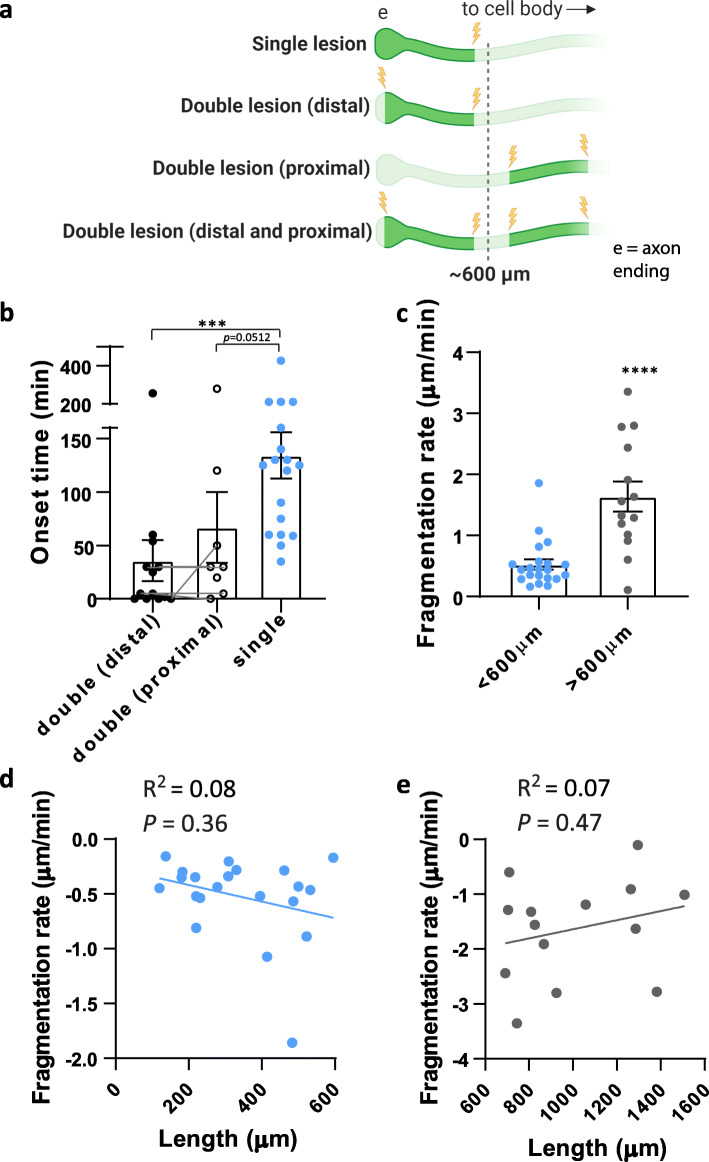
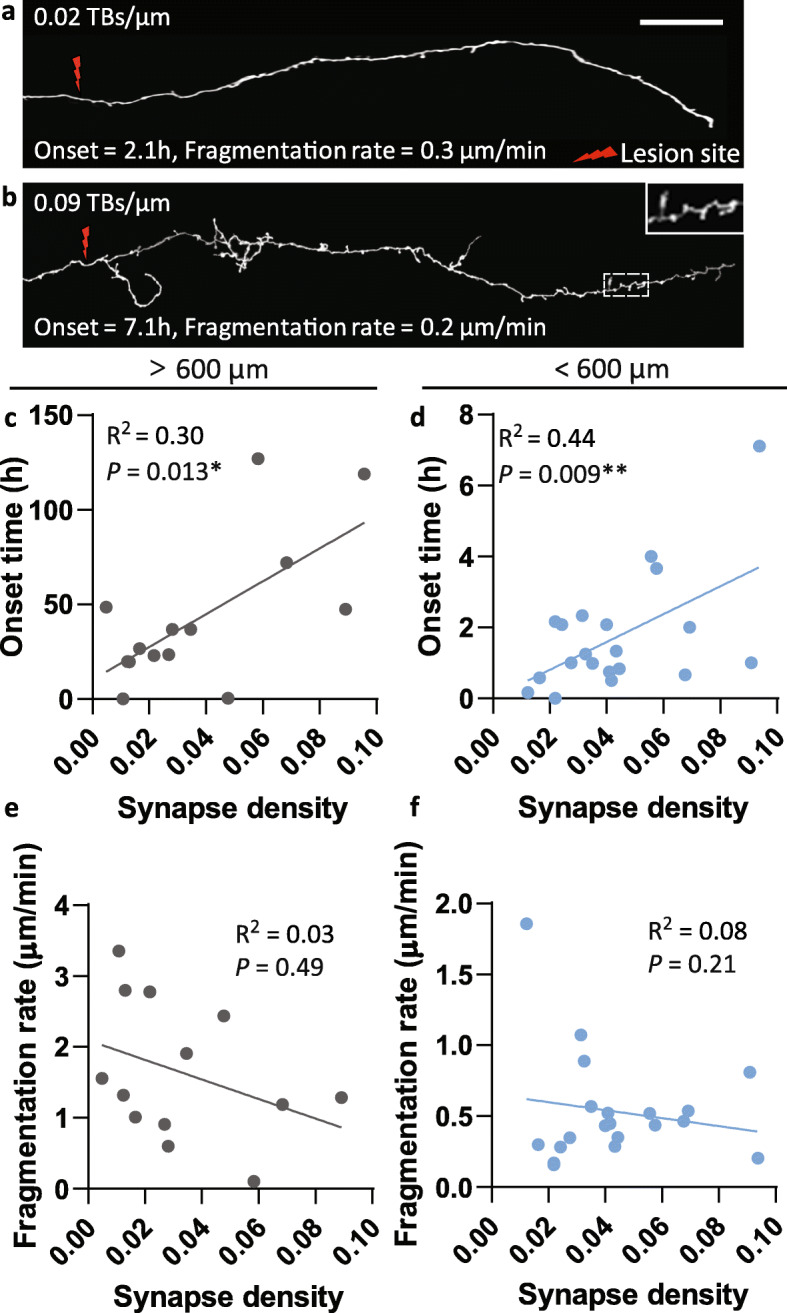
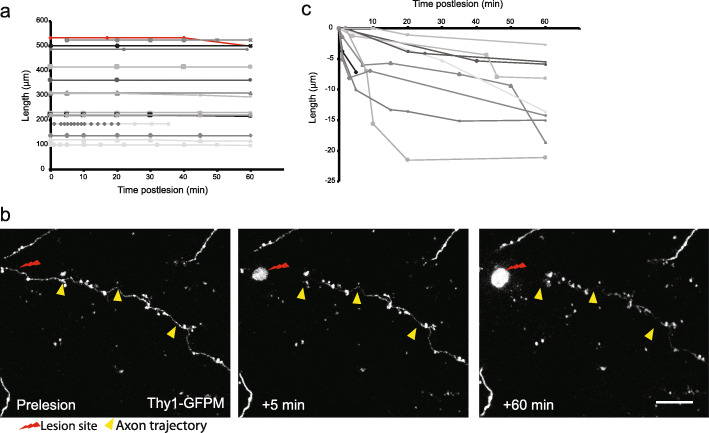
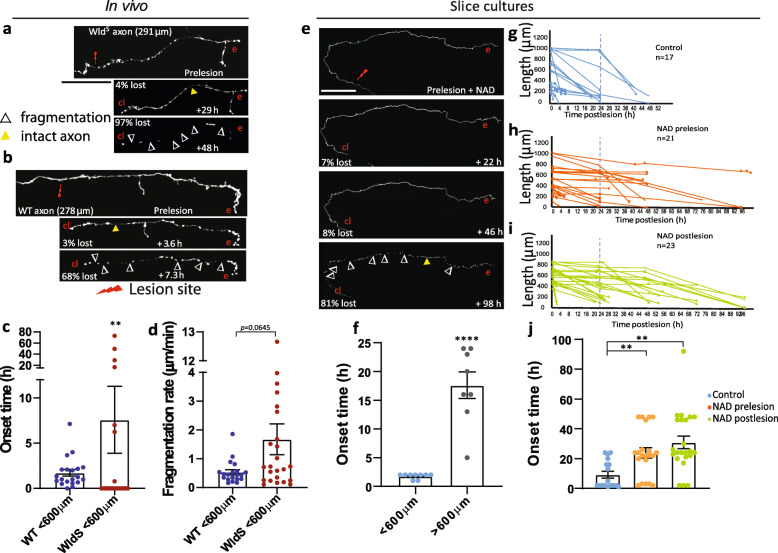
Results: To gain a comprehensive picture of the spatiotemporal dynamics and synaptic mechanisms of WD in the nervous system, we identify the factors that regulate WD within the mouse cerebral cortex. We combined single-axon-resolution multiphoton imaging with laser microsurgery through a cranial window and a fluorescent membrane reporter. Longitudinal imaging of > 150 individually injured excitatory cortical axons revealed a threshold length below which injured axons consistently underwent a rapid-onset form of WD (roWD). roWD started on average 20 times earlier and was executed 3 times slower than WD described in other regions of the nervous system. Cortical axon WD and roWD were dependent on synaptic density, but independent of axon complexity. Finally, pharmacological and genetic manipulations showed that a nicotinamide adenine dinucleotide (NAD+)-dependent pathway could delay cortical roWD independent of transcription in the damaged neurons, demonstrating further conservation of the molecular mechanisms controlling WD in different areas of the mammalian nervous system.
Conclusions: Our data illustrate how in vivo time-lapse imaging can provide new insights into the spatiotemporal dynamics and synaptic mechanisms of axon loss and assess therapeutic interventions in the injured mammalian brain.
Keywords: Acute Axonal Degeneration; Axon dieback; Axon fragmentation; Brain; Cortex; Cortical axons; In vivo imaging; Laser microsurgery; NAD+; Synapses; Wallerian degeneration.
Conflict of interest statement
The authors declare no competing interests.
Figures
Similar articles
-
Wallerian degeneration of zebrafish trigeminal axons in the skin is required for regeneration and developmental pruning.Development. 2010 Dec;137(23):3985-94. doi: 10.1242/dev.053611. Epub 2010 Nov 1. Development. 2010. PMID: 21041367 Free PMC article.
-
Mislocalization of neuronal mitochondria reveals regulation of Wallerian degeneration and NMNAT/WLD(S)-mediated axon protection independent of axonal mitochondria.Hum Mol Genet. 2013 Apr 15;22(8):1601-14. doi: 10.1093/hmg/ddt009. Epub 2013 Jan 11. Hum Mol Genet. 2013. PMID: 23314018 Free PMC article.
-
Wallerian degeneration: an emerging axon death pathway linking injury and disease.Nat Rev Neurosci. 2014 Jun;15(6):394-409. doi: 10.1038/nrn3680. Nat Rev Neurosci. 2014. PMID: 24840802 Review.
-
Live Imaging of Calcium Dynamics during Axon Degeneration Reveals Two Functionally Distinct Phases of Calcium Influx.J Neurosci. 2015 Nov 11;35(45):15026-38. doi: 10.1523/JNEUROSCI.2484-15.2015. J Neurosci. 2015. PMID: 26558774 Free PMC article.
-
NAD+, Axonal Maintenance, and Neurological Disease.Antioxid Redox Signal. 2023 Dec;39(16-18):1167-1184. doi: 10.1089/ars.2023.0350. Epub 2023 Sep 7. Antioxid Redox Signal. 2023. PMID: 37503611 Free PMC article. Review.
Cited by
-
Partial connectomes of labeled dopaminergic circuits reveal non-synaptic communication and axonal remodeling after exposure to cocaine.Elife. 2021 Dec 29;10:e71981. doi: 10.7554/eLife.71981. Elife. 2021. PMID: 34965204 Free PMC article.
-
A Brief Review of In Vitro Models for Injury and Regeneration in the Peripheral Nervous System.Int J Mol Sci. 2022 Jan 13;23(2):816. doi: 10.3390/ijms23020816. Int J Mol Sci. 2022. PMID: 35055003 Free PMC article. Review.
-
Approaches to quantify axonal morphology for the analysis of axonal degeneration.Neural Regen Res. 2023 Feb;18(2):309-310. doi: 10.4103/1673-5374.343904. Neural Regen Res. 2023. PMID: 35900409 Free PMC article. No abstract available.
References
Publication types
MeSH terms
Grants and funding
LinkOut - more resources
Full Text Sources
